


The market registered gains in four out of five days in the week ended July 8 and clocked a 3 percent rally to end above the 16,200 mark on the Nifty, backed by positive global cues with declining oil prices and volatility. On Friday, the index climbed half a percent to 16,221.
The Nifty50 filled its recent bearish gap zone by closing decisively above hurdle of 16,172 levels on Friday and formed bullish candlestick pattern on the weekly scale with higher high higher low formation for third consecutive week, indicating the trend is favourable for bulls. The index can march towards 16,500, the next hurdle, if it sustains above 16,000 mark, the crucial support, in coming sessions, experts said.
"The index has surpassed its crucial hurdle of 16,178. This indicates that the market will be showing a bigger pullback to retrace the entire correction from 18,115 (April 2022 high) to the recent swing low of 15,184," Ruchit Jain, Lead Research at 5paisa.com said.
He further said the 50 percent retracement of this correction is seen around 16,650 while the '200-day EMA' (exponential moving average) hurdle is around 16,550. Hence, he expects the Nifty to continue its up-move in the short term towards 16,550-16,650.
On the flipside, the support base is shifting higher with the index upmove and the support has now shifted to 16,000-15,900 range, he said. Even the option writers have built positions in 16,000 strike which hints this to be an important support.
In the coming week, small corrections for one to two sessions cannot be ruled out but any such corrections should be used as a buying opportunity, the expert advised.
Here are the top 10 trading ideas by experts for the next three-four weeks. Returns are based on the July 8 closing prices:
Nagaraj Shetti, Technical Research Analyst at HDFC Securities
KEC International: Buy | LTP: Rs 411.1 | Stop-Loss: Rs 385 | Target: Rs 450 | Return: 9.5 percent
The weekly timeframe chart of KEC International indicates that the stock price has been in a larger consolidation pattern over the last few months. The stock price is currently finding strong resistance (as per the concept of change in polarity) around Rs 415 levels. Hence, a sustainable move above this area could open sharp upside for the stock price ahead.
We observe a formation higher bottoms on the weekly chart and last week's low at Rs 381 could be considered as a new higher bottom of the sequence. Weekly 14 period RSI (relative strength index) showing positive indication. One may expect further strengthening of upside momentum in the stock price ahead.
Buying can be initiated in KEC at CMP (Rs 411), add more on dips down to Rs 400, wait for the upside target of Rs 450 in the next 3-4 weeks. Place a stop-loss of Rs 385.

EIH: Buy | LTP: Rs 134 | Stop-Loss: Rs 125 | Target: Rs 147 | Return: 10 percent
The down trend of the last few months seems to have completed in this hotel stock (EIHOTEL), as we observe a sustainable upside bounce this week as per weekly chart. The formation of swing low at Rs 120.25 in the week before last signal a formation of important bottom reversal pattern.
The formation of doji or high wave type weekly candle patterns in the last two weeks, placement of uptrend line support and double bottom formation (slight lower bottom) are all suggesting further sustainable upside for the stock price ahead. Volume has started to rise during upside movement in the stock price and weekly 14 period RSI shows positive indication.
One may look to buy EIH at CMP (Rs 134), add more on dips down to Rs 130 and wait for the upside target of Rs 147 in the next 3-4 weeks. Place a stop-loss of Rs 125.

Shrikant Chouhan, Head of Equity Research (Retail) at Kotak Securities
M&M Financial Services: Buy | LTP: Rs 198 | Stop-Loss: Rs 185 | Target: Rs 230 | Return: 16 percent
The stock was consolidating between the trading range of Rs 160 and Rs 190 for two months. However, last Friday the stock broke an important resistance level with an expansion in volume and closed above the same.
On higher levels, it would find minor resistance at Rs 210 level. The strategy should be to buy at current levels and lower around Rs 190. Place stop-loss at Rs 185.

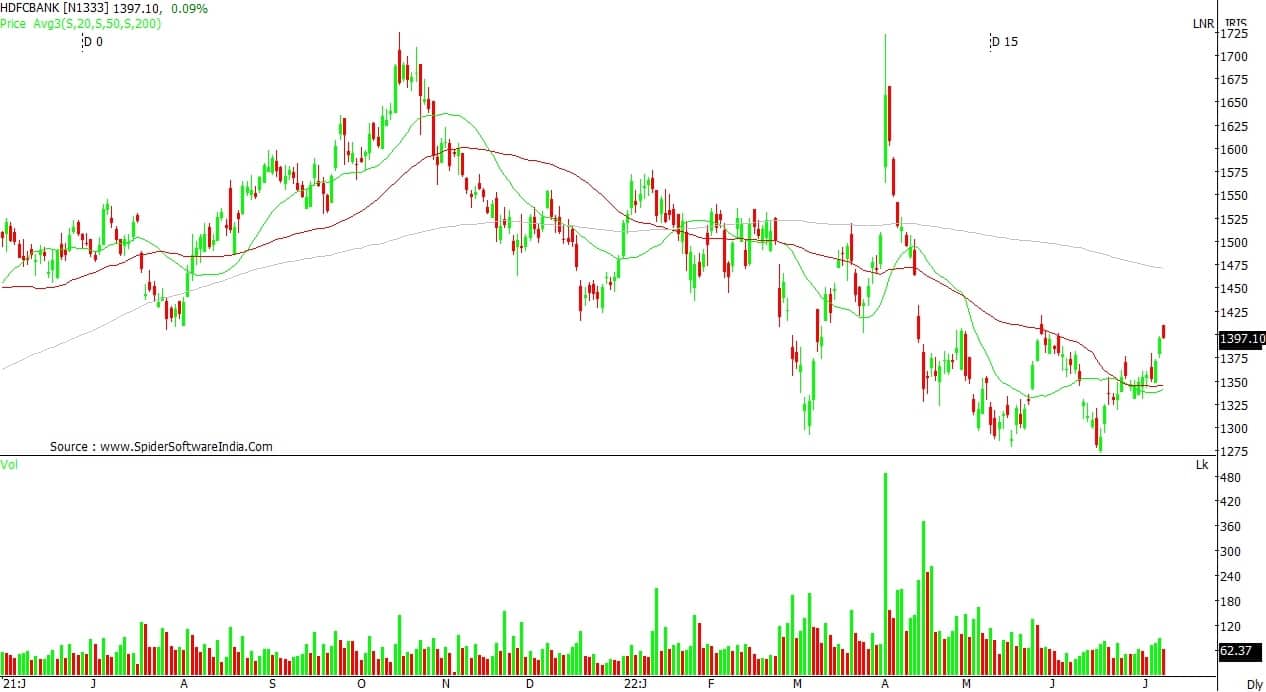
HDFC Bank: Buy | LTP: Rs 1,397 | Stop-Loss: Rs 1,330 | Target: Rs 1,550 | Return: 11 percent
The stock is forming a rising top and rising bottom series and on a weekly basis. It closed above the level of Rs 1,370, which is positive for the stock. On the dismissal of Rs 1,420, the stock will validate the formation of a double bottom.
Above Rs 1,420 level, it will rally to Rs 1,500 and Rs 1,550 levels. It is advisable to buy 50 percent at current levels and balance at Rs 1,370. For the same place a stop-loss at Rs 1,330.
IRB Infrastructure Developers: Buy | LTP: Rs 210 | Stop-Loss: Rs 190 | Target: Rs 250 | Return: 19 percent
It is forming a falling wedge. It is a bullish consolidation formation and it is a long elongated triangle, which took time to hit the target, which is at Rs 346.
However, in the medium term, we can see the level of Rs 250, which is a good upside from the current levels. The strategy should be to buy at current levels and balance at Rs 200 with a stop-loss at Rs 190.

Jatin Gohil, Technical & Derivative Analyst at Reliance Securities
Container Corporation of India: Buy | LTP: Rs 657 | Stop-loss: Rs 585 | Target: Rs 780 | Return: 19 percent
Since September 2021, the stock oscillated downwards amidst profit booking and after a Double Bottom formation, it has created higher low as well. On the week ended July 8, the stock breached its prior falling trend and rose to 6-week closing high, where volume was above average.
Its weekly RSI gave buy signal after a bullish divergence. This could take the stock towards Rs 718-753-780 in the short-term.
In case of any decline, the stock will find support around its recent higher low formation, which is placed at Rs 585.

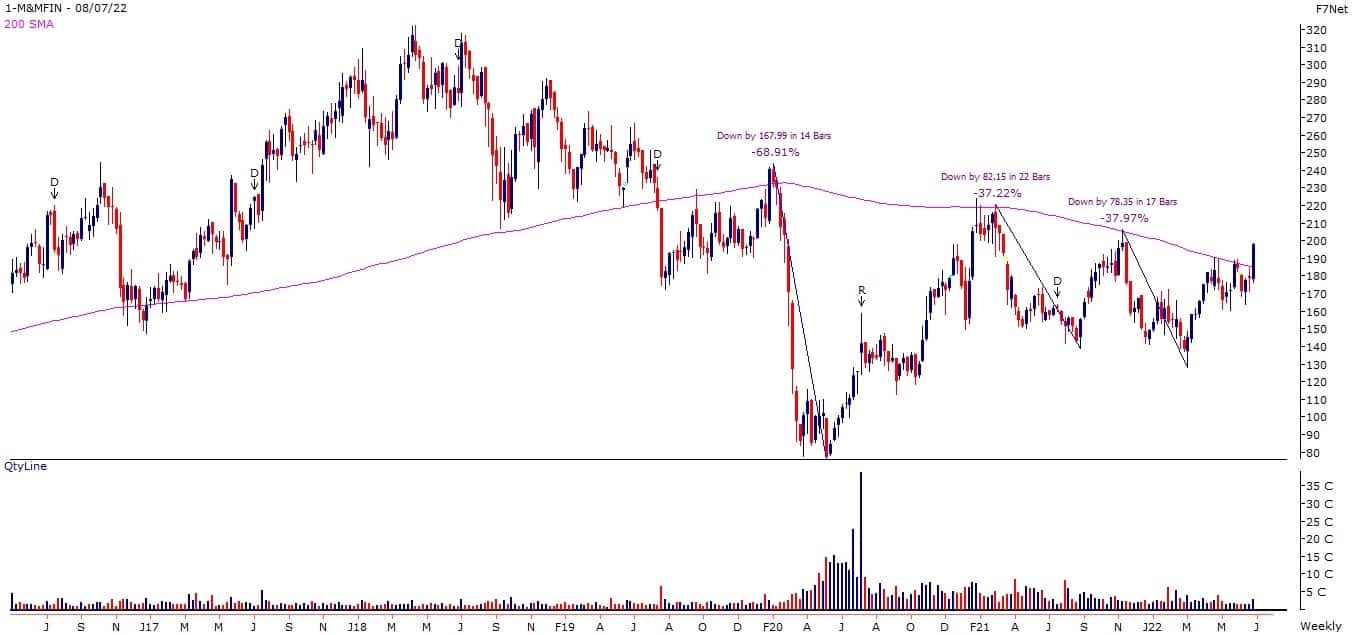
Mahindra & Mahindra Financial Services: Buy | LTP: Rs 198 | Stop-Loss:Rs 164 | Target: Rs 244 | Return: 23 percent
On the week ended July 8, closing above its 200-week SMA, the stock breached its prior bearish jinx, as it used to reverse after testing that moving average and did register noticeable falls. Spike in volume and rise in future open interest (OI) signals that major market participants are in favour of the bulls.
The key technical indicators are positively poised on short-term timeframe charts. We believe the stock may witness a follow-up move.
This could lead the stock towards Rs 224 initially and Rs 244 subsequently. On the lower side, the stock will find support around its prior month's lowest level, which is placed at Rs 164.
Dalmia Bharat: Buy | LTP: Rs 1,434 | Stop-Loss: Rs 1,290 | Target: Rs 1,730 | Return: 21 percent
The stock tested its 61.8 percent Fibonacci Retracement level of prior mega up-move (Rs 403-2,548), which was placed at Rs 1,220 in June 2022. After forming a base around that level, the stock witnessed a strong rebound.
Its weekly RSI gave buy signal post a bullish divergence. We believe the stock is on the verge of a turnaround.
The stock has potential to move towards Rs 1,640 initially and Rs 1,730 subsequently in the short-term. In case of any decline, the stock will find support around its upper band of the base.

Ruchit Jain, Lead Research at 5paisa.com
Bharti Airtel: Buy | LTP: Rs 695.15 | Stop-Loss: Below Rs 666 | Target: Rs 835 | Return: 6 percent
In the recent corrective phase, the stock has taken support around its swing low of Rs 640 and has seen a pullback move. Prices have given breakout from a falling trendline resistance and the short term average has given a positive crossover above the medium term indicating a positive trend.
The ‘RSI Smoothed’ oscillator is in buy mode and is showing a positive momentum.
Hence, traders can look to buy the stock in the range of Rs 695-692 for potential targets of Rs 730 and Rs 735. The stop-loss on long positions should be placed below Rs 666.

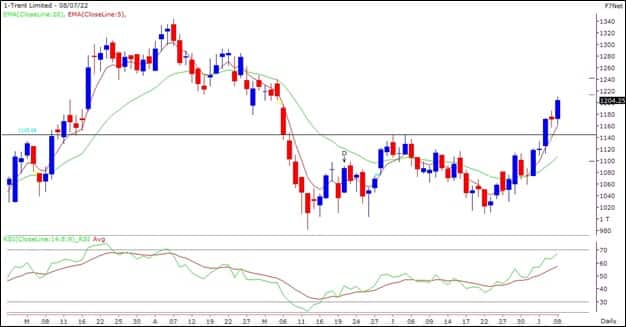
Trent: Buy | LTP: Rs 1,204.25 | Stop-Loss: Below Rs 1,140 | Target: Rs 1,300 | Return: 8 percent
The stock has seen a pullback move in the last couple of weeks and has now given a breakout above its important hurdle of Rs 1,145. Prices are riding to the upper Bollinger band and the bands are rising indicating a positive trend.
The momentum oscillator is also indicating a positive structure and hence, we expect further up move in the stock in the near term.
Thus, traders can look to buy the stock in the range of Rs 1,200-1,190 for potential targets of Rs 1,300 in the near term. The stop- loss for long positions can be placed below Rs 1,140.
Discover the latest Business News, Sensex, and Nifty updates. Obtain Personal Finance insights, tax queries, and expert opinions on Moneycontrol or download the Moneycontrol App to stay updated!
Find the best of Al News in one place, specially curated for you every weekend.
Stay on top of the latest tech trends and biggest startup news.


