By falling more than 1 percent on August 29, the Nifty has confirmed lower top and lower bottom on the daily chart. The benchmark closed below its 21 days EMA (exponential moving average) support placed at 17,391. In the week ended August 19, the Nifty formed bearish 'Shooting Star' candlestick pattern on the weekly charts, which was the first sign of correction in the index.
At present, the index is in continuation of a short-term downtrend and the correction could extend towards the next support of 16,900, which happens to be 38.2 percent retracement of the entire rise seen from 15,183 to 17,992.
Indicators and oscillators like RSI (relative strength index), MACD (moving average convergence and divergence) and DMI (directional movement index) have turned bearish on the Nifty daily Chart, which confirms the short-term down trend for the benchmark index.
However, breadth of the market does not seem to be under pressure at all. The Smallcap Index has not violated its 21-day EMA, rather it closed near the day’s high on August 29. The Nifty Midcap and Smallcap indices have formed a bullish Marubozu candlestick pattern on the daily chart, which indicates that there is so much buying interest in the underlying that the market participants were willing to buy the stock at every price point during the day.
Considering the evidences discussed above, we believe that the markets will remain stock-specific with participation of small-cap and mid-cap stocks. However, the benchmark index would remain in a short-term correction mode where the next support is seen at 16,900. Resistance for the Nifty is seen at 17,500 and 17,725.
Here are three buy calls for next 2-3 weeks:
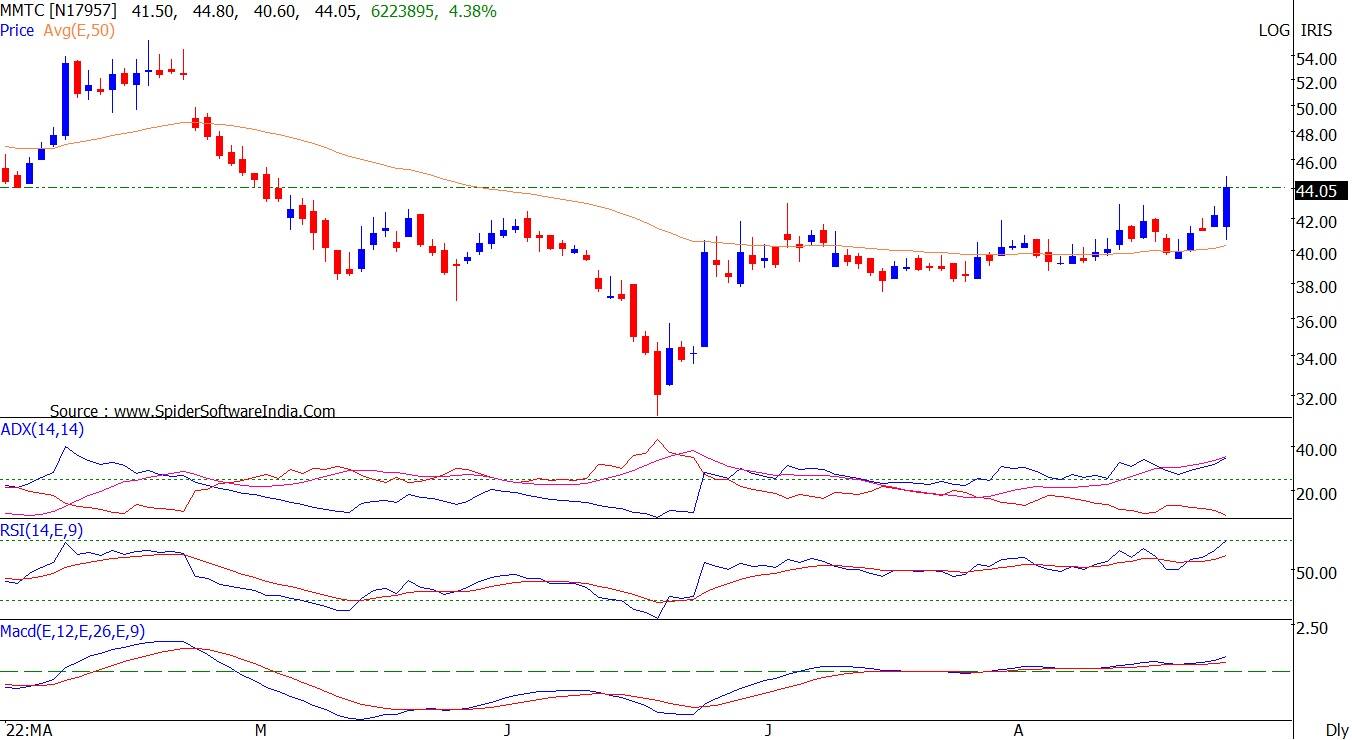
MMTC: Buy | LTP: Rs 44.1 | Stop-Loss: Rs 40.5 | Targets: Rs 49-53 | Return: 11-20 percent
The stock has broken out from multi-week consolidation with rising volumes. It has also surpassed the crucial resistance of its 200 days EMA, placed at Rs 42.
Indicators and oscillators have been showing strength on the daily chart.
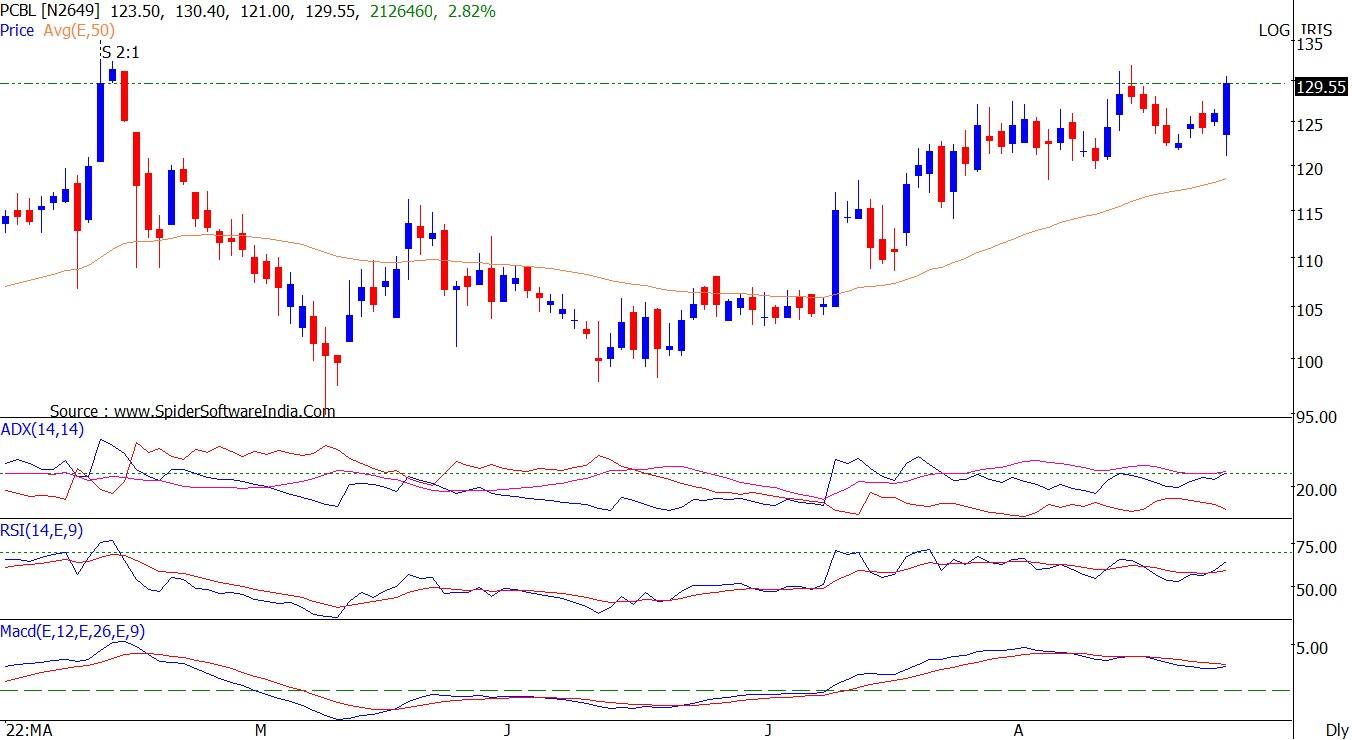
PCBL: Buy | LTP: Rs 129.65 | Stop-Loss: Rs 118 | Targets: Rs 144-153 | Return: 11-18 percent
The stock has been forming higher tops and higher bottoms on the daily chart. The stock is placed above all important moving averages, indicating bullish trend on all time frames.
It is on the verge of registering new all-time high above Rs 135.
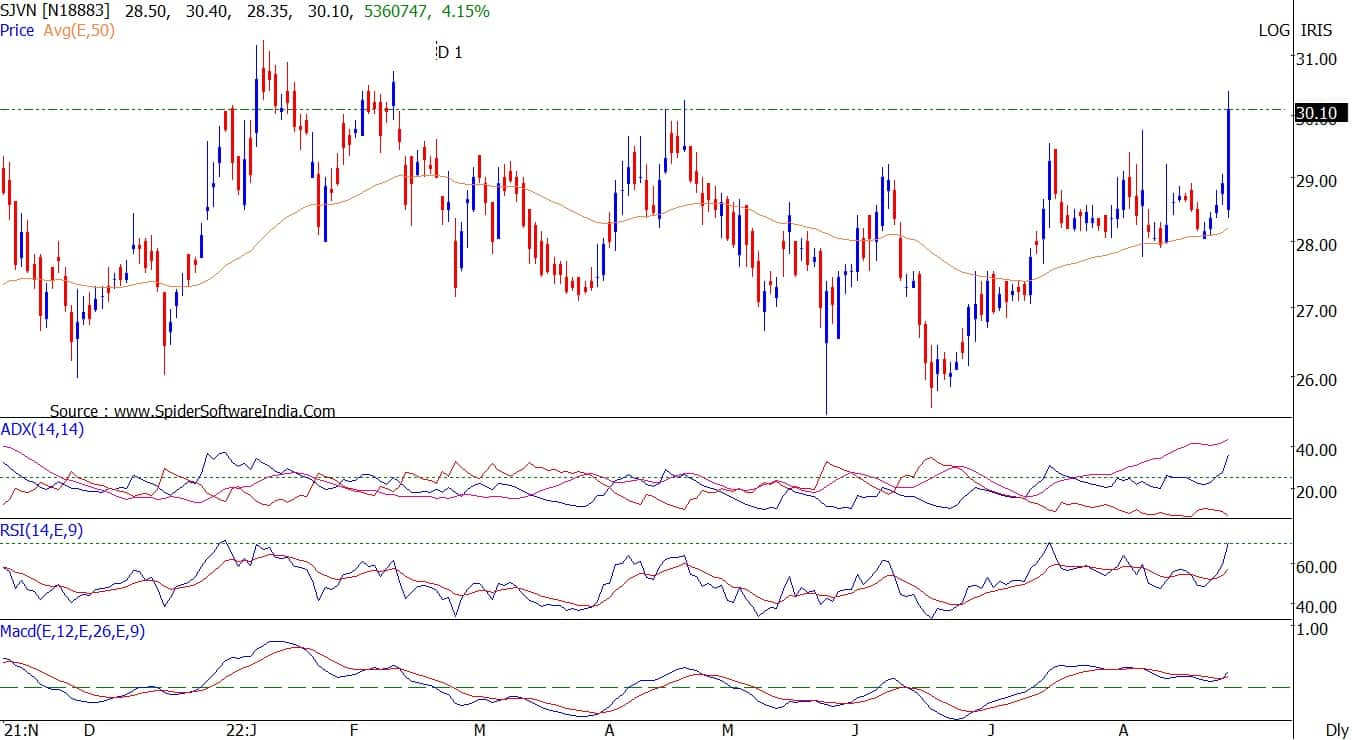
SJVN: Buy | LTP: Rs 29.95 | Stop-Loss: Rs 28 | Targets: Rs 34-37 | Return: 13-23 percent
The stock has broken out from the narrow consolidation which held for last 7 weeks. Price breakout is accompanied with jump in volumes.
PSU sector has been outperforming for last two months and same is expected to continue. Stock has been finding support on its 50 days EMA placed at Rs 28 odd levels. Indicators and oscillators setup is bullish on daily and weekly charts.
Disclaimer: The views and investment tips expressed by investment experts on Moneycontrol.com are their own and not those of the website or its management. Moneycontrol.com advises users to check with certified experts before taking any investment decisions.

Discover the latest Business News, Sensex, and Nifty updates. Obtain Personal Finance insights, tax queries, and expert opinions on Moneycontrol or download the Moneycontrol App to stay updated!
Find the best of Al News in one place, specially curated for you every weekend.
Stay on top of the latest tech trends and biggest startup news.