


On the weekly timeframe, we can spot that the prices have taken support from the 61.8 percent Fibonacci retracement level of the prior advance from 16,747 (September 2022) till 18,887 (December 2022), which is again in sync with the descending trend line which shows change in the polarity.
Nifty on weekly charts have got into Lower Low, Lower High Formation which points towards the negative under tone of the prices.
The momentum indicator RSI (relative strength index), plotted on the weekly timeframe is moving near 50 level confirming the lack of positive momentum.
The Nifty has immediate resistance placed at 17,770 (multiple touch points) followed by 18,265 (key resistance) levels. The downside support for the index is placed at 17,353 (prior day low) followed by 17,200 (key support).
Based on the overall trend and indications from indicators, it is expected that the Nifty will move lower to 17,353 followed by 17,200 mark.


Here are three buy calls for next 2-3 weeks:
Mahindra CIE Automotive: Buy | LTP: Rs 400.40 | Stop-Loss: Rs 360 | Target: Rs 480 | Return: 20 percent
Mahindra CIE's current stock price is trading at an all-time high, which demonstrates the strong upward momentum of the stock.
After testing the neckline of an Inverse Head & Shoulder pattern, the stock experienced an upward bounce in the first week of January 2023.
The breakout is confirmed as up move in prices is accompanied by higher volumes.
The expansion of the Bollinger Band on the daily chart is a sign of increased price volatility, indicating potential for further upward movement.
The sustained level of the RSI above 50 reflects a positive momentum for a potential upward trend.
Going ahead we expect the prices to move higher till the level of Rs 480 where the stop-loss must be Rs 360 on the closing basis.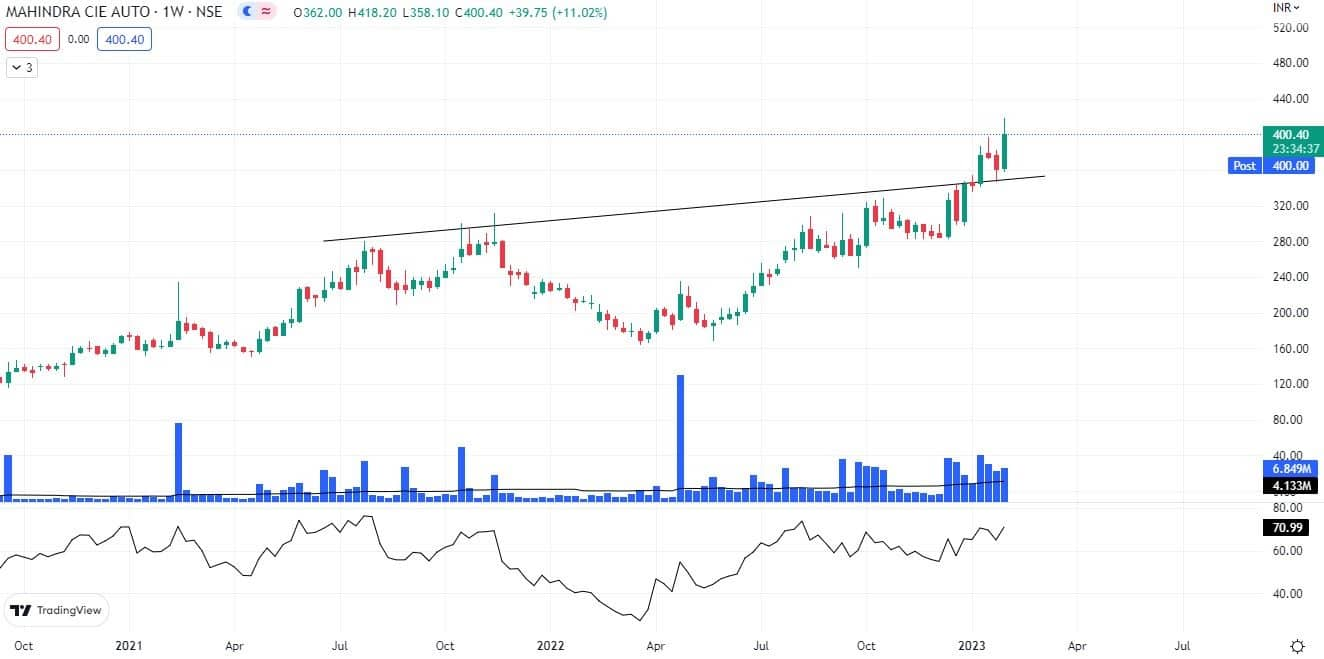
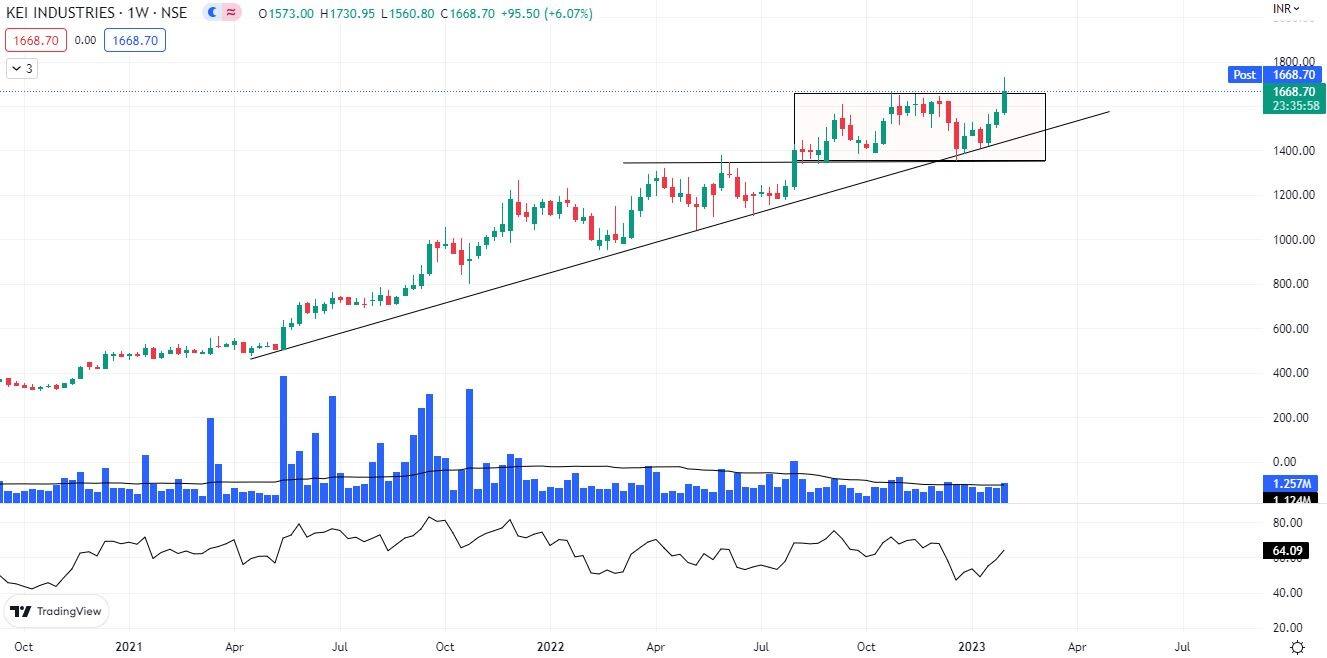
KEI Industries: Buy | LTP: 1,669 | Stop-Loss: Rs 1,530 | Target: Rs 2,000 | Return: 20 percent
Around the level of Rs 1,400, KEI has witnessed change in the polarity of the prices, which points towards the rising bullish sentiment behind prices.
The stock in the latest week has given a breakout from the rectangle pattern which indicates beginning of the trend to the upside.
The stock on the Daily timeframe is continuously hovering near Upper Bollinger band which shows the rising volatility for up move.
The momentum indicator RSI is currently trading above 60 mark on daily as well as on weekly timeframe which reflects the presence of strong momentum.
Going ahead we expect the prices to move higher till the level of Rs 2,000 where the stop-loss must be Rs 1,530 on the closing basis.
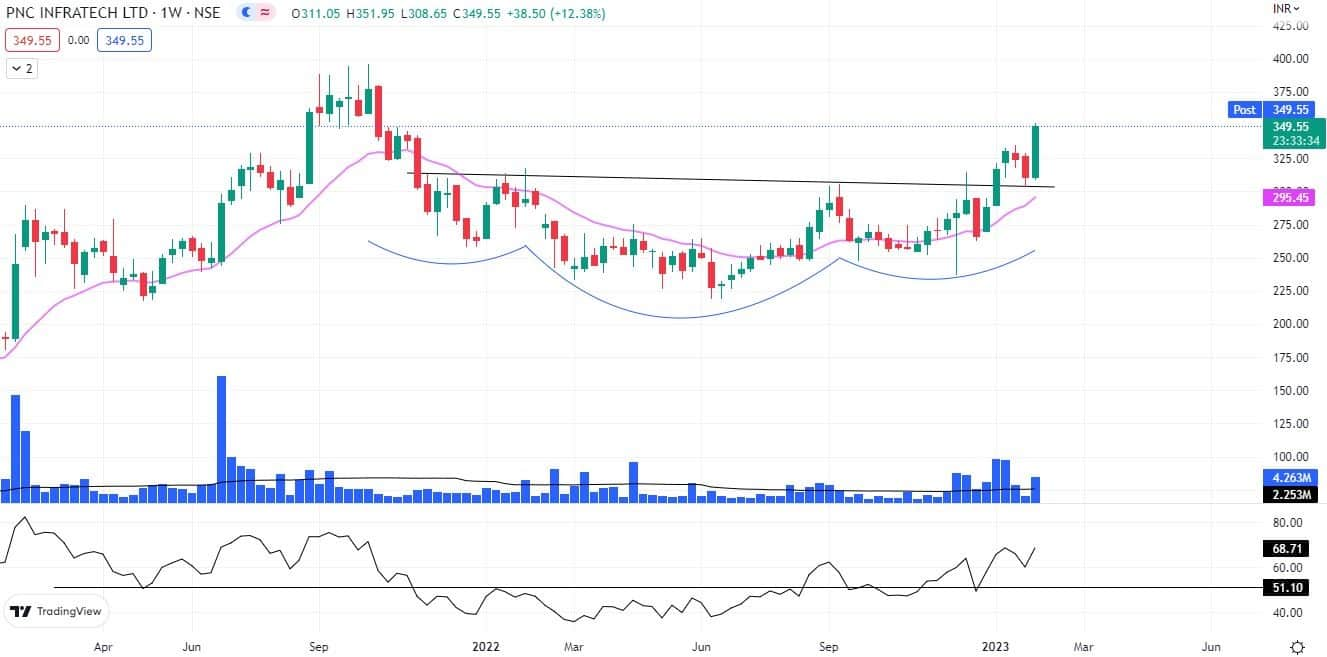
PNC Infratech: Buy | LTP: Rs 349.55 | Stop-Loss: Rs 325 | Target: Rs 395 | Return: 13 percent
PNC Infratech's stock price has broken through its previous swing high of Rs 335 (January 16, 2023), indicating a potential change in trend towards positive side. This move also validates the continuation previous pattern of Higher Highs and Higher Lows.
The stock now has witnessed an up move post the break out of Inverse Head & Shoulder pattern which was exhibited on January 2, 2023. This Indicated beginning of the trend to the upside.
The stock price has recovered after reaching the 18-week exponential moving average (EMA), which has previously provided support for the price on previous occasions.
The weekly relative strength index (RSI) has failed to reach lower levels (swing failure), indicating that the upward momentum of the stock is increasing.
Going ahead we expect the prices to go higher till Rs 395 level where stop-loss must be Rs 325 on the closing basis.
Disclaimer: The views and investment tips expressed by investment experts on Moneycontrol.com are their own and not those of the website or its management. Moneycontrol.com advises users to check with certified experts before taking any investment decisions.

Discover the latest Business News, Sensex, and Nifty updates. Obtain Personal Finance insights, tax queries, and expert opinions on Moneycontrol or download the Moneycontrol App to stay updated!
Find the best of Al News in one place, specially curated for you every weekend.
Stay on top of the latest tech trends and biggest startup news.


