
Indian equity benchmarks ended lower for the 2nd consecutive session due to selling in banking and metal indices on November 10. The benchmark index Nifty50 is trading in a broad range of 200 points (17,850-18,050) and is facing resistance at higher levels.
Prices completed bullish ABCD Harmonic pattern at 17,613 on October 29 and since then the index never dipped below its potential reversal zone on the daily time frame. The index has also managed to close marginally above its 21-day exponential moving average in last three trading sessions.
Since October 29, the benchmark index has been trading in a narrow range smaller degree rising channel pattern on the daily chart. Nifty has formed Bullish Harami candlestick pattern in the weekly chart and prices are also sustaining above its upward rising trend line.
Prices have also witnessed a breakdown of a rising channel pattern and currently facing a strong resistance at the upper band of the channel on the daily time frame. On the indicator front, momentum oscillator RSI (14) has turned flattish near 50-levels which indicates a lack of momentum in the current price structure.
The immediate support for the Nifty50 is placed near 17,800 and if prices break below these levels, 17,630 will be the next level to watch for. The immediate resistance for the prices is capped near 18,250-levels.
Here are three buy calls for next 2-3 weeks:
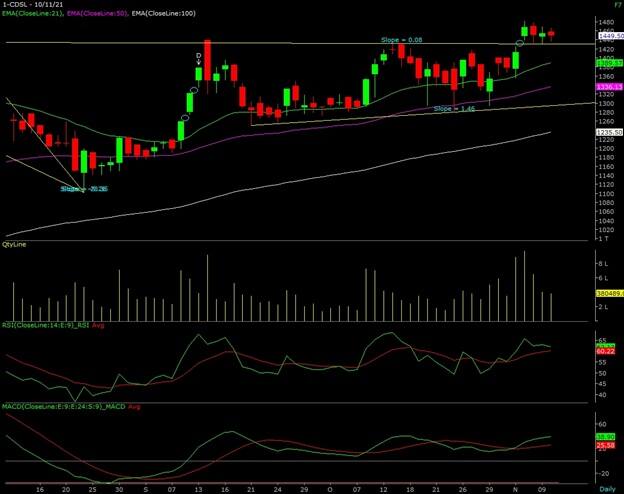
CDSL: Buy | LTP: Rs 1,449.50 | Stop Loss: Rs 1,390 | Target: Rs 1,560 | Return: 7.60 percent
The stock was trading in a rectangle formation for the past two months and has formed a trend line resistance at Rs 1,430 levels. CDSL has broken out of a rectangle pattern at Rs 1,467 levels on November 4 and the prices have registered a decisive breakout that suggests a change in the trend from sideways to upside. In the last two trading sessions, the counter has given a throwback near its trend line support, which is placed near Rs 1,430 levels.
It is trading above its 21, 50 & 100-day exponential moving averages on the daily time frame, which is positive for the prices in the near term.
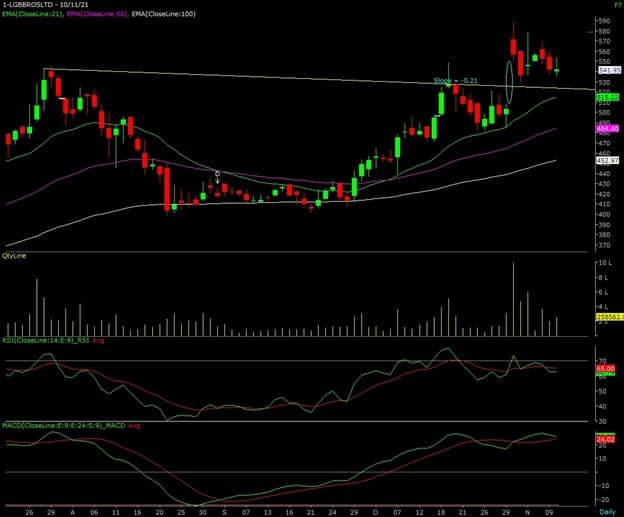
 LG Balakrishnan & Brothers: Buy | LTP: Rs 542 | Stop Loss: Rs 510 | Target: Rs 600 | Return: 10.7 percent
The prices were in a rounding bottom formation since August and have formed a bullish cup and handle pattern on the daily time frame. On November 1, the stock witnessed a gap-up opening and gave a breakout above the neck line of the cup & handle pattern and registered a decisive breakout from a bullish formation.
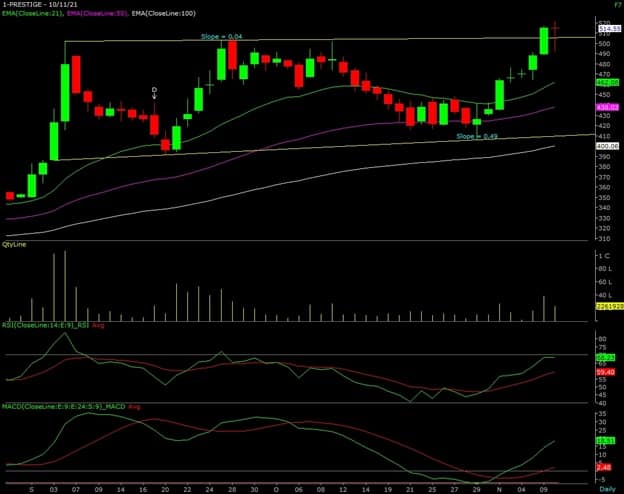
Prestige Estates Projects: Buy | LTP: Rs 514.55 | Stop Loss: Rs 488 | Target: Rs 562 | Return: 9.2 percent
Prestige was trading in a broad range of Rs 410 – 501 since last three months and formed a rectangle pattern on the daily time frame. On November 9, prices have witnessed a breakout of a rectangle pattern at Rs 514.85 levels.
When we observe volume activity there has been above-average volume set up in the past couple of weeks on the daily chart, which indicates accumulation phrase. Momentum oscillator RSI (14) is reading above 60 levels with positive crossover on the daily scale.
Disclaimer: The views and investment tips expressed by investment experts on Moneycontrol.com are their own and not that of the website or its management. Moneycontrol.com advises users to check with certified experts before taking any investment decisions.

Discover the latest Business News, Sensex, and Nifty updates. Obtain Personal Finance insights, tax queries, and expert opinions on Moneycontrol or download the Moneycontrol App to stay updated!
Find the best of Al News in one place, specially curated for you every weekend.
Stay on top of the latest tech trends and biggest startup news.