The Nifty is trading at a crucial juncture of 17,950, which is a cluster of the 100-DMA (daily moving average), the Budget day's high, and a down-sloping trendline. If the benchmark index manages to cross this level, then we can expect a short-covering rally in the market, where 18,080-18,200 will be the first resistance zone and 18,440 will be the next target level.
However, if the Nifty sees selling pressure from here, then there will be a risk of a move towards the 200-DMA, which is currently placed at 17,320, where 17,650 is an intermediate support level.
Bank Nifty is also in the critical resistance zone of 41,500–41,725; above this, we can expect a short-covering move towards 42,300 and 42,700 levels. However, if it encounters selling pressure from here, it may revisit 40,000 level.
The US inflation number is a critical factor, while institutional flows will be another important trigger for the direction of the market.
Here are three buy calls for next 2-3 weeks:
Poonawalla Fincorp: Buy | LTP: Rs 312.7 | Stop-Loss: Rs 290 | Target: Rs 354 | Return: 13 percent
The counter is witnessing a breakout of an Inverse Head & Shoulder pattern formation in the long-term timeframe. It is coming out of long-term consolidation on the daily chart. The breakout is led by heavy volume and has closed above the breakout level after 2 months.
On the upside, Rs 320 is an immediate hurdle. Above this, we can expect a move towards Rs 350+. On the downside, Rs 290 is a strong demand zone at any pullback.
While the moving average convergence and divergence (MACD) indicator is experiencing an upward centerline crossover, the relative strength index (RSI), a momentum indicator, is positively poised.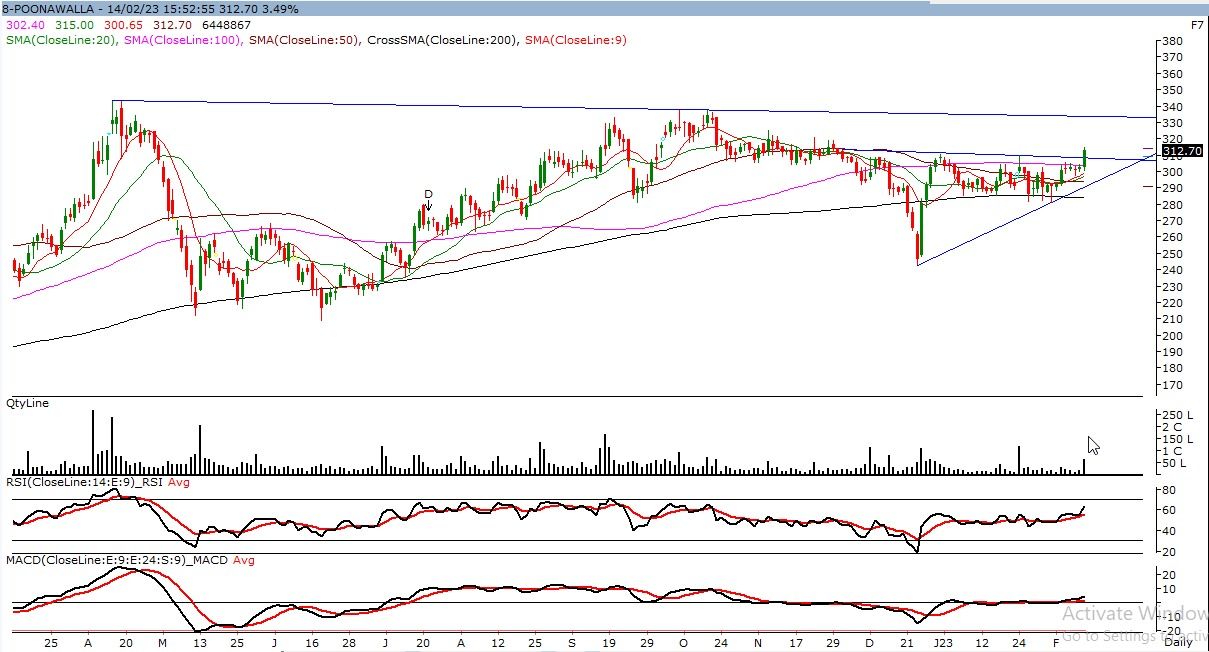
Finolex Cables: Buy | LTP: Rs 598 | Stop-Loss: Rs 550 | Target: Rs 694 | Return: 16 percent
The counter is in a classical bullish momentum and forming higher highs & higher lows formation on the longer timeframe. It has also witnessed a breakout of ascending triangle formation on the daily chart. The overall structure of the counter is very lucrative as it is trading above all important moving averages.
On the upside, the levels of Rs 640 operate as vulnerable levels; above these, we can anticipate a protracted move towards Rs 690+ in the shorter to longer term. On the downside, Rs 550 acts as crucial support during any pullback.
The momentum indicator MACD (moving average convergence divergence) is sustaining the current strength, and the RSI (relative strength index) is also poised favourably.

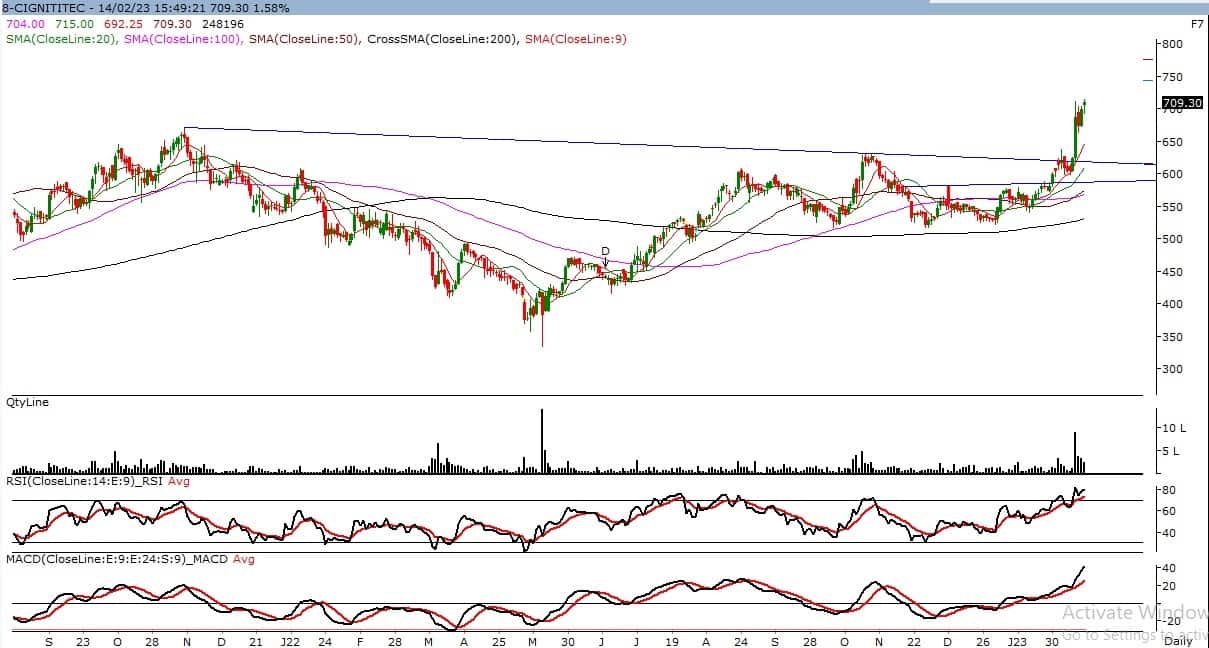
Cigniti Technologies: Buy | LTP: Rs 709 | Stop-Loss: Rs 650 | Target: Rs 824 | Return: 16 percent
Multiple bullish setups have occurred on the counter, including a breakout of an ascending triangle formation and a breakout of an Inverse Head and Shoulders formation. There is also a breakout of a bullish flag formation with strong volume.
Most of the momentum indicators are positively poised and support the breakout move at this counter. On the upside, if Rs 750, an immediate hurdle, gets surpassed, we can expect a move toward the Rs 810–820 zone. On the downside, Rs 650 will act as a strong demand zone.
Disclaimer: The views and investment tips expressed by investment experts on Moneycontrol.com are their own and not those of the website or its management. Moneycontrol.com advises users to check with certified experts before taking any investment decisions.

Discover the latest Business News, Sensex, and Nifty updates. Obtain Personal Finance insights, tax queries, and expert opinions on Moneycontrol or download the Moneycontrol App to stay updated!
Find the best of Al News in one place, specially curated for you every weekend.
Stay on top of the latest tech trends and biggest startup news.