


Election results often have little to do with the economy. Caste, money, muscle power, charisma all have an impact. If voters were entirely rational, they would give their votes to the person they think can improve their lives the most and economics has a lot to do with that. Of course, perhaps thankfully, we are not always Homo Economicus. Moreover, it’s very likely that the economic disruption resulting from the pandemic, the lockdowns and the return of migrant labour would overshadow any earlier good work done on the economic front. Nevertheless, for what it’s worth, now that the state elections are round the corner, here’s a look at how the Bihar economy under Nitish Kumar has performed over the last five years. All the numbers have been derived from data furnished in the Reserve Bank of India’s ‘Handbook of Statistics on Indian States 2019-20’.
Overall economyThe compound annual growth rate (CAGR) of Bihar’s gross state domestic product at constant prices between 2014-15 and 2019-20 is a high 8.23 percent, much above the all-India GDP CAGR of 6.71 percent for the same period. Yes, Bihar is one of India’s poorest states, but even so it has done well when we compare it to some of its peers. For instance, over the same period, Uttar Pradesh’s state gross domestic product grew at a CAGR of 7.3 percent, Jharkhand’s was 5.17 percent, Chhattisgarh 5.6 percent. Odisha however grew at a CAGR of 8.25 percent during that period.
With such a high growth rate, Bihar’s per capita income growth was also strong. The state’s per capita net domestic product at constant prices had a CAGR of 6.14 percent between 2014-15 and 2019-20, easily beating Jharkhand at 3.5 percent, Chhattisgarh at 3.31 percent and UP at 5.7 percent. Odisha however, with a CAGR of 7.8 percent, did better than Bihar on this yardstick.
Bihar’s overall economic performance in the last five years has therefore been commendable--see Chart 1.
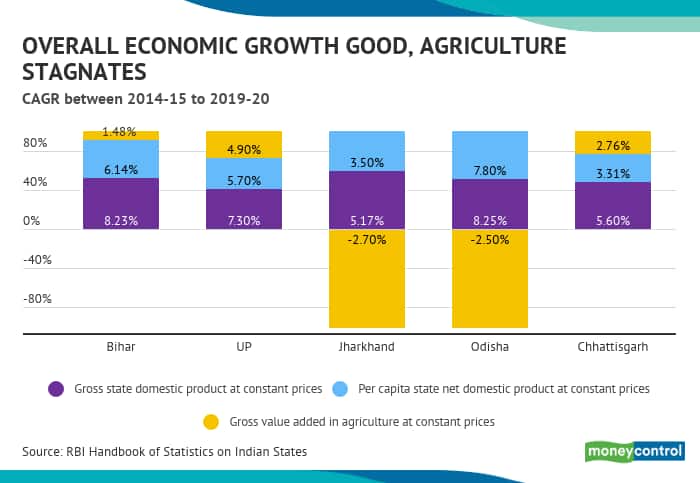
However, agricultural growth has been a weak point. Gross state value added in agriculture at constant prices had a CAGR of a mere 1.48 percent between 2014-15 and 2019-20. That’s way below UP’s 4.9 percent over the same period and lower than Chhattisgarh’s 2.76 percent. But both Odisha and Jharkhand had negative growth in value added in agriculture over the period. It’s doubtful though whether rural voters will be comforted by the fact that some other states have done even worse. Given that Bihar is predominantly a rural state, the poor showing in agriculture may hurt the incumbent government.
InflationOn the other hand, Bihar’s record in keeping inflation low has been stellar. In 2014-15, consumer price inflation in Bihar was 6.7 percent. Five years later, it was down to 2.2 percent. In neighbouring UP, inflation in 2019-20 was 5.9 percent and in Jharkhand it was 4.1 percent. In Odisha it was 4.6 percent and in Chhattisgarh a comparatively low 2.5 percent. Since inflation hurts the poor the most, the Bihar government’s success in curtailing inflation is a big positive.
Rural wagesThe CAGR for average daily wage rates for male construction workers in Bihar was 5.9 percent between 2014-15 and 2019-20, lower than UP’s and Odisha’s 6.7 percent. For general agricultural workers, the CAGR for Bihar was 5.28 percent, lower than UP’s 6.07 percent but slightly higher than Odisha’s 5.22 percent.
Perhaps because of the poor growth in agriculture, the Bihar government has ensured hefty spending on the social sector. Taking the 2014-15 state budget numbers and the 2018-19 revised estimates, the CAGR for growth in social expenditure was a huge 26.03 percent. For UP over the same period, it was 18.5 percent, for Jharkhand 21.63 percent, for Odisha 18 percent and Chhattisgarh 16.6 percent. This spending could offset the poor showing in agriculture.
UnemploymentWe come now to the Achilles heel of the government---the big rise in unemployment. In 2011-12, the urban unemployment rate was 56 per 1000, in 2018-19 it had gone up to 105 per thousand. In 2018-19, the urban unemployment rate was 106 per thousand in UP, 127 per thousand in Odisha, 87 per thousand in Jharkhand and 55 per thousand in Chhattisgarh--see Chart 2.
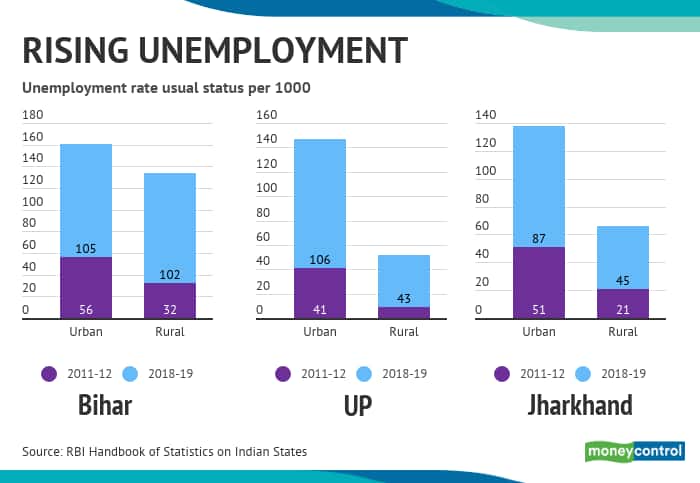
A similar story has played out for rural unemployment. In 2011-12, overall rural unemployment was 32 per 1000—in 2018-19 it had shot up to 102 per thousand. Bihar’s rural unemployment rate was much higher in 2018-19 than in the neighbouring states of UP and Jharkhand and in Odisha and Chhattisgarh.
ConclusionThe numbers suggest that the high overall state GDP growth rates haven’t really percolated down to the masses. And of course, the pandemic and the return of migrant labour have made things much worse. The Bihar elections will tell us whether the incumbent government will be blamed for the economic disruption resulting from the pandemic and the lockdown.
(Write in with your views on Nitish Kumar’s economic track record to Manas.Chakravarty@nw18.com)

Discover the latest Business News, Sensex, and Nifty updates. Obtain Personal Finance insights, tax queries, and expert opinions on Moneycontrol or download the Moneycontrol App to stay updated!
Find the best of Al News in one place, specially curated for you every weekend.
Stay on top of the latest tech trends and biggest startup news.


