Bulls staged a decent comeback on July 15, sending the Nifty50 back above 16,000 mark after a in the previous four straight sessions, as global cues stayed positive. The buying was seen in auto, financial services, FMCG, and HDFC group stocks.
The BSE Sensex climbed 345 points to 53,761, while the Nifty50 rose more than 100 points to 16,049 and formed a Hammer pattern on the daily charts, which is generally called as a trend reveral pattern.
The broader space also followed the suit, with the Nifty Midcap 100 index rising 0.77 percent and Smallcap 100 index climbing 0.34 percent but the breadth was not very strong. About 1,031 shares advanced, against 892 declining shares on the NSE.
Stocks that were in action included Aster DM Healthcare which jumped 7.3 percent to close at Rs 213.45 for the first time since September 24, 2021 and formed large bullish candle on the daily charts with healthy volumes, continuing uptrend for sixth consecutive session.
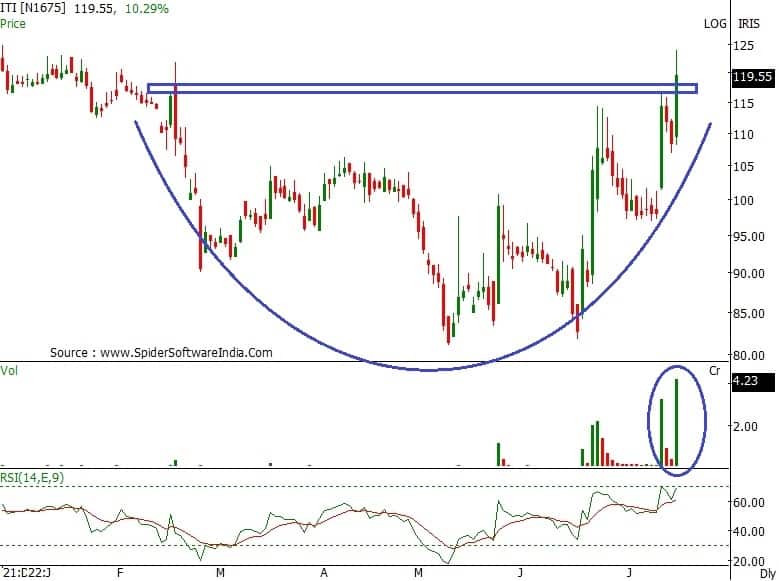
EPL gained 7.7 percent to end at Rs 182.40 with formation of robust bullish candlestick pattern on the daily scale with above average volumes on Friday after High Wave kind of pattern formation in previous day, while ITI shares surged 11.25 percent to Rs 120.6, the highest closing level since December 28, 2021 and formed strong bullish candle on the daily charts with significantly high volumes.
Here's what Rajesh Palviya of Axis Securities recommends investors should do with these stocks when the market resumes trading today:
On the weekly timeframe, the stock has decisively broken out one year "down-sloping trendline" breakout indicating continuation of prior up trend. This breakout is accompanied with huge volumes indicating increased participation on a breakout.
In addition, the stock has also observed "band bollinger" buy signals on a weekly time frame which signals increased momentum. The daily, weekly and monthly strength indicator RSI (relative strength index) is in bullish mode indicating rising and sustained strength across all the time frames.
The stock is well placed above its 20, 50, 100 and 200 days SMA which supports and reconfirm bullish sentiments.
Investors should buy, hold and accumulate this stock with an expected upside of Rs 235-255, with downside support zone of Rs 203-190 levels.

On the daily time frame, the stock has decisively broken out its seven months "Triangular" pattern at Rs 175 levels. This breakout is accompanied with huge volume which confirms the above mentioned pattern. This pattern also confirmed trend reversal to the upward. This breakout is accompanied with huge volumes indicating increased participation on a breakout.
The daily, weekly and monthly strength indicator RSI is in bullish mode indicating rising and sustained strength across all the time frames.
The stock is well placed above its 20, 50 and 100 days SMA which supports and reconfirm bullish sentiments.
Investors should buy, hold and accumulate this stock with an expected upside of Rs 200-215, with downside support zone of Rs 170-160 levels.

On the daily chart, the stock has confirmed "Rounding Bottom" formation breakout at Rs 115 levels along with huge volumes. The stock has recaptured the 200-day SMA and rebounded sharply.
The daily, weekly and monthly strength indicator RSI is in bullish mode indicating rising and sustained strength across all the time frames.
In addition, the stock is also poised for a two years "down-sloping" trendline breakout at Rs 120 levels. The weekly "band-bollinger" buy signal indicates rising momentum.
Investors should buy, hold and accumulate this stock with an expected upside of Rs 135-150, with downside support zone of Rs 106-102 levels.
Disclaimer: The views and investment tips expressed by investment experts on Moneycontrol.com are their own and not those of the website or its management. Moneycontrol.com advises users to check with certified experts before taking any investment decisions.
Discover the latest Business News, Sensex, and Nifty updates. Obtain Personal Finance insights, tax queries, and expert opinions on Moneycontrol or download the Moneycontrol App to stay updated!
Find the best of Al News in one place, specially curated for you every weekend.
Stay on top of the latest tech trends and biggest startup news.