


Bulls held the fort for three days, driving the Nifty 50 beyond 22,900 with a gain of 73 points on March 20. The market breadth remained strong, with approximately 2,196 shares advancing compared to 444 declining shares on the NSE. The bullish bias is expected to sustain in the upcoming sessions. Below are some trading ideas for the near term:
Jatin Gedia, Technical Research Analyst at Mirae Asset Sharekhan
Coforge | CMP: Rs 7,550.45
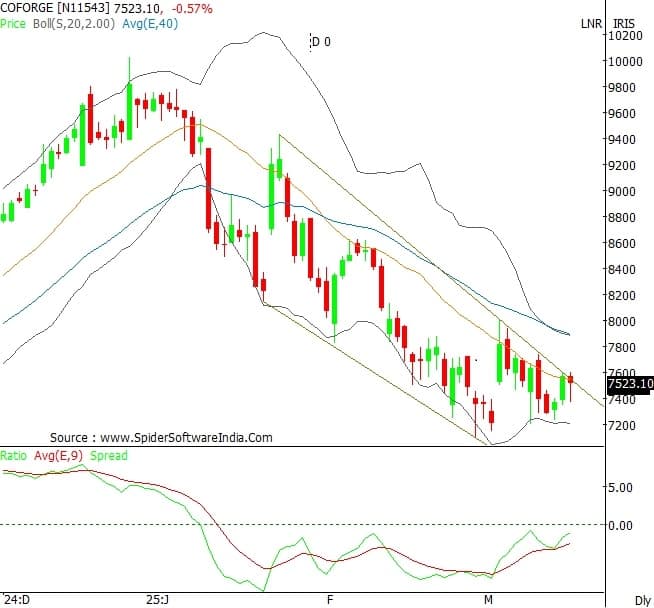
Coforge has been falling in a channelized manner. The momentum indicator is showing signs of exhaustion in selling pressure and is likely to witness a turnaround soon. The current weakness should be considered an accumulation opportunity. On the upside, we expect the stock to break out of this channel and test the previous swing high of Rs 8,006.
Strategy: Buy
Target: Rs 7,890, Rs 8,006
Stop-Loss: Rs 7,380
APL Apollo Tubes | CMP: Rs 1,492.8

APL Apollo Tubes has found support at the 61.82% Fibonacci retracement level of the previous rise and has started the next leg of its upward movement. The daily momentum indicator has shown a positive crossover, which is a buy signal. The stock has managed to close above the key short-term averages, indicating a price crossover and suggesting a bullish bias. We expect the stock to witness a sharp run-up and anticipate a target of Rs 1,629 from a short-term perspective.
Strategy: Buy
Target: Rs 1,629
Stop-Loss: Rs 1,440
Indraprastha Gas | CMP: Rs 193.3
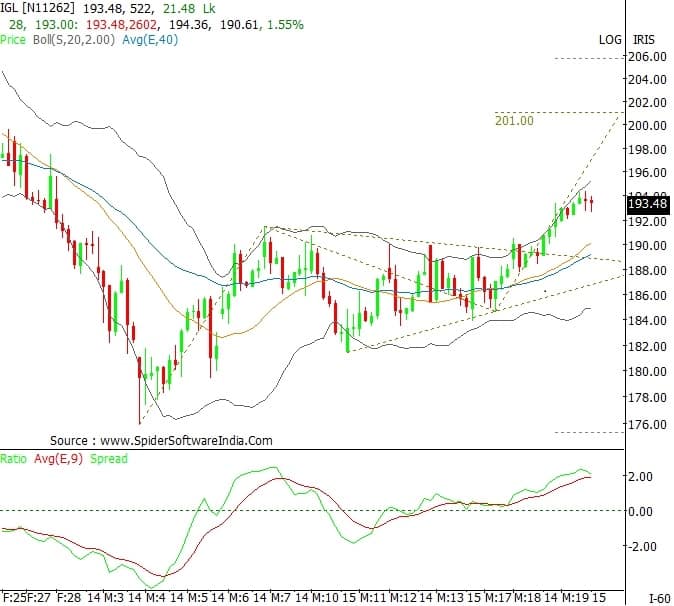
Indraprastha Gas has broken out of a Triangle pattern on the upside. The momentum indicator has shown a positive crossover, which is a buy signal. We expect the stock to target levels of Rs 201 (pattern target) and Rs 205 (daily upper Bollinger band). We foresee the continuation of positive momentum, with both the daily and hourly momentum indicators showing a positive crossover.
Strategy: Buy
Target: Rs 201, Rs 205
Stop-Loss: Rs 189
Vidnyan S Sawant, Head of Research at GEPL Capital
Indian Hotels | CMP: Rs 810.6
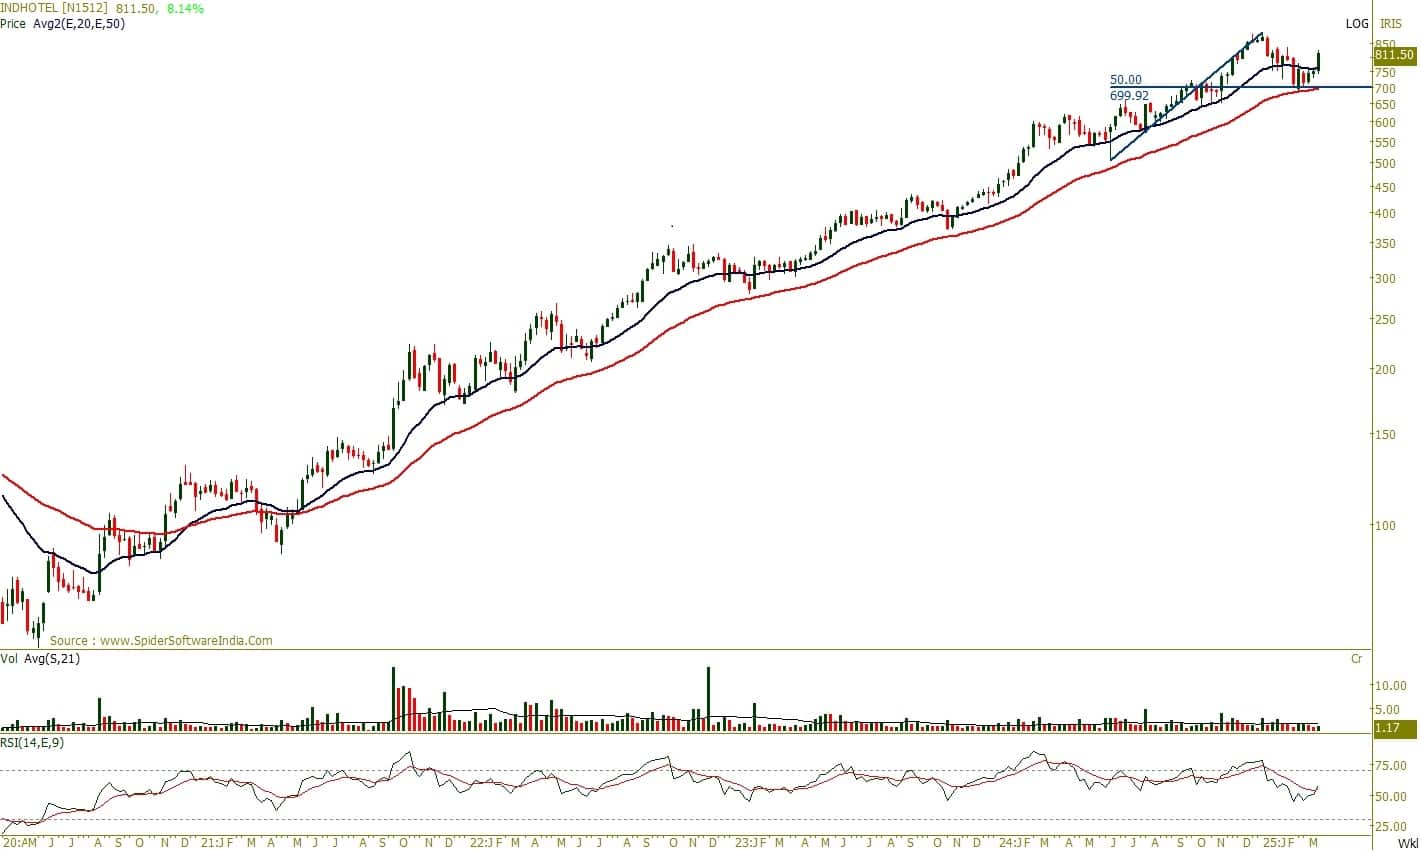
Indian Hotels has exhibited a strong bullish trend since 2020, consistently respecting the key 12- and 26-month EMAs, reinforcing its strength on a higher timeframe. On the weekly scale, the stock has attracted buying interest from its 50% Fibonacci retracement level. Additionally, a breakout from a three-week inside bar pattern this week further strengthens the positive outlook. The RSI (Relative Strength Index) momentum indicator, currently at 58, has witnessed a bullish crossover, indicating improving momentum.
Strategy: Buy
Target: Rs 932
Stop-Loss: Rs 762
Camlin Fine Sciences | CMP: Rs 178.3
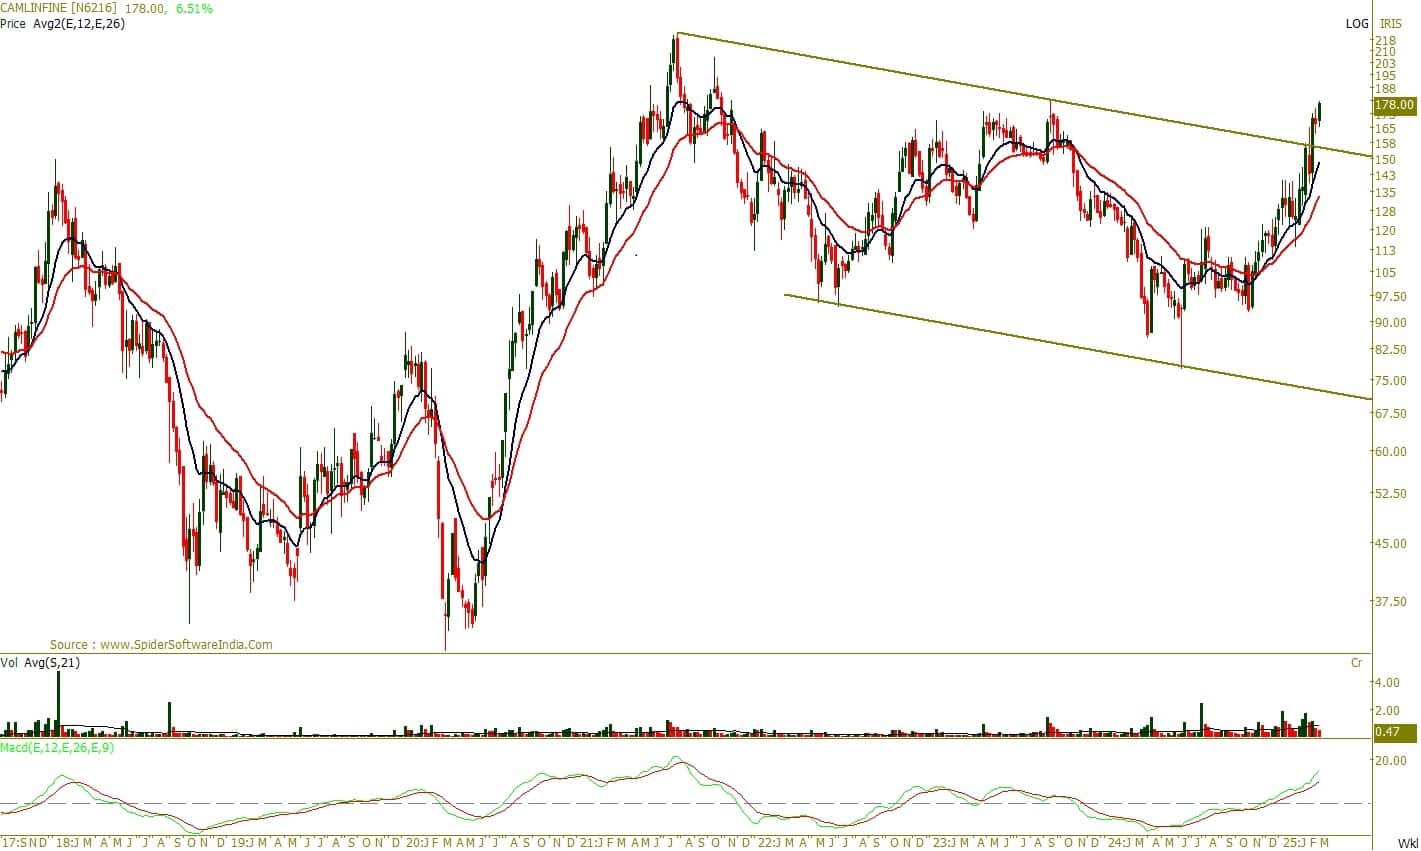
On the monthly scale, Camlin Fine Sciences has broken out of a falling channel, signaling a trend reversal. On the weekly scale, the stock continues its upward movement while respecting the key 12- and 26-week EMAs, reinforcing its positive trend strength. Additionally, the MACD (Moving Average Convergence Divergence) indicator is in an uptrend, confirming bullish momentum.
Strategy: Buy
Target: Rs 200
Stop-Loss: Rs 169
BSE | CMP: Rs 4,392.5

On the weekly scale, BSE has shown buying interest from the 61.8% Fibonacci retracement level of the prior uptrend (Rs 2,115–Rs 6,133), indicating positive price development. On the daily scale, the index has successfully reclaimed the 200-day EMA, reflecting improving sentiment. Additionally, the Stochastic indicator has formed a bullish crossover, signaling momentum improvement.
Strategy: Buy
Target: Rs 5,140
Stop-Loss: Rs 4,125
One 97 Communications | CMP: Rs 763.1
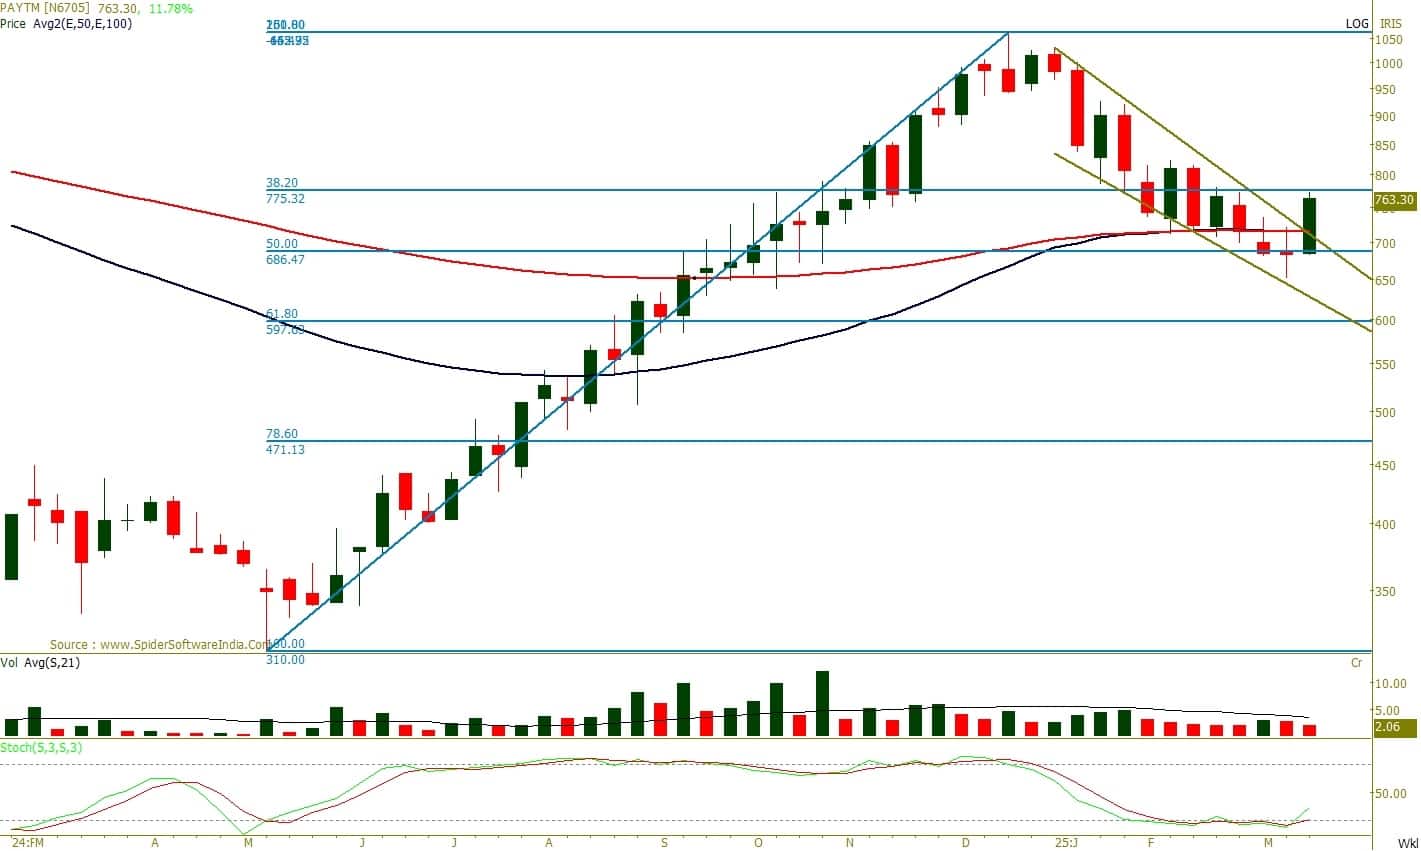
Paytm has witnessed a bullish breakout from a falling channel, with the prior week's Doji candlestick, followed by a strong bullish candle, indicating robust price development. The stock has attracted buying interest from its 50% Fibonacci retracement level of the prior upmove (Rs 310–Rs 1,062). Additionally, the Stochastic indicator has formed a bullish crossover, with %K reclaiming the 35 mark, reinforcing that the positive price action is supported by bullish momentum.
Strategy: Buy
Target: Rs 855
Stop-Loss: Rs 724
Sudeep Shah, Deputy Vice President and Head of Technical and Derivative Research at SBI Securities
Bharat Dynamics | CMP: Rs 1,198
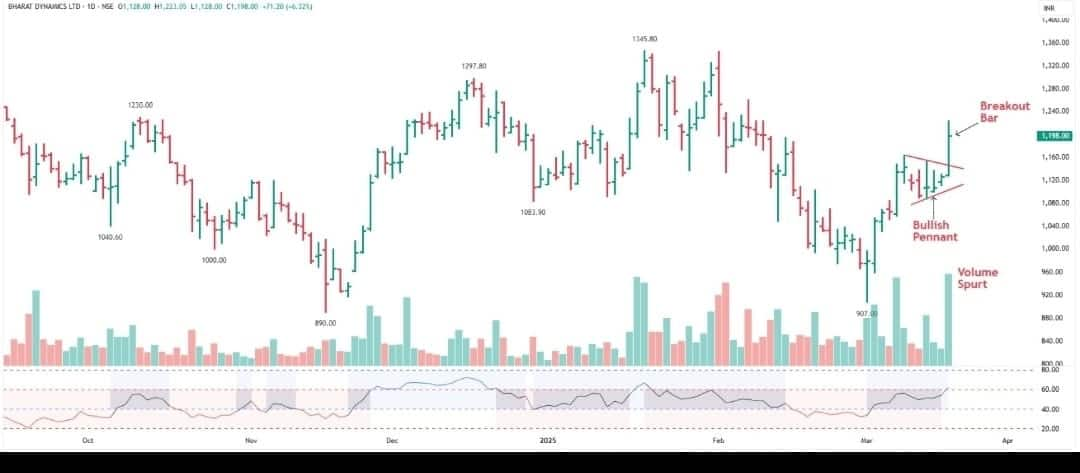
On Wednesday, the Nifty India Defence index strongly outperformed the frontline indices, surging nearly 5 percent. All the constituents of this index ended on a positive note. Bharat Dynamics has given a Bullish Pennant pattern breakout on a daily scale. This breakout was supported by a robust volume of more than double the 50-day average volume, indicating strong buying interest from market participants. Currently, the stock is trading above its short and long-term moving averages. Further, the daily RSI is in bullish territory and is rising, reinforcing the positive momentum. Hence, we recommend accumulating in the zone of Rs 1,200–1,190 levels.
Strategy: Buy
Target: Rs 1,320
Stop-Loss: Rs 1,135
IRFC | CMP: Rs 128.11
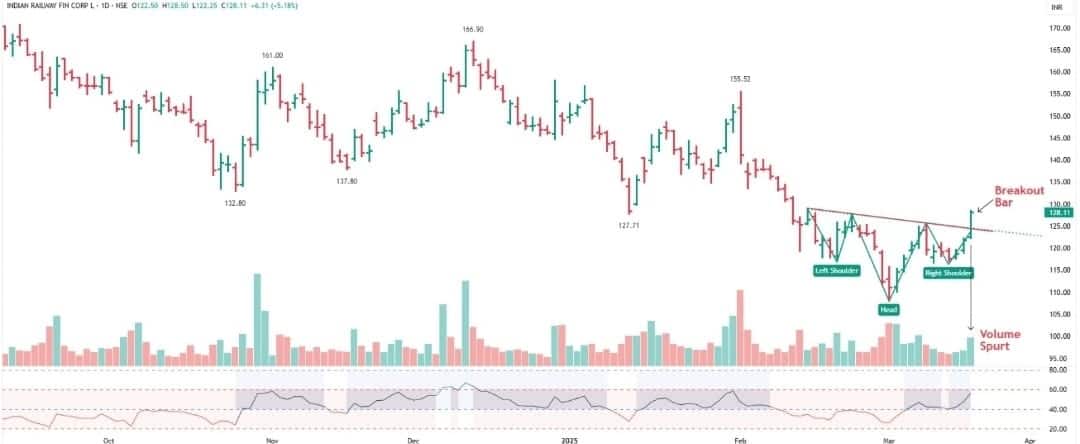
Indian Railway Finance Corporation has witnessed a breakout from an Inverted Head and Shoulders pattern on the daily chart, backed by volume surpassing the 50-day average. The breakout is reinforced by the formation of a strong bullish candle on the breakout day, adding to its credibility. Additionally, the stock has moved above its 20-day EMA, while the daily RSI, trading above its 9-day average and trending upward, signals strengthening bullish momentum. Hence, we recommend accumulating in the zone of Rs 129–128 levels.
Strategy: Buy
Target: Rs 142
Stop-Loss: Rs 121
CG Power and Industrial Solutions | CMP: Rs 663.3

CG Power and Industrial Solutions has given a horizontal trendline breakout on a daily scale. This breakout is confirmed by relatively higher volume. Currently, the stock is trading above its short and long-term moving averages. The 20-day and 50-day EMAs have started edging higher. Furthermore, the falling slope of the 100-day and 200-day EMAs has slowed down significantly, which is a bullish sign. Additionally, the daily RSI has surged above the 60 mark for the first time since December 2024, reinforcing the strengthening momentum. Hence, we recommend accumulating in the zone of Rs 665–660 levels.
Strategy: Buy
Target: Rs 720
Stop-Loss: Rs 635
Disclaimer: The views and investment tips expressed by investment experts on Moneycontrol.com are their own and not those of the website or its management. Moneycontrol.com advises users to check with certified experts before taking any investment decisions.Discover the latest Business News, Sensex, and Nifty updates. Obtain Personal Finance insights, tax queries, and expert opinions on Moneycontrol or download the Moneycontrol App to stay updated!
Find the best of Al News in one place, specially curated for you every weekend.
Stay on top of the latest tech trends and biggest startup news.


