


The Nifty 50 gained for the third consecutive session on September 18, closing above 25,400 with a 93-point gain, following the Fed funds rate cut. The momentum remains firmly in favour of the bulls but some consolidation can't be ruled out before the next leg of the upmove begins. The 25,500 level is now the next key hurdle, where a long falling resistance trendline is placed. Sustaining above this level could open the door for a retest of the June high at 25,669. However, failure to break and sustain above it may result in some consolidation, with 25,330–25,250 acting as a support zone, according to experts.

Here are 15 data points we have collated to help you spot profitable trades:
1) Key Levels For The Nifty 50 (25,424)
Resistance based on pivot points: 25,446, 25,474, and 25,520
Support based on pivot points: 25,355, 25,327, and 25,282
Special Formation: The Nifty 50 formed a small bearish candle with a long lower shadow on the daily charts, indicating strong buying interest at lower levels. This pattern resembles a Bearish Hanging Man, a bearish reversal formation in an uptrend, but confirmation is needed in the following session. The Relative Strength Index (RSI) jumped to 68.37, while the MACD maintained its bullish crossover, with further strength visible in the histogram. All these indicate ongoing bullish momentum, despite the caution suggested by the candlestick pattern.
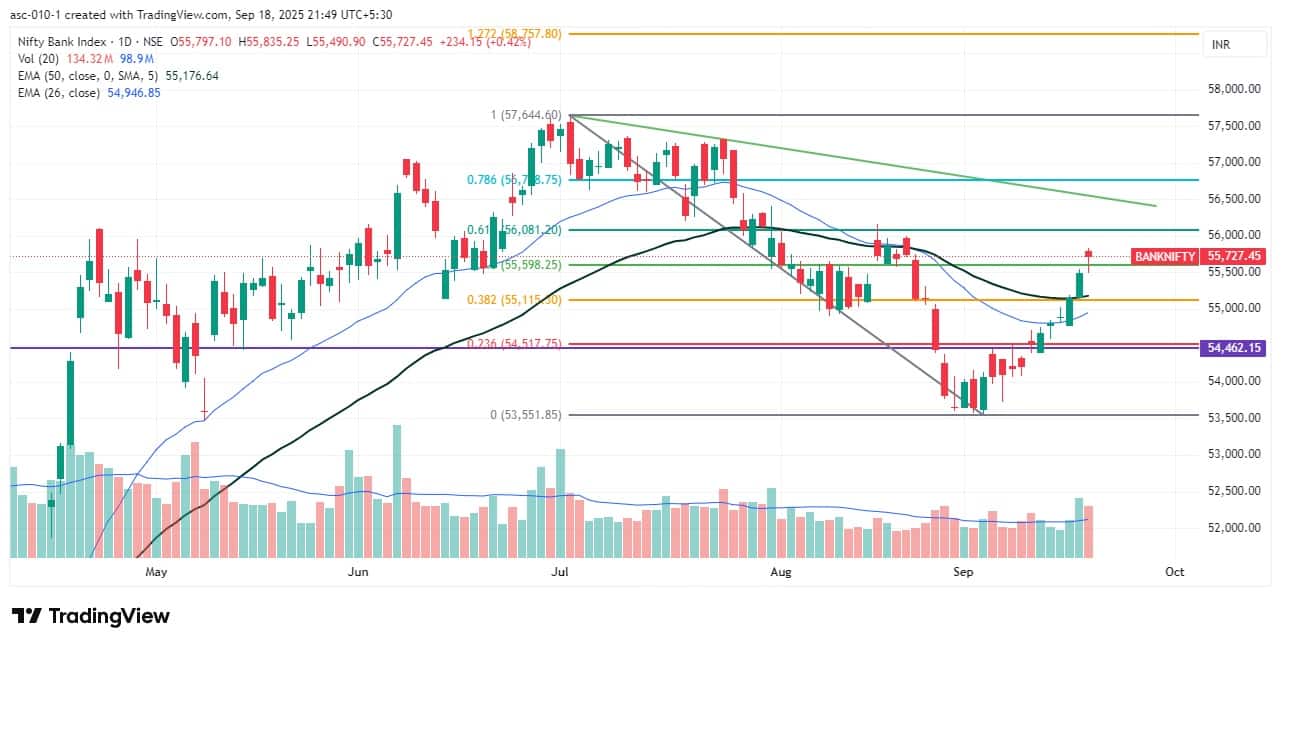
2) Key Levels For The Bank Nifty (55,727)
Resistance based on pivot points: 55,816, 55,897, and 56,029
Support based on pivot points: 55,553, 55,472, and 55,340
Resistance based on Fibonacci retracement: 56,081, 56,769
Support based on Fibonacci retracement: 54,411, 53,413
Special Formation: The Bank Nifty also displayed a Nifty-like candlestick pattern on the daily timeframe and gained 234 points, extending its upward journey for the 12th consecutive session. The index traded comfortably above all key moving averages and moved closer to the upper line of the Bollinger Bands. Momentum indicators remained strong: the RSI rose to 62.67, indicating increasing bullish strength and the MACD is on the verge of climbing above the zero line, with further strength visible in the histogram. All these signals point to a continued bullish undertone in the Bank Nifty.
According to the weekly options data, the maximum Call open interest was seen at the 26,000 strike (with 1.14 crore contracts). This level can act as a key resistance for the Nifty in the short term. It was followed by the 25,500 strike (1.11 crore contracts), and the 25,800 strike (86.08 lakh contracts).
Maximum Call writing was observed at the 25,800 strike, which saw an addition of 48.06 lakh contracts, followed by the 25,500 and 25,450 strikes, which added 38.88 lakh and 33.23 lakh contracts, respectively. The maximum Call unwinding was seen at the 25,300 strike, which shed 17.5 lakh contracts, followed by the 25,350 and 25,200 strikes, which shed 11.34 lakh and 5.67 lakh contracts, respectively.

On the Put side, the 25,000 strike holds the maximum Put open interest (with 1.04 crore contracts), which can act as a key support level for the Nifty. It was followed by the 25,400 strike (90.16 lakh contracts) and the 25,300 strike (90.02 lakh contracts).
The maximum Put writing was placed at the 25,400 strike, which saw an addition of 58.72 lakh contracts, followed by the 25,000 and 25,450 strikes, which added 42.6 lakh and 34.8 lakh contracts, respectively. The maximum Put unwinding was seen at the 25,250 strike, which shed 7.65 lakh contracts.

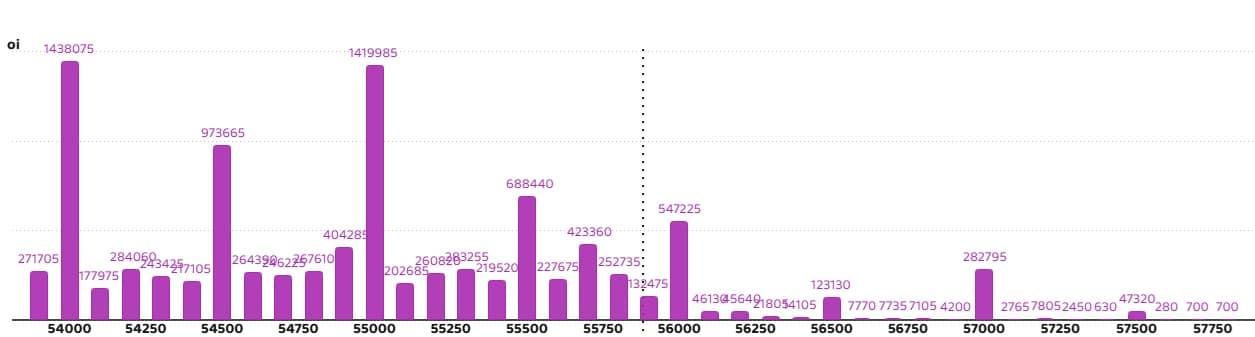
5) Bank Nifty Call Options Data
According to the monthly options data, the 56,000 strike holds the maximum Call open interest, with 12.98 lakh contracts. This can act as a key resistance level for the index in the short term. It was followed by the 57,000 strike (11.15 lakh contracts) and the 56,500 strike (8.62 lakh contracts).
Maximum Call writing was observed at the 55,800 strike (with the addition of 3.29 lakh contracts), followed by the 55,700 strike (2.06 lakh contracts), and the 55,900 strike (1.23 lakh contracts). The maximum Call unwinding was seen at the 55,000 strike, which shed 1.48 lakh contracts, followed by 55,500 and 55,400 strikes, which shed 1.22 lakh and 1.15 lakh contracts, respectively.

6) Bank Nifty Put Options Data
On the Put side, the maximum Put open interest was seen at the 54,000 strike (with 14.38 lakh contracts), which can act as a key support level for the index. This was followed by the 55,000 strike (14.19 lakh contracts) and the 54,500 strike (9.73 lakh contracts).
The maximum Put writing was observed at the 55,700 strike (which added 3.02 lakh contracts), followed by the 55,800 strike (1.76 lakh contracts) and the 54,900 strike (1.11 lakh contracts). The maximum Put winding was seen at the 55,300 strike, which shed 50,575 contracts, followed by the 54,000 and 54,800 strikes, which shed 40,845 and 35,210 contracts, respectively.
The Nifty Put-Call ratio (PCR), which indicates the mood of the market, dropped to 1.16 on September 18, compared to 1.21 in the previous session.
The increasing PCR, or being higher than 0.7 or surpassing 1, means traders are selling more Put options than Call options, which generally indicates the firming up of a bullish sentiment in the market. If the ratio falls below 0.7 or moves towards 0.5, then it indicates selling in Calls is higher than selling in Puts, reflecting a bearish mood in the market.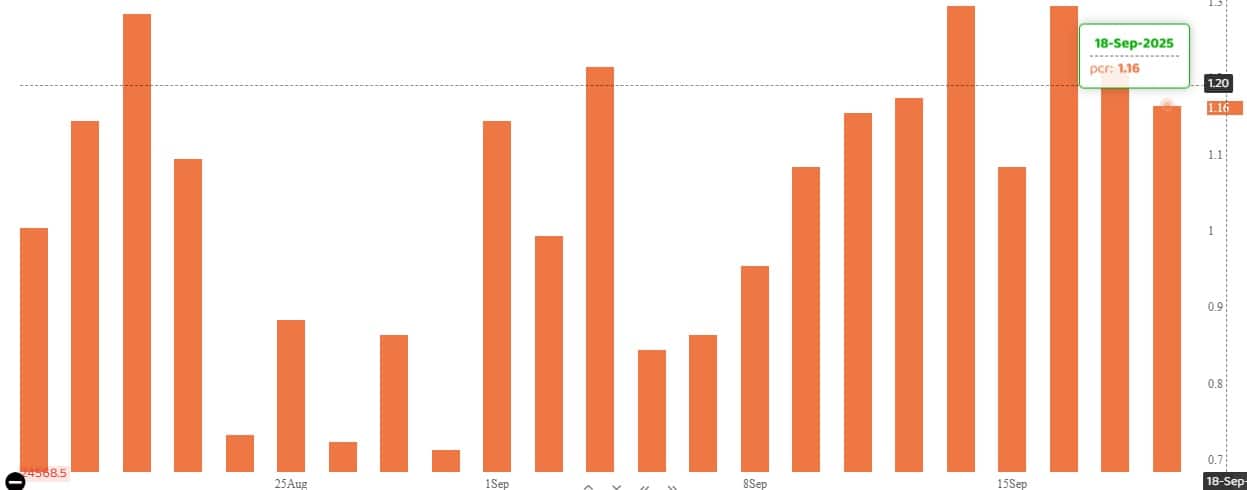
9) India VIX
The India VIX, which measures expected market volatility, dropped below the 10 mark and ended at an all-time closing low on Thursday, providing strong comfort for bulls and suggesting low volatility in the short term. The index fell by 3.54 percent to 9.89.

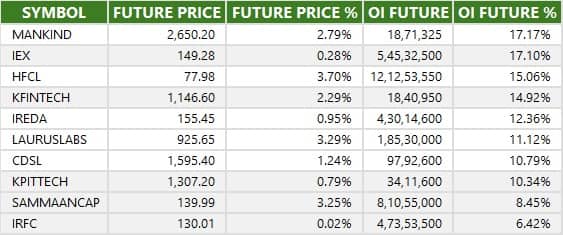
A long build-up was seen in 83 stocks. An increase in open interest (OI) and price indicates a build-up of long positions.
11) Long Unwinding (17 Stocks)
17 stocks saw a decline in open interest (OI) along with a fall in price, indicating long unwinding.
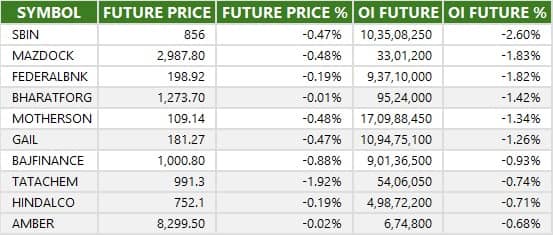
12) Short Build-up (52 Stocks)
52 stocks saw an increase in OI along with a fall in price, indicating a build-up of short positions.

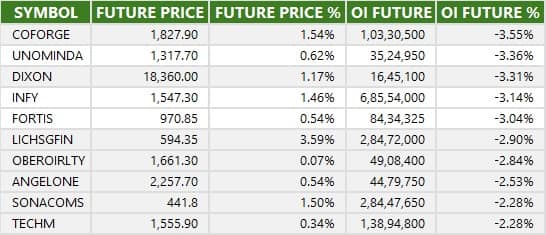
13) Short-Covering (59 Stocks)
59 stocks saw short-covering, meaning a decrease in OI, along with a price increase.
Here are the stocks that saw a high share of delivery trades. A high share of delivery reflects investing (as opposed to trading) interest in a stock.

Securities banned under the F&O segment include companies where derivative contracts cross 95 percent of the market-wide position limit.
Stocks added to F&O ban: HFCL
Stocks retained in F&O ban: Angel One, , RBL Bank
Stocks removed from F&O ban: Oracle Financial Services Software
Disclaimer: The views and investment tips expressed by experts on Moneycontrol are their own and not those of the website or its management. Moneycontrol advises users to check with certified experts before taking any investment decisions.
Disclosure: Moneycontrol is a part of the Network18 group. Network18 is controlled by Independent Media Trust, of which Reliance Industries is the sole beneficiary.
Discover the latest Business News, Sensex, and Nifty updates. Obtain Personal Finance insights, tax queries, and expert opinions on Moneycontrol or download the Moneycontrol App to stay updated!
Find the best of Al News in one place, specially curated for you every weekend.
Stay on top of the latest tech trends and biggest startup news.


