


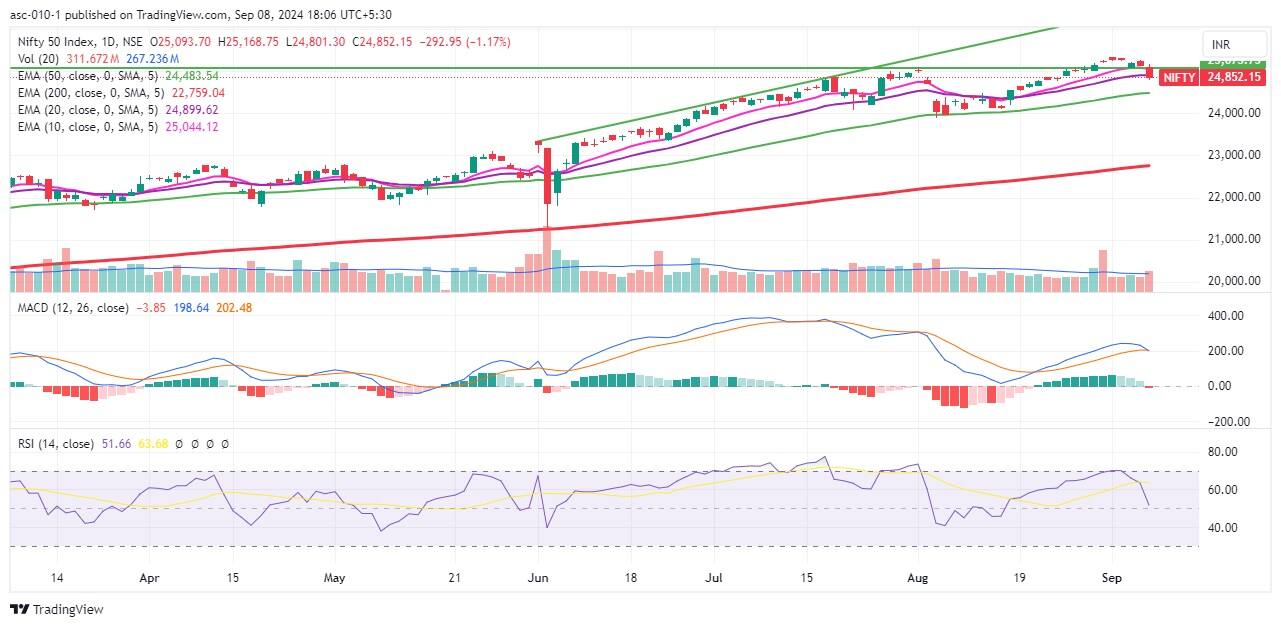
The market fell sharply with above-average volumes on September 6, with the Nifty 50 decisively breaking the crucial 25,000 support level and recording the biggest single-day fall since August 5. The Nifty 50 dropped 293 points, or 1.17 percent, to 24,852. This may confirm a shift in the short-term trend from upward to downward. Therefore, 24,500 (which coincides with the 50-day EMA) may act as the next support for the index, while the hurdle lies at 25,050 on the higher side, experts said. Below are 15 data points we have collated to help you spot profitable trades:
Here are 15 data points we have collated to help you spot profitable trades:
1) Key Levels For The Nifty 50
Resistance based on pivot points: 25,081, 25,168, and 25,308
Support based on pivot points: 24,800, 24,714, and 24,573
Special Formation: The Nifty 50 formed a long bearish candlestick pattern on the daily charts and closed below the 10- and 20-day EMAs (Exponential Moving Averages). The momentum indicators RSI (Relative Strength Index) and MACD (Moving Average Convergence Divergence) are showing a negative crossover, which is a negative sign for the short term.
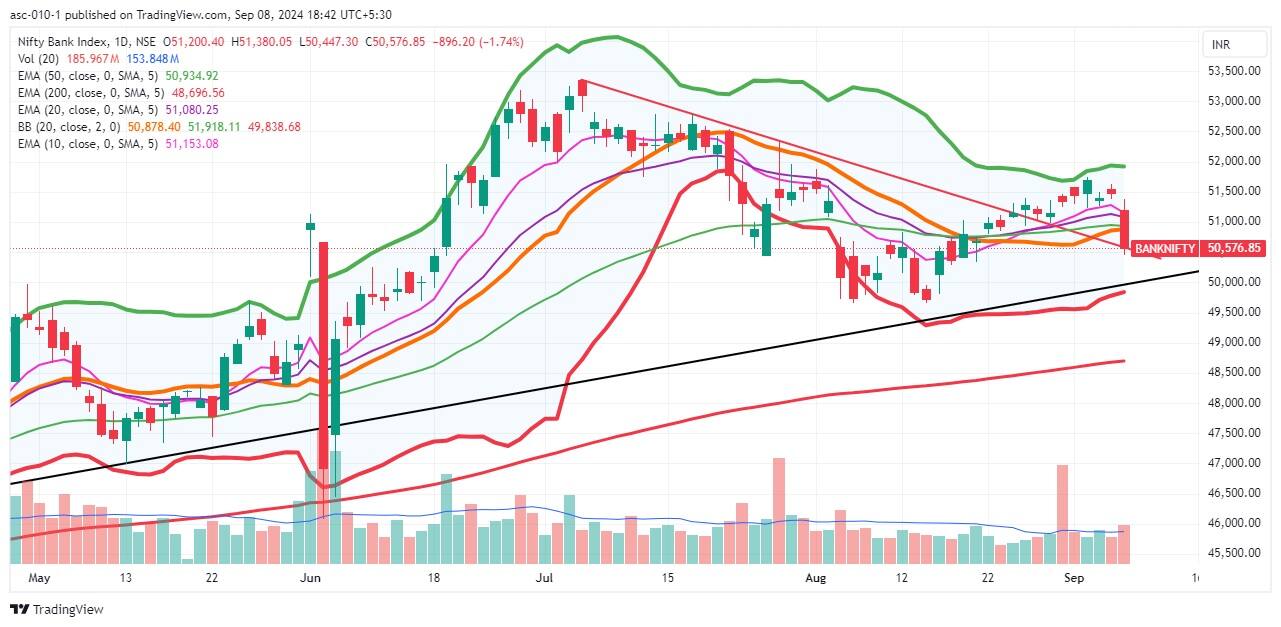
2) Key Levels For The Bank Nifty
Resistance based on pivot points: 51,158, 51,378, and 51,734
Support based on pivot points: 50,445, 50,225, and 49,869
Resistance based on Fibonacci retracement: 51,071, 51,515
Support based on Fibonacci retracement: 50,087, 49,628
Special Formation: The Bank Nifty also recorded a long bearish candle on the daily charts, falling not only below the mid of the Bollinger Band but also below the 10, 20, and 50-day EMAs with above-average volumes. The momentum indicator RSI also showed a negative crossover. The index tanked 896 points, or 1.74 percent, to 50,577.
According to the weekly options data, the maximum open interest was seen at the 26,000 strike (with 87.29 lakh contracts). This level can act as a key resistance level for the Nifty in the short term. It was followed by the 25,200 strike (69.71 lakh contracts) and the 25,000 strike (66.28 lakh contracts).
Maximum Call writing was seen at the 25,000 strike, which saw an addition of 52.12 lakh contracts, followed by the 25,100 and 25,200 strikes, which added 50.01 lakh and 33.04 lakh contracts, respectively. There was hardly any unwinding seen.

On the Put side, the 24,000 strike holds the maximum open interest (with 47.47 lakh contracts), which can act as a key support level for the Nifty. It was followed by the 24,500 strike (41.79 lakh contracts) and the 25,000 strike (28.77 lakh contracts).
The maximum Put writing was observed at the 24,900 strike, which saw an addition of 10.88 lakh contracts, followed by the 24,000 and 24,800 strikes, with 8.24 lakh and 7.04 lakh contracts added, respectively, while the Put unwinding was seen at the 25,000 strike, which shed 10.9 lakh contracts, followed by the 25,200 and 25,100 strikes, which shed 10.25 lakh and 5.51 lakh contracts, respectively.

5) Bank Nifty Call Options Data
According to the weekly options data, the maximum open interest was seen at the 51,500 strike, with 43.26 lakh contracts. This can act as a key resistance level for the index in the short term. It was followed by the 51,000 strike (30.64 lakh contracts) and the 51,400 strike (24.12 lakh contracts).
Maximum Call writing was visible at the 51,000 strike (with the addition of 26.55 lakh contracts), followed by the 51,200 strike (17.64 lakh contracts) and the 51,300 strike (16.8 lakh contracts), while there was hardly any unwinding seen.

6) Bank Nifty Put Options Data
On the Put side, the 50,000 strike holds the maximum open interest (with 15.14 lakh contracts), which can act as a key support level for the index. This was followed by the 51,000 strike (14.14 lakh contracts) and the 50,500 strike (13.82 lakh contracts).
The maximum Put writing was observed at the 50,500 strike (which added 3.8 lakh contracts), followed by the 49,700 strike (2.14 lakh contracts) and the 49,500 strike (1.95 lakh contracts), while the Put unwinding was seen at the 51,500 strike, which shed 7.96 lakh contracts, followed by the 51,400 and 50,700 strikes, which shed 3.43 lakh and 1.91 lakh contracts, respectively.


The Nifty Put-Call ratio (PCR), which indicates the mood of the market, plunged to 0.92 on September 6, from 1.33 levels in the previous session.
The increasing PCR, or being higher than 0.7 or surpassing 1, means traders are selling more Put options than Call options, which generally indicates the firming up of a bullish sentiment in the market. If the ratio falls below 0.7 or moves towards 0.5, then it indicates selling in Calls is higher than selling in Puts, reflecting a bearish mood in the market.

9) India VIX
Volatility jumped sharply on Friday, climbing above the 15 mark and making the bulls uncomfortable. If it sustains above the 15 level, then bulls need to be cautious. The India VIX, the fear index, rose by 7.11 percent to 15.22, up from 14.2 levels.

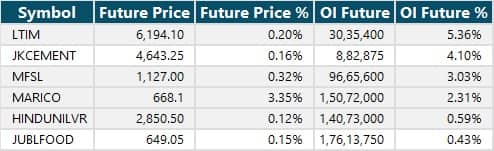
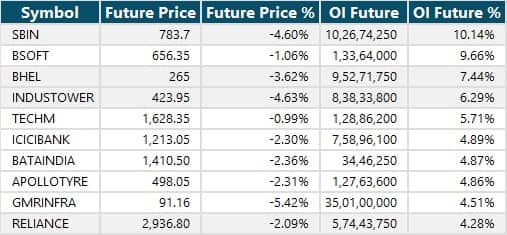
A long build-up was seen in 6 stocks. An increase in open interest (OI) and price indicates a build-up of long positions.
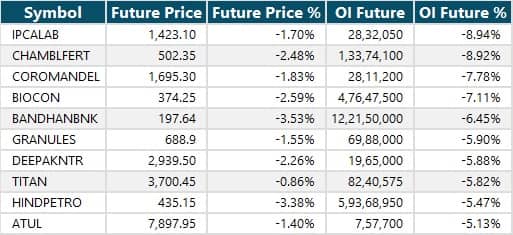
11) Long Unwinding (92 Stocks)
92 stocks saw a decline in open interest (OI) along with a fall in price, indicating long unwinding.
12) Short Build-up (70 Stocks)
70 stocks saw an increase in OI along with a fall in price, indicating a build-up of short positions.
13) Short-Covering (16 Stocks)
16 stocks saw short-covering, meaning a decrease in OI, along with a price increase.

Here are the stocks that saw a high share of delivery trades. A high share of delivery reflects investing (as opposed to trading) interest in a stock.

Securities banned under the F&O segment include companies where derivative contracts cross 95 percent of the market-wide position limit.
Stocks added to F&O ban: Nil
Stocks retained in F&O ban: Aditya Birla Fashion and Retail, Balrampur Chini Mills, Bandhan Bank, Biocon, Chambal Fertilisers and Chemicals, Hindustan Copper, RBL Bank
Stocks removed from F&O ban: Nil
Disclaimer: The views and investment tips expressed by experts on Moneycontrol are their own and not those of the website or its management. Moneycontrol advises users to check with certified experts before taking any investment decisions.
Disclosure: Moneycontrol is a part of the Network18 group. Network18 is controlled by Independent Media Trust, of which Reliance Industries is the sole beneficiary.
Discover the latest Business News, Sensex, and Nifty updates. Obtain Personal Finance insights, tax queries, and expert opinions on Moneycontrol or download the Moneycontrol App to stay updated!
Find the best of Al News in one place, specially curated for you every weekend.
Stay on top of the latest tech trends and biggest startup news.


