


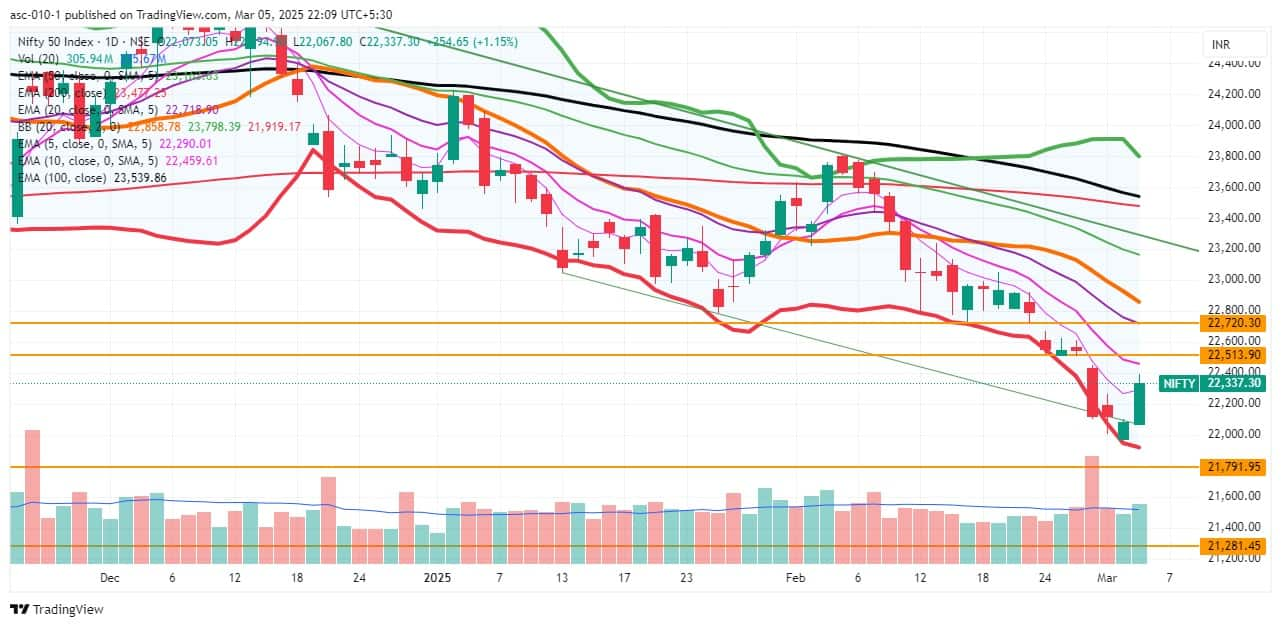
The market rebounded sharply on March 5 after 10 days of losses, with the Nifty 50 rising more than 1 percent, accompanied by above-average volumes, signaling positivity. The rally seems to have raised hopes of bulls gaining strength but needs confirmation by showing a consistent upward trend in the upcoming sessions. Until then, consolidation may be the most likely scenario, according to experts. If the index defends the 5-day EMA (22,290), the immediate target to watch will be 22,500, followed by 22,750. However, 22,050 (the 100-week EMA) is the immediate support, followed by 21,960, which is considered crucial support.
Here are 15 data points we have collated to help you spot profitable trades:
1) Key Levels For The Nifty 50 (22,337)
Resistance based on pivot points: 22,392, 22,469, and 22,594
Support based on pivot points: 22,142, 22,065, and 21,940
Special Formation: The Nifty 50 formed a bullish candlestick pattern on the daily charts with a higher high-higher low formation, which is a positive sign. The momentum indicator RSI (Relative Strength Index) reversed from the oversold zone at 33.64 with a positive crossover but remained in the lower band, and the MACD (Moving Average Convergence Divergence) stayed below the zero line.
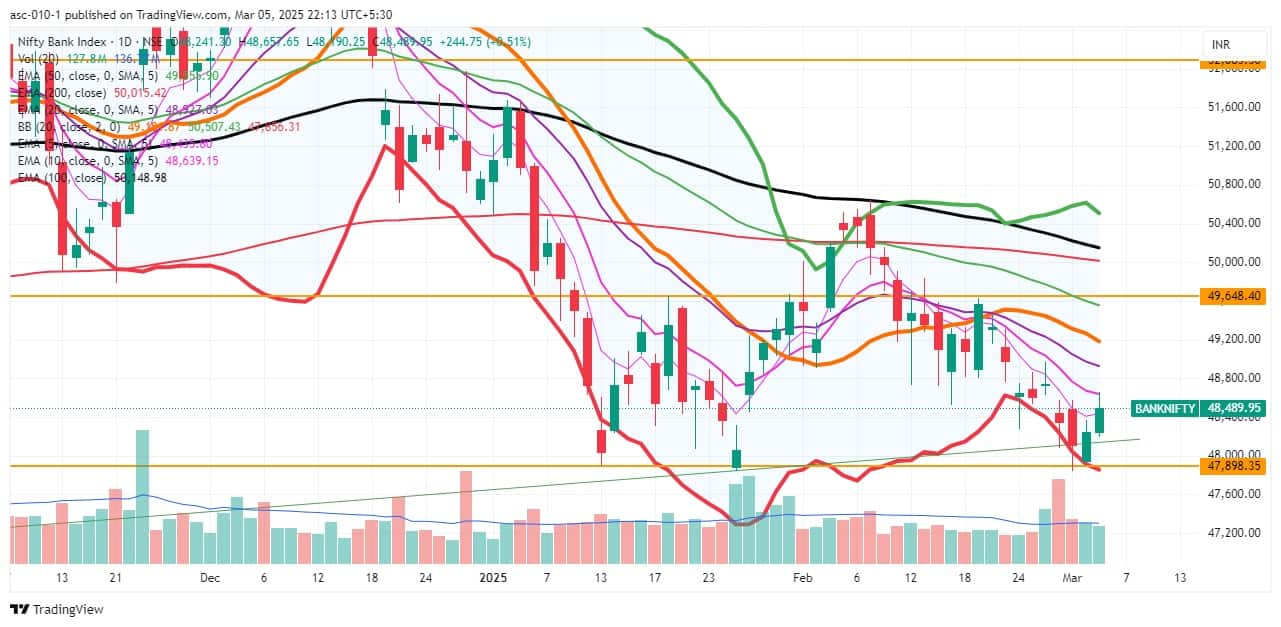
2) Key Levels For The Bank Nifty (48,490)
Resistance based on pivot points: 48,624, 48,735, and 48,913
Support based on pivot points: 48,267, 48,157, and 47,978
Resistance based on Fibonacci retracement: 49,402, 50,375
Support based on Fibonacci retracement: 47,881, 46,078
Special Formation: The Bank Nifty also formed a bullish candlestick pattern with a minor upper shadow on the daily charts, signaling the strength of the bulls. However, there is still pressure at higher levels. The index gained 245 points and attempted to fill the down-gap of February 28 (48,627) but failed to close above it. The index climbed above the 5-day EMA for the first time in the last nine consecutive sessions, which is positive but needs to sustain the same for further upward movement.
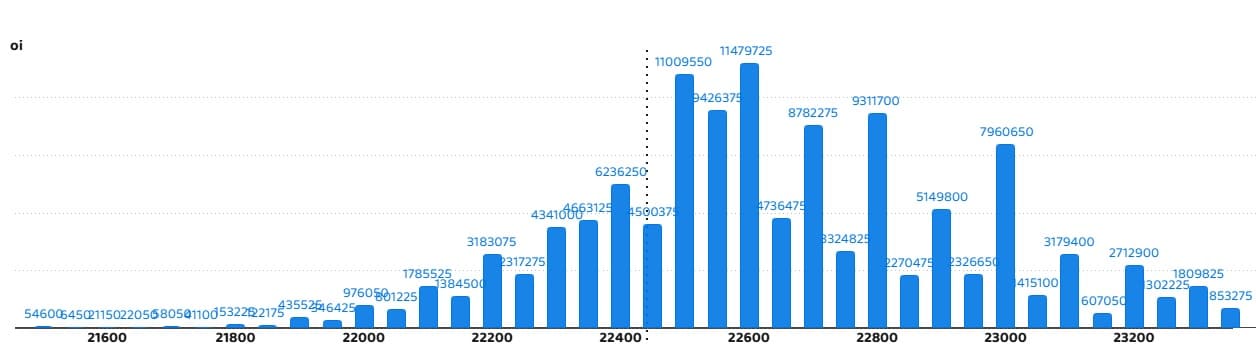
According to the weekly options data, the 22,600 strike holds the maximum Call open interest (with 1.14 crore contracts). This level can act as a key resistance for the Nifty in the short term. It was followed by the 22,500 strike (1.1 crore contracts) and the 22,550 strike (94.26 lakh contracts).
Maximum Call writing was observed at the 22,550 strike, which saw an addition of 58.32 lakh contracts, followed by the 22,600 and 22,450 strikes, which added 22.73 lakh and 16.74 lakh contracts, respectively. The maximum Call unwinding was seen at the 22,200 strike, which shed 51.4 lakh contracts, followed by the 22,300 and 22,100 strikes, which shed 31.25 lakh and 31.08 lakh contracts, respectively.
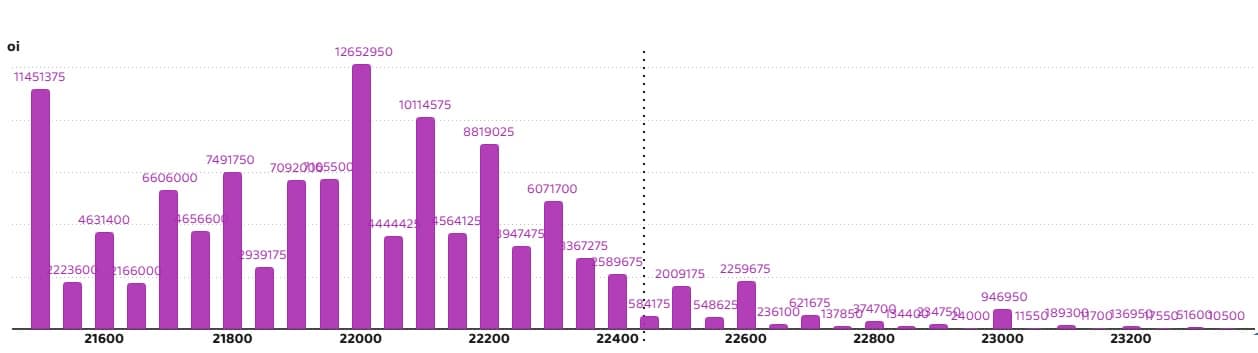
On the Put side, the maximum Put open interest was seen at the 22,000 strike (with 1.26 crore contracts), which can act as a key support level for the Nifty. It was followed by the 21,500 strike (1.14 crore contracts) and the 22,100 strike (1.01 crore contracts).
The maximum Put writing was placed at the 22,200 strike, which saw an addition of 57.72 lakh contracts, followed by the 22,100 and 22,300 strikes, which added 49.69 lakh and 43.88 lakh contracts, respectively. The maximum Put unwinding was seen at the 21,900 strike, which shed 10.56 lakh contracts, followed by the 22,500 and 23,000 strikes, which shed 4.42 lakh and 2.21 lakh contracts, respectively.
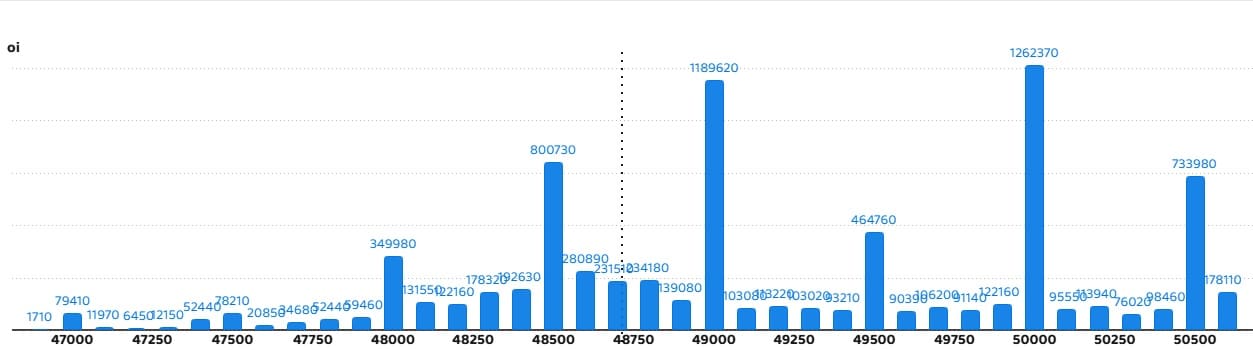
5) Bank Nifty Call Options Data
According to the monthly options data, the maximum Call open interest was seen at the 50,000 strike, with 12.62 lakh contracts. This can act as a key resistance level for the index in the short term. It was followed by the 49,000 strike (11.89 lakh contracts) and the 48,500 strike (8 lakh contracts).
Maximum Call writing was visible at the 48,500 strike (with the addition of 1.47 lakh contracts), followed by the 48,600 strike (75,900 contracts) and the 50,500 strike (75,000 contracts). The maximum Call unwinding was seen at the 48,200 strike, which shed 30,390 contracts, followed by the 50,000 and 48,300 strikes, which shed 29,280 and 28,170 contracts, respectively.
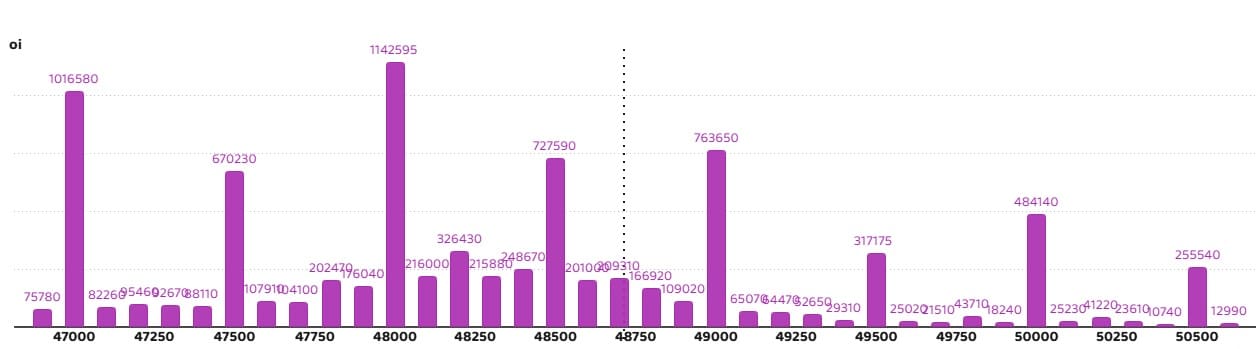
6) Bank Nifty Put Options Data
On the Put side, the 48,000 strike holds the maximum Put open interest (with 11.42 lakh contracts), which can act as a key support level for the index. This was followed by the 47,000 strike (10.16 lakh contracts) and the 49,000 strike (7.63 lakh contracts).
The maximum Put writing was observed at the 47,000 strike (which added 2.26 lakh contracts), followed by the 47,500 strike (1.59 lakh contracts) and the 48,700 strike (84,480 contracts). The maximum Put unwinding was seen at the 48,300 strike, which shed 42,480 contracts, followed by the 49,300 and 47,800 strikes which shed 15,360 and 14,700 contracts, respectively.
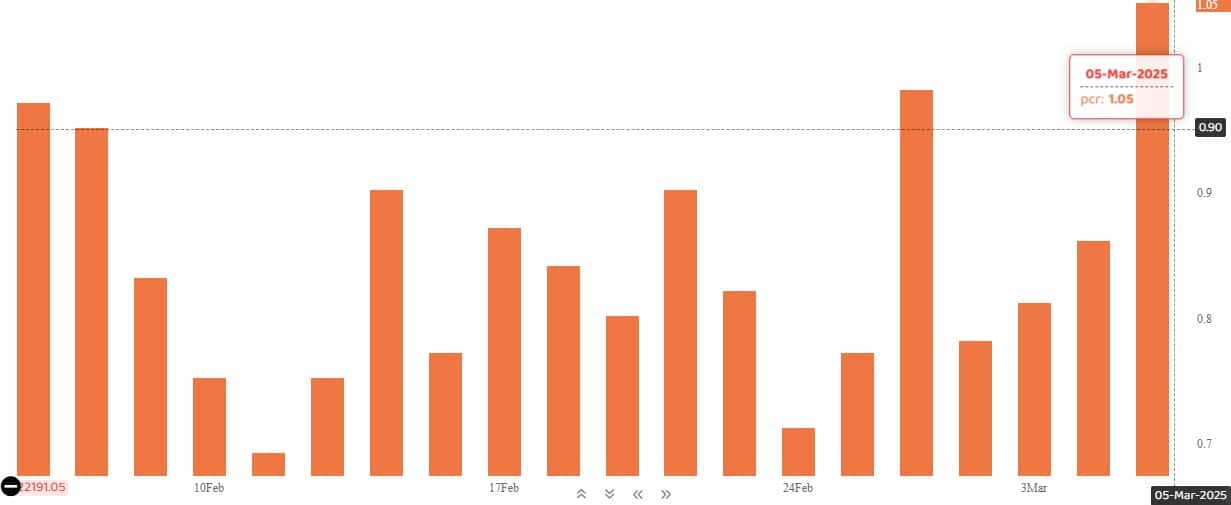
The Nifty Put-Call ratio (PCR), which indicates the mood of the market, jumped to 1.05 (the highest level since February 4) on March 5, against 0.86 in the previous session.
The increasing PCR, or being higher than 0.7 or surpassing 1, means traders are selling more Put options than Call options, which generally indicates the firming up of a bullish sentiment in the market. If the ratio falls below 0.7 or moves towards 0.5, then it indicates selling in Calls is higher than selling in Puts, reflecting a bearish mood in the market.
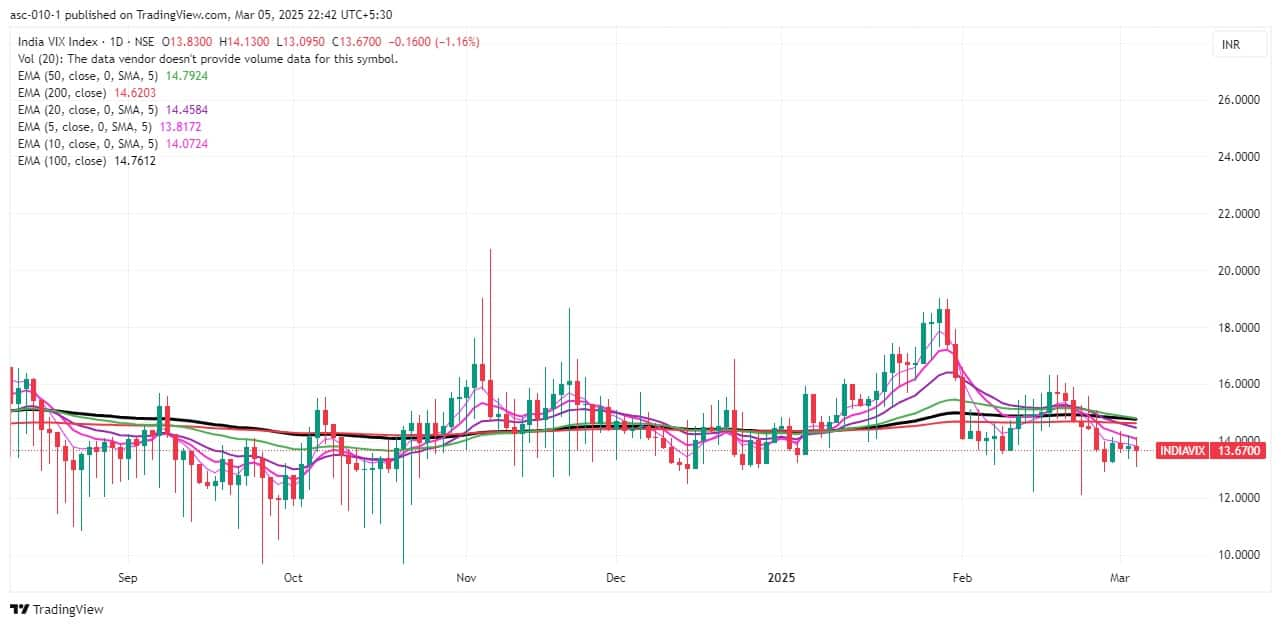
9) India VIX
The India VIX, the volatility index that measures expected market volatility, remained in the lower zone and below all key moving averages, making the bulls more comfortable. It declined by 1.16 percent to 13.67 on Wednesday.
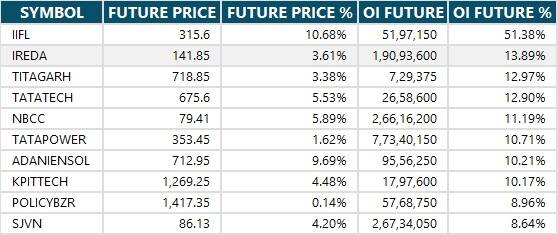
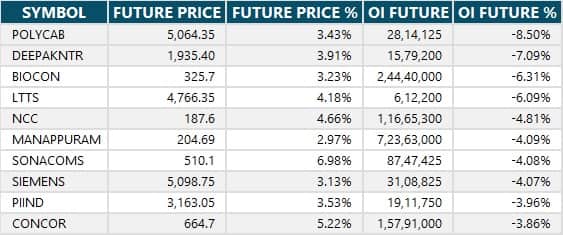
10) Long Build-up (115 Stocks)
A long build-up was seen in 115 stocks. An increase in open interest (OI) and price indicates a build-up of long positions.
3 stocks saw a decline in open interest (OI) along with a fall in price, indicating long unwinding.
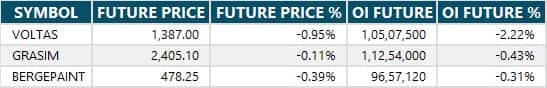
12) Short Build-up (12 Stocks)
12 stocks saw an increase in OI along with a fall in price, indicating a build-up of short positions.
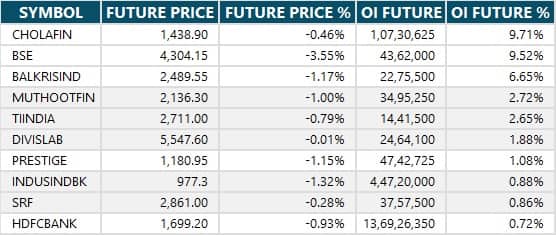
13) Short-Covering (91 Stocks)
91 stocks saw short-covering, meaning a decrease in OI, along with a price increase.
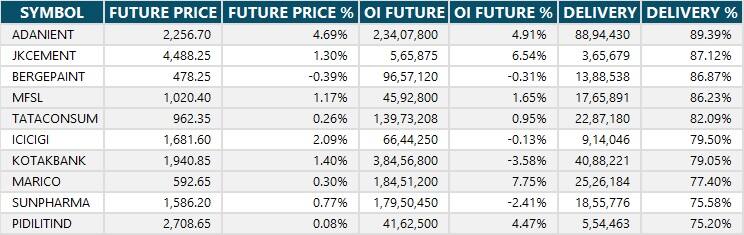
Here are the stocks that saw a high share of delivery trades. A high share of delivery reflects investing (as opposed to trading) interest in a stock.
Securities banned under the F&O segment include companies where derivative contracts cross 95 percent of the market-wide position limit.
Stocks added to F&O ban: Nil
Stocks retained in F&O ban: Manappuram Finance
Stocks removed from F&O ban: Nil
Disclaimer: The views and investment tips expressed by experts on Moneycontrol are their own and not those of the website or its management. Moneycontrol advises users to check with certified experts before taking any investment decisions.Disclosure: Moneycontrol is a part of the Network18 group. Network18 is controlled by Independent Media Trust, of which Reliance Industries is the sole beneficiary.Discover the latest Business News, Sensex, and Nifty updates. Obtain Personal Finance insights, tax queries, and expert opinions on Moneycontrol or download the Moneycontrol App to stay updated!
Find the best of Al News in one place, specially curated for you every weekend.
Stay on top of the latest tech trends and biggest startup news.


