


Bulls retained their reign on Dalal Street for the second consecutive week ended April 6, taking the Nifty50 to a one-month peak and the BSE Sensex near its psychological 60,000 mark, especially after the Reserve Bank slammed the brakes on rate hikes.
The Nifty50 climbed 239 points or 1.4 percent to 17,599, and formed a bullish candlestick pattern on the weekly scale, making higher highs higher lows for second consecutive week. The index returned above the 50-day EMA (exponential moving average) with the momentum indicator RSI (relative strength index) giving a positive crossover, indicating the favourable trend.
Hence, the Nifty50 may find resistance at the 17,600-17,800 zone and, if these levels get surpassed, then all eyes on the psychological 18,000 mark, with supports at 17,500-17,300 and 17,200 levels, experts said.
"One should not become complacent and should not rule out the possibility of a breather after the steep rally. 17,500-17,400 is likely to cushion any short-term blip, while the sacrosanct support lies around the bullish gap of 17,200 in the comparable period," Osho Krishan, Senior Analyst - Technical & Derivative Research at Angel One said.
On the flip side, he feels the 17,600-17,700 is likely to be seen as an immediate hurdle and an authoritative breach beyond the same could only trigger the next leg of rally in Nifty towards 17,800 for the upcoming week.
Going ahead, one needs to keep a close tab on the mentioned levels and continue with a buy-on-decline strategy for the time being, Osho advised.
Technical Analyst and Trader, Amit Seth also advised if the market gives an opportunity in the form of a dip towards support levels (17,200-17,300), it would be an opportunity to create fresh long positions with a good risk reward.
Technically a small pullback and consolidation would be healthy for Nifty and enable it to make fresh record highs in April, he said.
Let's take a look at the top 10 trading ideas by experts for the next three-four weeks. Returns are based on the April 6 closing prices:
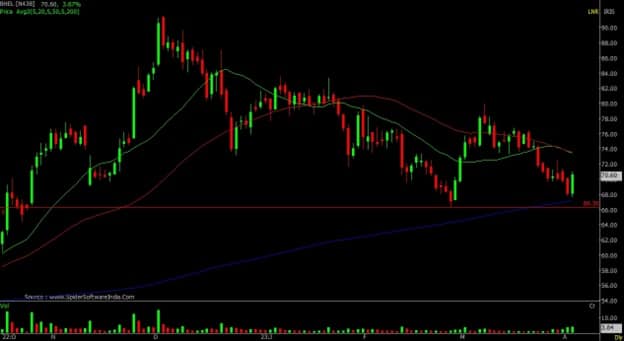
Shrikant Chouhan, Head of Equity Research (Retail) at Kotak SecuritiesBHEL: Buy | LTP: Rs 71 | Stop-Loss: Rs 65 | Target: Rs 78 | Return: 10 percentThe stock has formed a higher bottom after rebounding from a low of Rs 67.60. It was higher than Rs 66.30 on February 27. The volume indicator suggests the price to buy support from the last 3 days.
Based on the longer-term averages, the stock was trading near the support of 200-days SMA (simple moving average) which stood at Rs 67.20 on the reversal date.
In short, the reversal has taken place with the help of several indicators, which will make a case for buying the stock with a positional approach. On the upside, resistance will lie at Rs 74 and Rs 78. Put stop-loss at Rs 65.
It is diverging positively on the daily and weekly charts, indicating a pause in the prevailing trend or change in the trend. The stock was falling before Friday's reversal.
It will drag the stock to the nearest resistance which is at Rs 6,050 and in the medium term it may trade towards Rs 6,550 which was its previous high. It is a buy at the current level and on further declines at Rs 5,800, keeping a stop-loss at Rs 5,700.

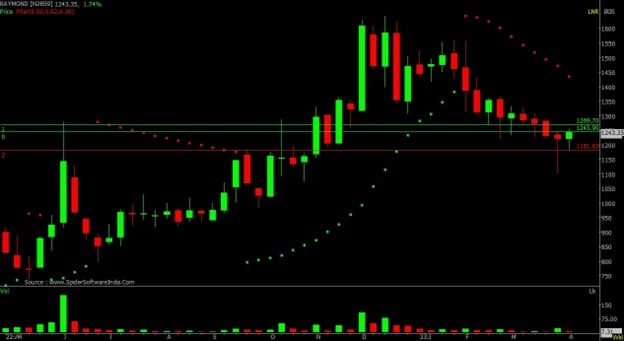
On the weekly chart, the stock has formed a perfect reversal pattern after hitting the important support at Rs 1,100. On the daily chart, the stock was in a corrective pattern for a spectacular rally between Rs 800 to Rs 1,500, which it witnessed during the period from June to December 2022.
On an immediate basis, it will find resistance at Rs 1,270 where it has spent considerable time, however, a sustainable move above Rs 1,270 will lift the stock towards Rs 1,350 or Rs 1,450 in the medium term.
Based on these observations. it is a buy at current levels and more addition is advisable if it manages to sustain above Rs 1,270, it could see further upsides. Place stop-loss at Rs 1,180.
The realty segment stocks have seen an underperformance and has corrected along with the broader markets in last few months. However, the RBI's decision to pause the rate hike cycle for now led to a buying interest in stocks from this rate sensitive segment and DLF gave a breakout from its resistance zone.
The volumes during the breakout were good and the RSI (relative strength index) oscillator is also hinting at a positive momentum.
Traders can buy the stock in the range of Rs 380-374 for potential short term targets of Rs 398 and Rs 408. The stop-loss on long positions should be placed below Rs 365.
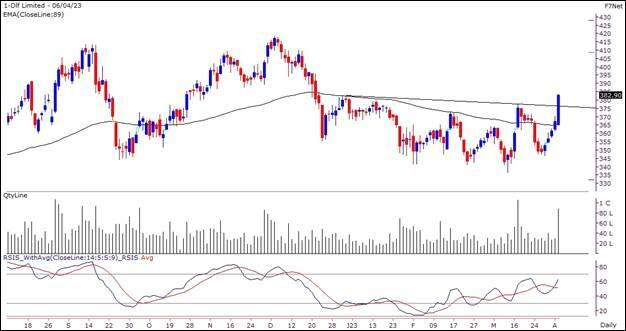
The stock has recently seen a consolidation phase above its 89-day EMA support and has now given a breakout its resistance. The volumes along the breakout are good and the RSI readings are indicating a positive momentum thus indicating a resumption of its broader uptrend.
Traders can buy the stock on declines in the range of Rs 2,240-2,220 for potential short term targets of Rs 2,300 and Rs 2,340. The stop-loss on long positions should be placed below Rs 2,185.
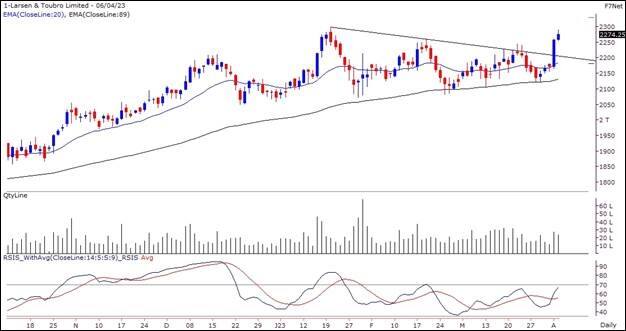
The stock seems to be trading in an upwards sloping parallel channel pattern since a year on the daily timeframe and making higher high higher low formation. Recently the stock has taken support from a support trendline and formed a bullish candle above important EMAs of 20-50-100-200-day which can be used as a confluence towards the bullish view.
On the indicator front, the supertrend indicator is indicating a bullish trend continuation on the weekly timeframe and the Ichimoku Cloud is also suggesting a bullish move as the price is trading above the conversion and base line on the daily timeframe.
Momentum oscillator RSI (relative strength index 14) is at around 53 on the daily time frame indicating strength by sustaining above 50 and observation of the above factors indicates that a bullish move in KEC is possible for targets upto Rs 505.
One can initiate a buy trade in between the range of Rs 465-467, with a stop-loss of Rs 445 on daily closing basis.

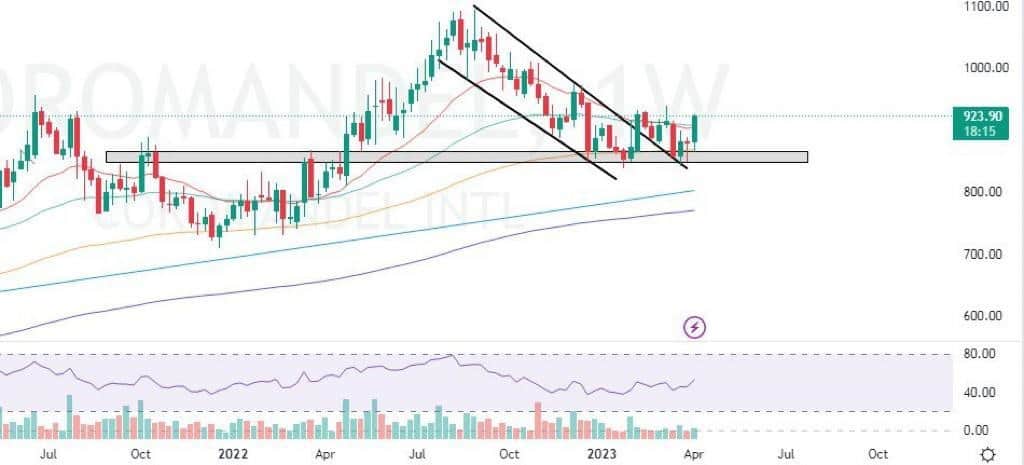
Coromandel seems to be making a double bottom like formation at a strong support zone on the weekly timeframe and closing with a big bullish candle on the daily timeframe.
On the indicator front, the supertrend indicator is indicating a bullish reversal, momentum oscillator RSI (14) is at around 61 on the daily time frame indicating strength by sustaining above 50 and the Ichimoku Cloud is also suggesting a bullish move as the price is trading above the cloud.
Observation of the above factors indicates that a bullish move in Coromandel is possible for targets upto Rs 970. One can initiate a buy trade in the range of Rs 920-923, with a stop-loss of Rs 890 on daily closing basis.
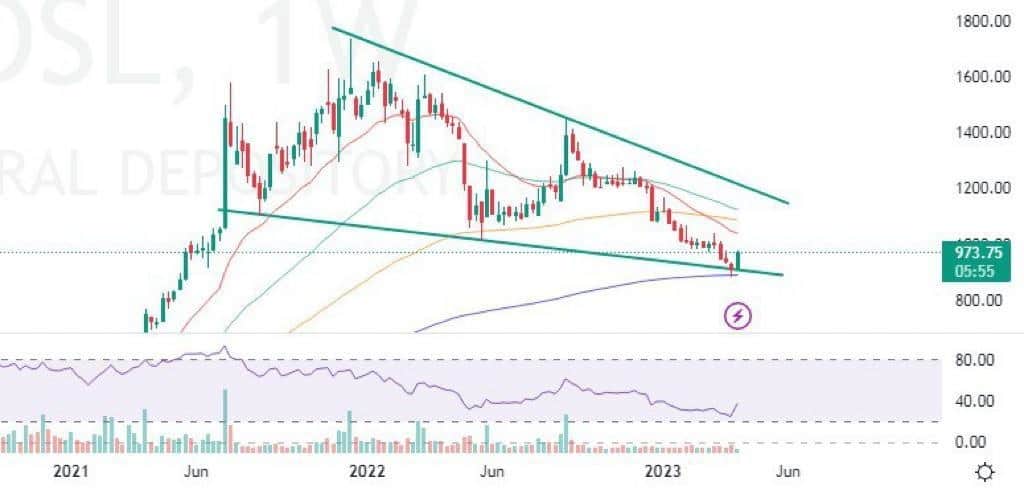
CDSL seems to be trading at the support zone of a falling wedge pattern and closing with a bullish candlestick on the weekly timeframe after taking support from its 200-day EMA. Momentum oscillator RSI (14) is at around 53 on the daily time frame indicating strength by sustaining above 50 and the Ichimoku Cloud is also suggesting a bullish move as the price is trading above the conversion line.
Observation of the above factors indicates that a bullish move in CDSL is possible for targets upto Rs 1,080. One can initiate a buy trade in between the range of Rs 970-973, with a stop-loss of Rs 913 on daily closing basis.
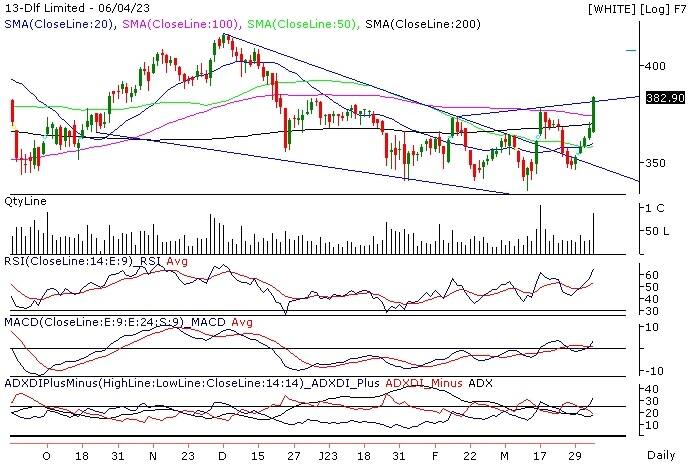
A falling wedge formation and an Inverse Head and Shoulder pattern have both broken out on the counter. We are able to clearly observe a Bullish Marubozu candlestick pattern on the weekly time period.
With a positive bias in the momentum indicator RSI, it is trading above its pivotal moving averages. MACD (moving average convergence divergence), however, is also exhibiting a bullish crossover.
The 200-DMA near Rs 370 should now serve as immediate support on the downside, and Rs 410 and Rs 425 are target levels on the upside.
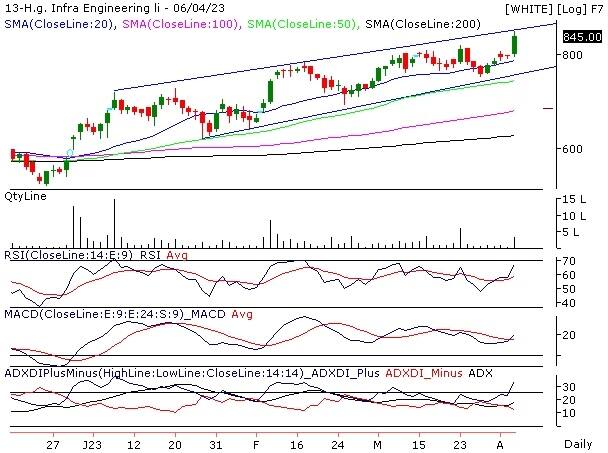
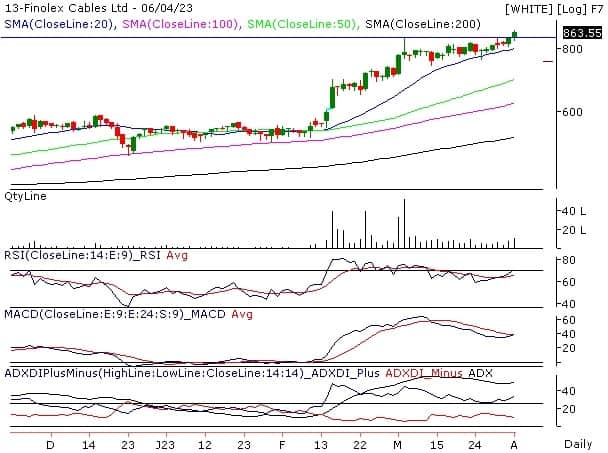
The counter is making higher highs and higher lows consistently and is in a strong bullish trend. It recently successfully surpassed its previous record high of Rs 830 with a respectable volume.
With majority of the momentum indicators showing a positive bias, it is trading above all of its significant moving averages. The immediate support level will be the 20-DMA at about Rs 786, and the upside is still open with targets at Rs 900 and Rs 940 levels.
With a breakout of the Flag pattern, the counter is resuming its bullish momentum. A target above Rs 1,000 level is indicated by the pattern, and the 20-DMA is acting as a reliable and quick support level.
It is possible to maintain itself above Rs 750 level, which was its previous record high. The RSI momentum indicator is experiencing a positive crossover and is maintaining a strong above the level of 60.
To reinforce the strength of the current bullish trend, ADX (average directional index) is trading above the 40 level.
Discover the latest Business News, Sensex, and Nifty updates. Obtain Personal Finance insights, tax queries, and expert opinions on Moneycontrol or download the Moneycontrol App to stay updated!
Find the best of Al News in one place, specially curated for you every weekend.
Stay on top of the latest tech trends and biggest startup news.


