


Ashish Kyal, CMT
KST indicator developed by Martin Pring is an amazing way to look at the cyclicality in the markets.
Know Sure Thing (KST): To understand where we stand in terms of the cyclicality of the market I am showing an indicator that is known to have worked extremely well – KST (Know Sure Thing).
This indicator is developed by Martin Pring and it is nothing but a summation of various Rate of change indicators.
Rate of change (ROC) is an indicator that measures the momentum of the market. In fact, the momentum is the speed with which prices are moving higher or lower. If prices are moving higher but at a slower pace, it is not a healthy sign.

ROC of different parameters measures different cyclicality of the market. By combining these different ROCs one indicator is taking care to reflect if the momentum is slowing across the different cycle periods or not.
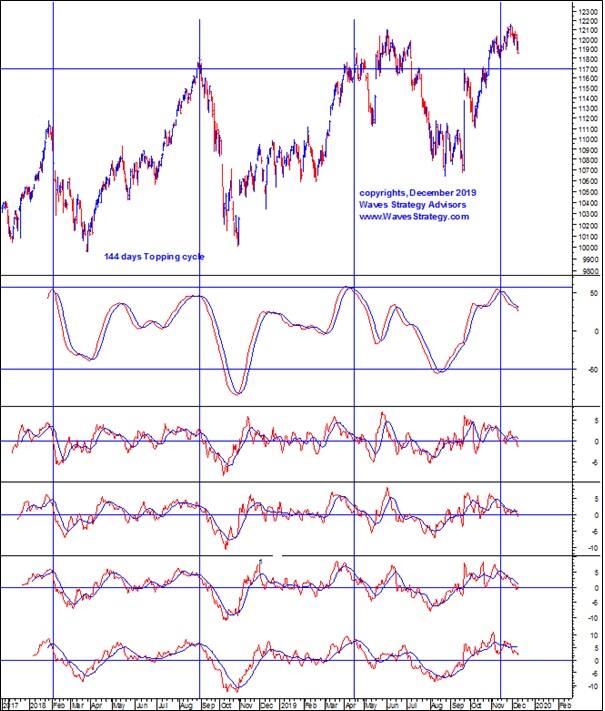
By simply gazing at the individual ROC indicator we can see that across the time frames the readings are lower and very close to the 0 value.
Also, there are negative divergences on all of these ROC readings. This suggests that the cycles across the short term time frames are probably topping out.
To get better conviction and confirmation now look at the KST indicator. We can see that since 2018 onwards KST has never crossed above 59 reading and every time it turned down from that zone by crossing below the signal blue line there has been significant correction seen in prices.
This time as well KST has now turned down from 59 levels and is now moving below the signal line. Do note that prices continued to touch the lifetime high of 12,159 before reversing from there.
KST has turned down earlier than that thereby giving a leading signal and negative divergences with prices.
Topping 144 days Time cycle:
Interestingly, the turn in KST reading from the extreme levels have been very much cyclical. We can see that each of the turns has come nearly in 144 days including the one which was before the election outcome.
Isn’t it amazing to see a simple indicator that has provided a classical signal? So, will it work again?
(The author is Founder & CEO at Waves Strategy Advisors.)
Disclaimer: The views and investment tips expressed by investment experts on moneycontrol.com are his own and not that of the website or its management. Moneycontrol.com advises users to check with certified experts before taking any investment decisions.

Discover the latest Business News, Sensex, and Nifty updates. Obtain Personal Finance insights, tax queries, and expert opinions on Moneycontrol or download the Moneycontrol App to stay updated!
Find the best of Al News in one place, specially curated for you every weekend.
Stay on top of the latest tech trends and biggest startup news.


