


Vidnyan Sawant, AVP - Technical Research at GEPL Capital
On the weekly timeframe, it can be observed that the prices are currently trending within a downward-moving channel, and there has been a recent reversal in the direction towards lower channel support.
Furthermore, the Nifty is presently trading at three-week lows, indicating a formation of a Bearish Hikkake candlestick pattern. The momentum indicator RSI (relative strength index), plotted on the weekly timeframe, is sustaining below 50, indicating a lack of positive momentum in the prices.
The immediate resistance for the index is positioned at the psychological level of 18,000, followed by 18,265, which has previously served as a significant resistance level with multiple touches. The downside support for the index is situated at 17,353, which is a swing low, followed by the key support level of 17,000.
Based on the overall trend and indications from the indicators, it can be inferred that a move below 17,353 could potentially lead to a further decline in prices towards the key support level of the 17,000 mark


Here are three buy calls for next 2-3 weeks:
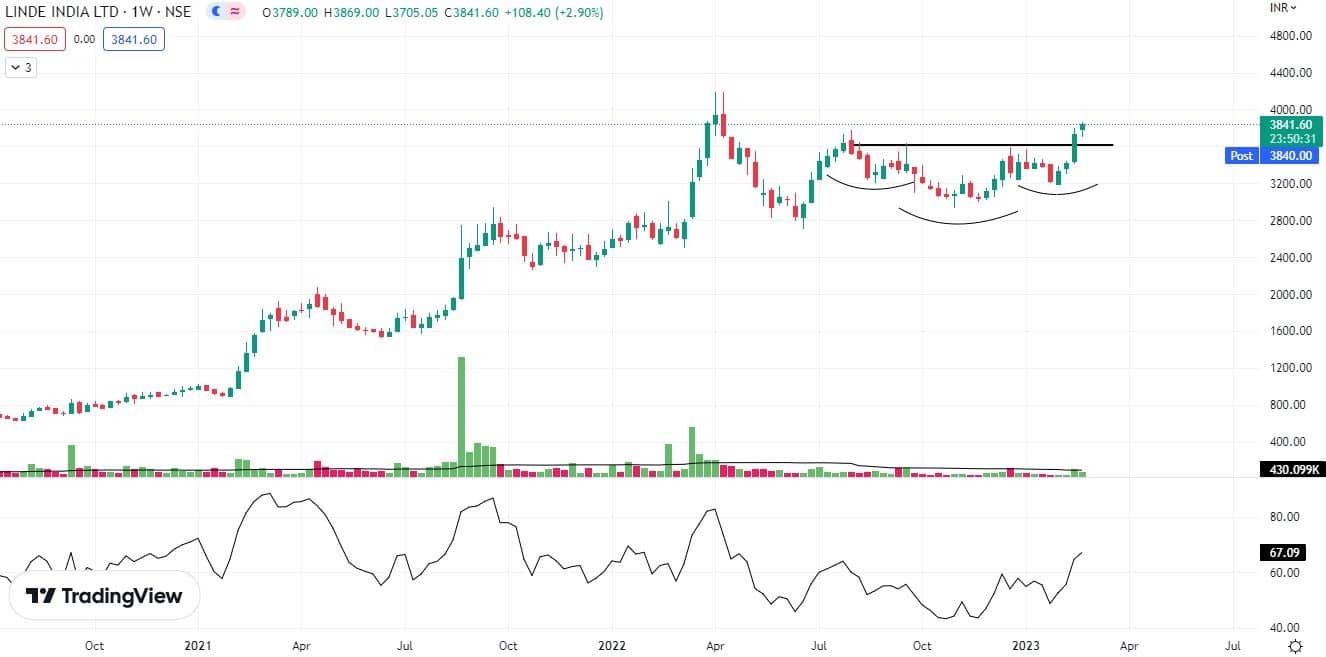
Linde India: Buy | LTP: Rs 3,841.60 | Stop-Loss: Rs 3700 | Target: Rs 4,270 | Return: 11 percent
Linde India’s correction post-April 2022 was structured, with no signs of a Lower Low, Lower High formation. The stock recently broke out of an Inverse Head and Shoulder pattern, signalling a potential reversal and continuation of the prior uptrend.
The Bollinger Bands on the daily chart have expanded, indicating increased price volatility and the potential for further upward movement.
Prices have remained above key moving averages, including the 50, 100, and 200-day EMAs (exponential moving averages). The RSI has sustained above 50 on both the daily and weekly timeframes, indicating a positive momentum for a potential upward trend.
Moving forward, we expect prices to rise to the level of Rs 4,270 with a recommended stop-loss of Rs 3,700 on a closing basis.
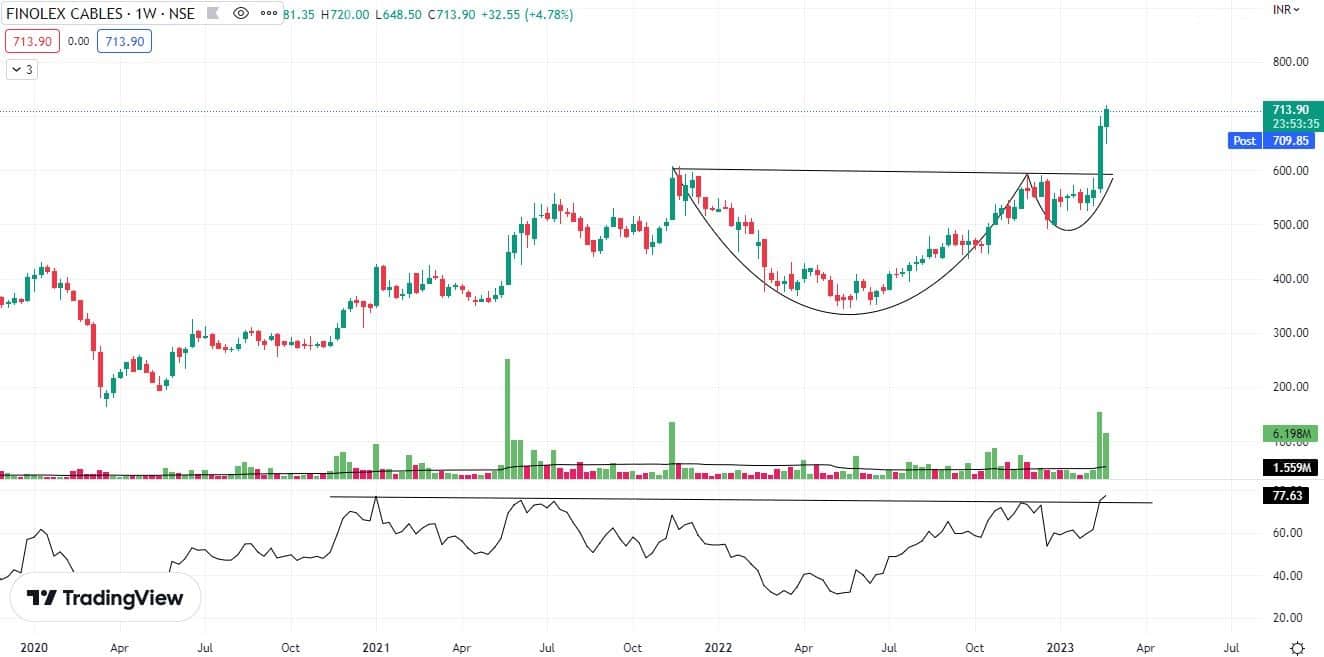
Finolex Cables: Buy | LTP: Rs 713.90 | Stop-Loss: Rs 660 | Target: Rs 780 | Return: 9 percent
Finolex Cables is currently nearing record highs, which tells us that the stock already is in strong momentum. Last week, the stock broke out of a Cup & Handle pattern, signalling a continuation of the prior uptrend.
The breakout is confirmed as it is accompanied by higher volumes. The prices are continuously hovering near the upper Bollinger band, which points towards the rising volatility of the prices.
RSI on the weekly timeframe has exhibited a breakout that reflects the strong presence of momentum.
Going ahead we expect the prices to move higher to Rs 780 and the stop-loss must be Rs 660 on the closing basis.
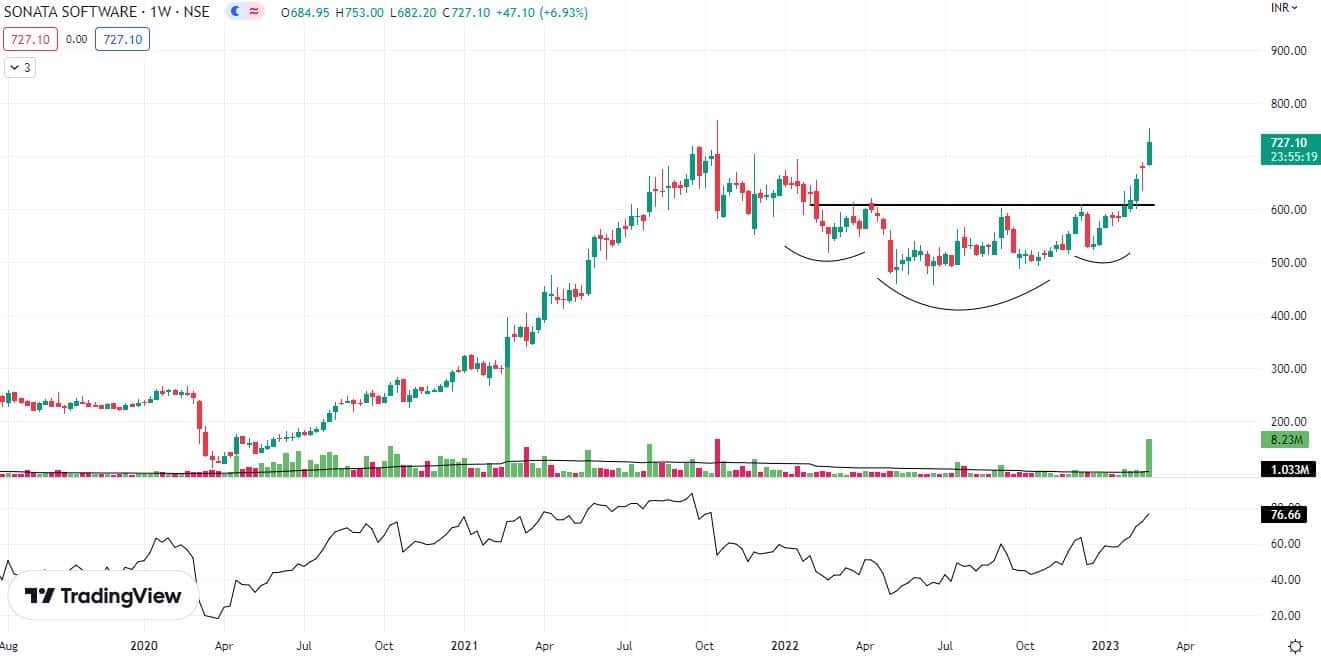
Sonata Software: Buy | LTP: Rs 727 | Stop-Loss: Rs 660 | Target: Rs 800 | Return: 10 percent
Sonata Software has been demonstrating a robust upward momentum, as reflected by its ongoing ascent towards new record-high trading levels.
The stock has successfully breached the Inverse Head & Shoulder Pattern, signalling a bullish reversal in the trend.
Furthermore, the consistent trading of prices near the upper Bollinger Band indicates rising volatility for an upward movement, while the up move in prices is supported by higher volumes, suggesting a long built-up in the stock.
On the weekly timeframe, the Relative Strength Index (RSI) is exhibiting a rising trend and is currently positioned above 50, indicating the presence of momentum.
Going ahead we expect the prices to move higher to Rs 800 where the stop-loss must be Rs 660 on the closing basis.
Disclaimer: The views and investment tips expressed by investment experts on Moneycontrol.com are their own and not those of the website or its management. Moneycontrol.com advises users to check with certified experts before taking any investment decisions.

Discover the latest Business News, Sensex, and Nifty updates. Obtain Personal Finance insights, tax queries, and expert opinions on Moneycontrol or download the Moneycontrol App to stay updated!
Find the best of Al News in one place, specially curated for you every weekend.
Stay on top of the latest tech trends and biggest startup news.


