


Nilesh Jain
Markets continued to gain momentum for the fifth consecutive week amid volatility. The bulls staged a smart comeback in the latter part of the week after taking support near 10,560 levels. Due to the recovery from the lower levels, Nifty index formed a Hanging Man candlestick pattern on the weekly scale which is considered as a bearish reversal pattern but still, we need a confirmation on the same, which will come if Nifty breaks the low of 10,560.
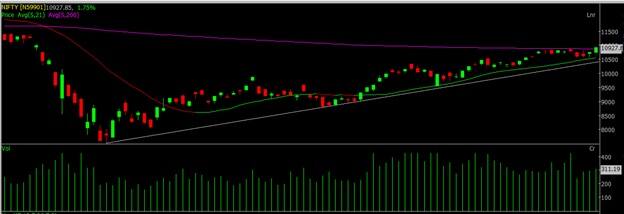
On the daily chart, the Nifty index surpassed its major hurdle of 200-DMA which is placed at 10,870 levels. It was earlier acting as major resistance and now it will act as immediate support.
As highlighted in the below chart, the Nifty index is taking support of its short term 21-DMA which is placed at 10,560 levels and if we take the retracement of the entire fall, then 61.8 percent retracement of the entire fall is placed at the same levels.
Now, as long as Nifty trades above 10,560 levels, we can expect the ongoing rally to continue towards 11,200 levels. A runaway gap is also seen at 11,200 levels and Nifty may make an attempt to fill the same. The momentum indicators and oscillators are still in the buy mode on a weekly scale which hints that bulls are tightening the grip.
The volatility index IndiaVIX fell by 3.5 percent and ended at 24.15 levels. As long as it trades below 30 levels, the bulls will have upper hand on the market.
The weekly options data indicates that a huge amount of put writing was seen in 10,700 and 10,800 strikes on Friday. The maximum open interest on the Put side has shifted to 10,700 strike, which holds the open interest of 27 lakh contracts and also likely to act as a major support in the coming week.
A huge amount of Call writing was seen at 11,200 strike which also holds the maximum open interest followed by 11,000 strike. So the overall option data indicates that the bulls are having an upper hand and Nifty may trade in a broader range of 10,700 - 11,200.
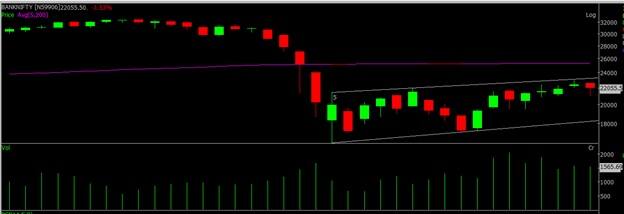
The BankNifty index underperformed compared to Nifty and also formed a hanging man candlestick pattern on the weekly scale. As highlighted in the below weekly chart, the BankNifty index is trading in a rising channel, where the upper end of the rising channel is placed at 23,200 levels which will act as immediate resistance and above that the upside may extend further towards 24,000 levels.
On the flip side, 21,000 will be a major support for the BankNifty index.
On the weekly scale, the momentum indicator and oscillators are very well in the buy mode. Now, for Nifty to surpass the psychological barrier of 11,000 mark, BankNifty has to participate.
Looking at the broader market participation, one should focus on the stock-specific action which is likely to continue.
Berger Paints: Buy | Target: Rs 570 | Stop loss: Rs 496 | Upside: 10 percent
The stock has provided a breakout from a symmetrical triangle formation on the weekly scale. The momentum oscillator MACD has also provided fresh buy crossover on the daily as well as a weekly chart. The stock is also trading above its short term and long term moving averages.
Apollo Hospitals Enterprises: Buy | Target: Rs 1,650 | Stop loss: Rs 1,425 | Upside: 10 percent
The stock has provided breakout from an ascending triangle formation on the daily chart. The momentum and oscillators have started reversing from its oversold territory on the weekly scale and RSI has provided breakout from a downward sloping trend line on the daily chart. Based on the aforementioned rationale, we expect the stock to move towards Rs 1,650 levels.
Havells India: Buy | Target: Rs 630 | Stop loss: Rs 570 | Upside: 7 percent
The stock earlier provided breakout from a falling trend line and now it has retested the same. It is also taking the support of short term 21-DMA which is currently placed near Rs 580 levels. The momentum indicators and oscillators are very well in the buy mode.
The author is Derivative and Technical Analyst- Equity Research at Anand Rathi.
Disclaimer: The views and investment tips expressed by investment expert on Moneycontrol.com are his own and not that of the website or its management. Moneycontrol.com advises users to check with certified experts before taking any investment decisions.

Discover the latest Business News, Sensex, and Nifty updates. Obtain Personal Finance insights, tax queries, and expert opinions on Moneycontrol or download the Moneycontrol App to stay updated!
Find the best of Al News in one place, specially curated for you every weekend.
Stay on top of the latest tech trends and biggest startup news.


