


Most stock market gurus having been ‘warning’ investors about entering the markets at the current high valuations (reflected in high P/E multiples). They have been strongly suggesting that investors exit, at least partially, to book gains and re-enter when markets correct. Does this advice hold good for all stocks? The answer is ‘no’. Quality stocks can be bought at any time, irrespective of valuations. What is the justification for this statement?
‘Quality’ never comes cheap. This statement holds true for stocks of companies run by honest and competent managements, which are leaders in their sector, have an impregnable moat, are consistent innovators, have low debt and have consistently delivered high return on capital employed and cash flows over the years. In fact, these stocks have always been valued at high P/E ratios for years and have yet continued to rise in valuations. These stocks continue to deliver returns across market cycles and other micro and macro upheavals.
Revealing ratiosHere are a few ratios that could help you spot such high-quality business.
To assess whether the business is profitable:Gross profit margin (GPM): Gross profit margin is used to assess a company's financial health and core profitability. It also assesses the business’ ability to absorb shocks such as sudden rise in costs, etc. It is computed by subtracting cost of goods sold from sales and is expressed as a percentage of sales. It indicates the percentage of cash left over after meeting cost of production.
Formula: (Net sales minus cost of goods sold) divided by net salesOperating Profit Margin (OPM): Operating profit (EBIT) margin indicates how much profit a company makes on every rupee worth of sales. It’s the profits the company is left with after paying variable costs of production (e.g. wages, raw materials, etc.). This ratio reveals the company’s profitability after accounting for all operational costs and is a good measure to reveal the company’s cost control initiatives. Higher the gross profit and operating profit margins, more attractive the company is in comparison to its peers in the industry.
Formula: Earnings before interest and tax (EBIT) (also called as operating profit) divided by sales(EBIT is Revenues minus cost of goods sold and operating expenses.)
Return on Capital Employed (ROCE): Return on capital employed indicates how much profit a company has generated from the capital used in the business. It indicates the returns the business has generated for all financial stakeholders and reveals the management’s effectiveness in running the business. ROCE should exceed the (Risk-Free Rate + Equity Risk Premium) Ideally ROCE should be more then 14-15% consistently over a long period of time (at least 5 years and above).
Formula: Earnings before interest and tax (EBIT) (also called as operating profit) divided by capital employed(EBIT is Revenues minus cost of goods sold and operating expenses.) (Capital employed is total assets minus current liabilities, which is the same as shareholders’ equity plus long-term debts.)
Cash Conversion Ratio (CCR): This ratio determines the ratio of the cash flows to net profits. In other words, it assesses the amount of cash flow a company generates compared to its book profit. This ratio reveals the management’s ability to consistently convert profits into cash. It’s a good measure of the management’s efficiency and flexibility to be able to convert profits into cash quickly. Cash conversion ratio exceeding 1 is desired.
Formula: Cash flows divided by net profitTo assess whether the business is financially stable:Debt/Equity: This ratio indicates how much the company has borrowed in relation to its shareholder capital. It indicates whether the company’s equity capital is sufficient to meet its debts in case of a business downturn. It’s a measure of the financial risk the company has taken by borrowing. It indicates the extent of volatility in the returns (higher the leverage, more volatile the returns) and financial stability (lower debt indicates higher stability). The company’s Debt/Equity ideally shouldn't exceed 0.5; however, it may vary based on certain businesses.
Formula: Debt/Equity is total liabilities divided by total shareholders’ capital (equity capital plus reserves)Interest coverage: The interest coverage ratio indicates how comfortably a company can pay interest on its outstanding debt. A high ratio indicates comfort regarding debt, financial stability and flexibility. Interest coverage ratio should be more 5 times.
Formula: Interest coverage ratio is EBIT divided by interest expense(EBIT is Revenues minus cost of goods sold and operating expenses.)
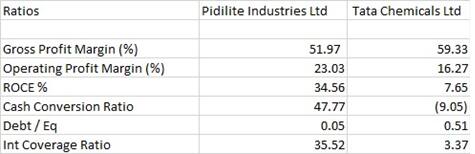
Take a look at the table below which compares two companies (Pidilite Industries with Tata Chemicals) in terms of the above-stated ratios. You will notice that while Tata Chemicals excels in terms of gross profit margin, Pidilite Industries delivers a superior performance in terms of OPM, ROCE and CCR. Additionally, Pidilite has negligible borrowing which gives the company a very comfortable interest coverage ratio as compared to Tata Chemicals. Clearly, these ratios indicate Pidilite to be a better investment option.
Now let’s consider the P/E of Pidilite. If you had invested in this company on 20th March 2015 at a price of Rs 621 when the P/E was at a steep 62.6, and held on to the stock, as on 8th February 2021 (when the price was Rs 1,733 and the P/E was 87.8), you would have earned CAGR returns of 19% (excluding dividends). In 2015, most investors thought that Pidilite was over-priced as indicated by the high P/E and this thinking holds good even today. However, for a company like Pidilite which is a leader in its sector and a growing company, you would earn attractive returns no matter at what P/E you invested in the stock. The only condition is you must hold for the long term (five years and above).
Why P/E ratios don’t matter in quality stocksUnlike in developed markets such as the US, UK, etc., where the top companies are unable to generate high ROCE, in the Indian capital markets, which are relatively nascent and growing, quality stocks have been able to comfortably generate double-digit ROCE over long time periods. However, there are only a small set of such 50-60 high-quality businesses across all market capitalization out of nearly 6000+ listed businesses in the Indian stock markets. Investors who opt to invest in such high-quality stocks (and avoid low-quality stocks that are available for ‘cheap’) will see their wealth grow exponentially over the long term.
Disclaimer: The above stock example is just for illustration and is not a recommendation.
Discover the latest Business News, Sensex, and Nifty updates. Obtain Personal Finance insights, tax queries, and expert opinions on Moneycontrol or download the Moneycontrol App to stay updated!
Find the best of Al News in one place, specially curated for you every weekend.
Stay on top of the latest tech trends and biggest startup news.


