


Given the continuation of higher-high formation for seven days in a row, taking support at 21-day EMA (exponential moving average of 21,875 and holding the upward sloping support trendline, the positive bias may sustain in the market in the coming days, barring intermittent consolidation. Hence, the Nifty 50 may make an up-move towards 22,300 on an immediate basis and then to 22,500 level, with support at 22,000 and then at 21,875, the low of Thursday, experts said.
On February 22, the Nifty 50 rallied 163 points to end at a record closing high of 22,218 and formed a bullish candlestick pattern with long lower shadow on the daily charts, while the BSE Sensex was up 535 points at 73,158.
The broader markets also traded higher with the Nifty Midcap 100 and Smallcap 100 rising 1 percent and 0.7 percent, respectively.
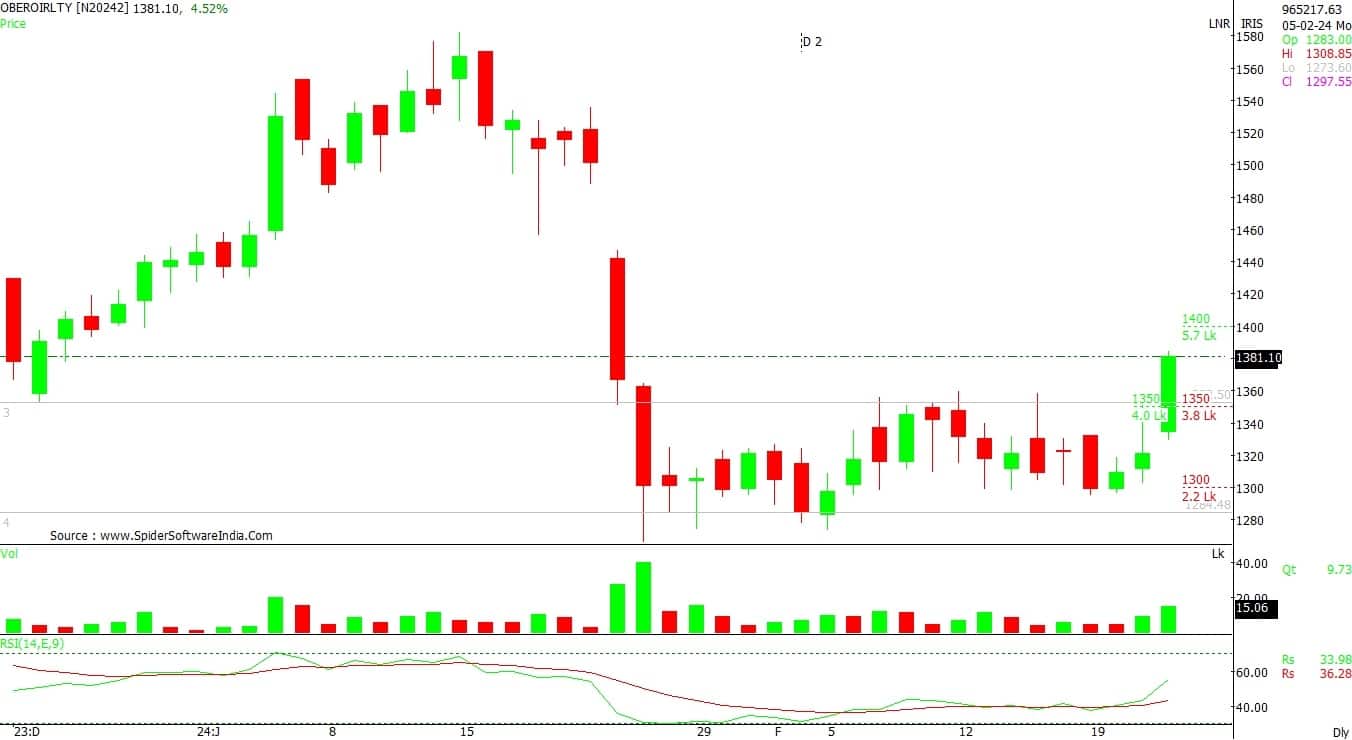
Stocks that reported better performance than the broader markets included Oberoi Realty, Indian Hotels, and Bharat Electronics. Oberoi Realty has seen a consolidation breakout and climbed 4.3 percent to Rs 1,378 on the NSE. The stock has formed bullish candlestick pattern on the daily charts with above average volumes, and now traded above all key moving averages.
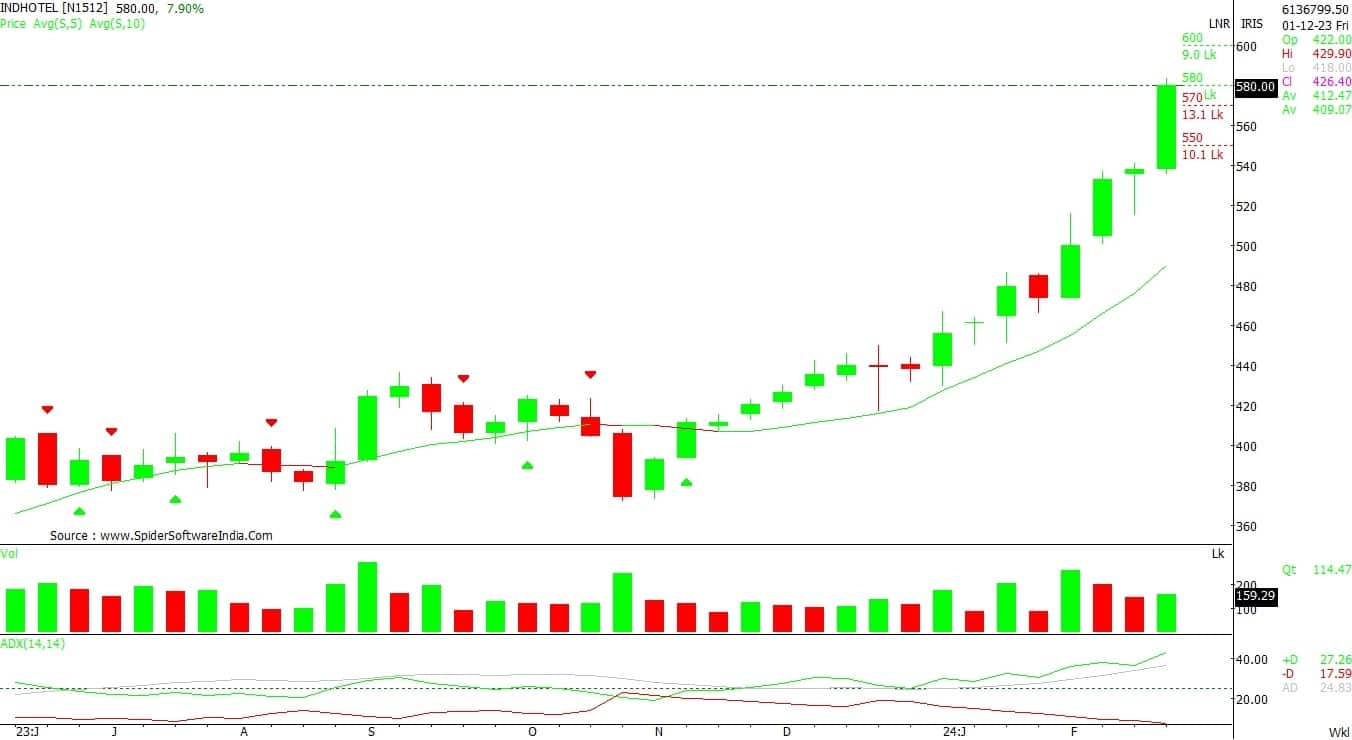
Indian Hotels continued its upward journey five days in row and hit a new closing high of Rs 579, up 4 percent. The stock has formed long bullish candlestick pattern on the daily scale with robust volumes, and traded way above all key moving averages.
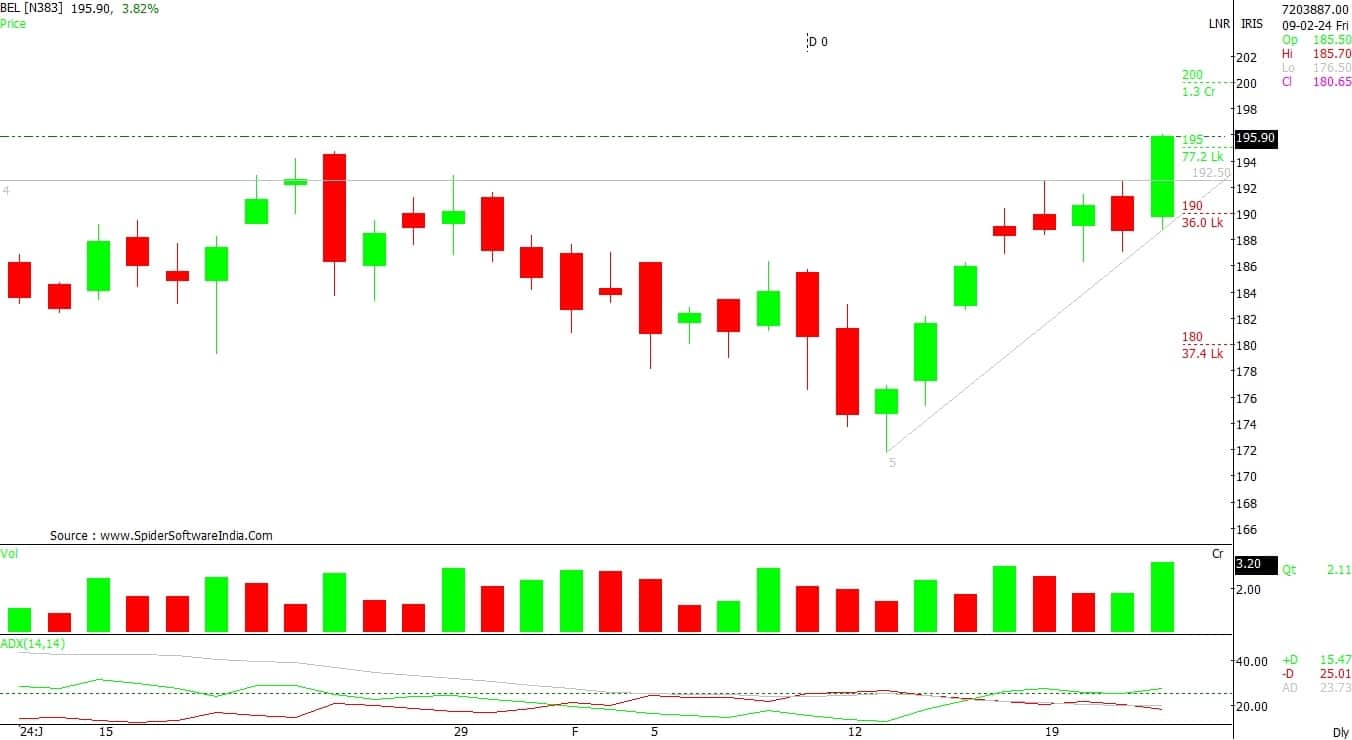
Bharat Electronics, after several days of consolidation, hit a new closing high of Rs 194.75, up 3.2 percent. The stock has seen bullish candlestick pattern formation with health volumes and now traded above all key moving averages from the last one week.
Here's what Shrikant Chouhan of Kotak Securities recommends investors should do with these stocks when the market resumes trading today:Oberoi RealtyOn the daily charts, the counter was into a rangebound mode from the past few sessions. Eventually, it has given the range breakout and it has formed higher bottom series. Therefore, the closing above the resistance line indicates further bullish momentum to continue from the current levels.
For the trend following traders, Rs 1,330 would act as support level. Above the same, it could move up to Rs 1,480 levels.
On the weekly scale, the counter is into a rising channel chart formation with higher high and higher low series pattern. The technical indicators like ADX (average directional index) is also indicating further up trend from current levels, which could boost the bullish momentum in coming horizon.
As long as the stock is trading above Rs 560 the uptrend formation is likely to continue. Above which, the counter could move up to Rs 620. On the flip side, fresh sell off possible only after dismissal of Rs 560.
The stock has given a breakout of its Ascending Triangle chart pattern on the weekly scale. Additionally, it has formed a higher bottom formation along with incremental volume activity, hence the structure of the stock indicates the beginning of a new up move from the current levels.
For positional traders, Rs 189 would be the trend decider level. Trading above the same uptrend formation will continue till Rs 210. However, if it closes below Rs 189, traders may prefer to exit from trading long positions.
Discover the latest Business News, Sensex, and Nifty updates. Obtain Personal Finance insights, tax queries, and expert opinions on Moneycontrol or download the Moneycontrol App to stay updated!
Find the best of Al News in one place, specially curated for you every weekend.
Stay on top of the latest tech trends and biggest startup news.


