


The benchmark indices finished moderately lower on December 24, continuing consolidation for another session. Market breadth turned negative, with about 1,676 shares declining against 1,169 advancing shares on the NSE. Further minor consolidation is expected to continue in the upcoming sessions before the market enters a fresh leg of the upmove. Below are some short-term trading ideas to consider:
Nilesh Jain, Head – Technical and Derivatives Research Analyst (Equity Research) at Centrum Broking
GMDC | CMP: Rs 545.65
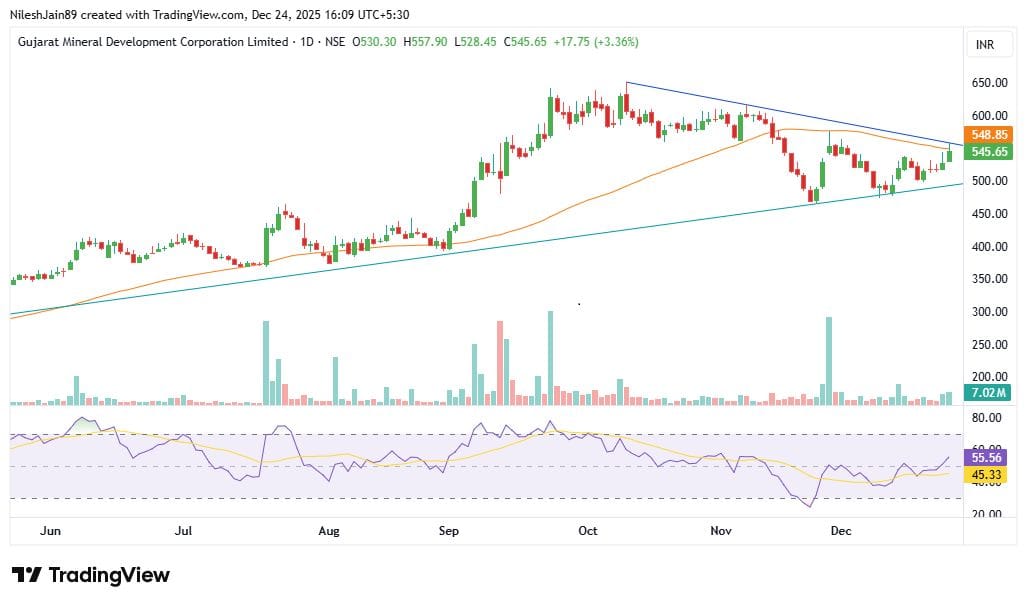
Gujarat Mineral Development Corporation (GMDC) is nearing a breakout from a symmetrical triangle pattern on the daily chart. The immediate resistance is at the 50-day moving average around Rs 548, and a decisive move above this level would confirm the breakout and likely lead to further upside.
Momentum indicators are also supportive, with the RSI rising above 55 and the MACD showing a bullish crossover, indicating strengthening upward momentum. Overall, the technical structure suggests the stock is well positioned for a move toward the Rs 610 level, while immediate support is seen near Rs 511.
Strategy: Buy
Target: Rs 610
Stop-Loss: Rs 511
Titagarh Rail Systems | CMP: Rs 854.6
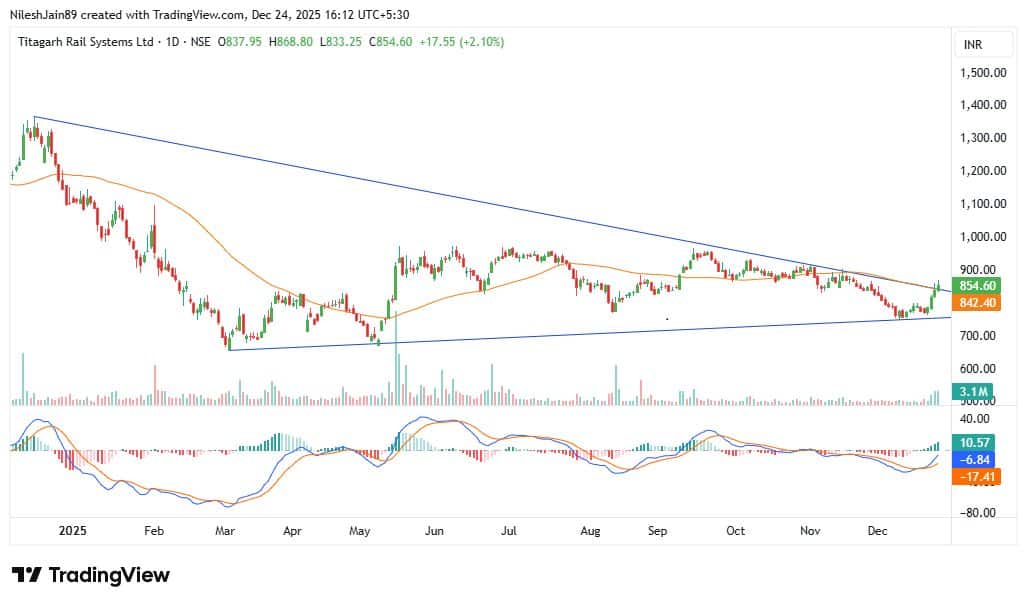
Titagarh Rail Systems has registered a multi-month breakout above a falling trendline near the Rs 850 level and has closed decisively above it. This breakout was supported by higher-than-average volumes, strengthening the bullish view.
Additionally, the price has moved above the 200-day moving average, also placed around Rs 850. A fresh bullish crossover on the MACD indicates improving momentum. On the downside, immediate support is located near the 21-day moving average around Rs 800. With these technical factors in place, the stock appears well positioned to advance toward the Rs 950 level in the near term.
Strategy: Buy
Target: Rs 950
Stop-Loss: Rs 800
Sudeep Shah, Head - Technical and Derivatives Research at SBI Securities
PNB Housing Finance | CMP: Rs 966.3
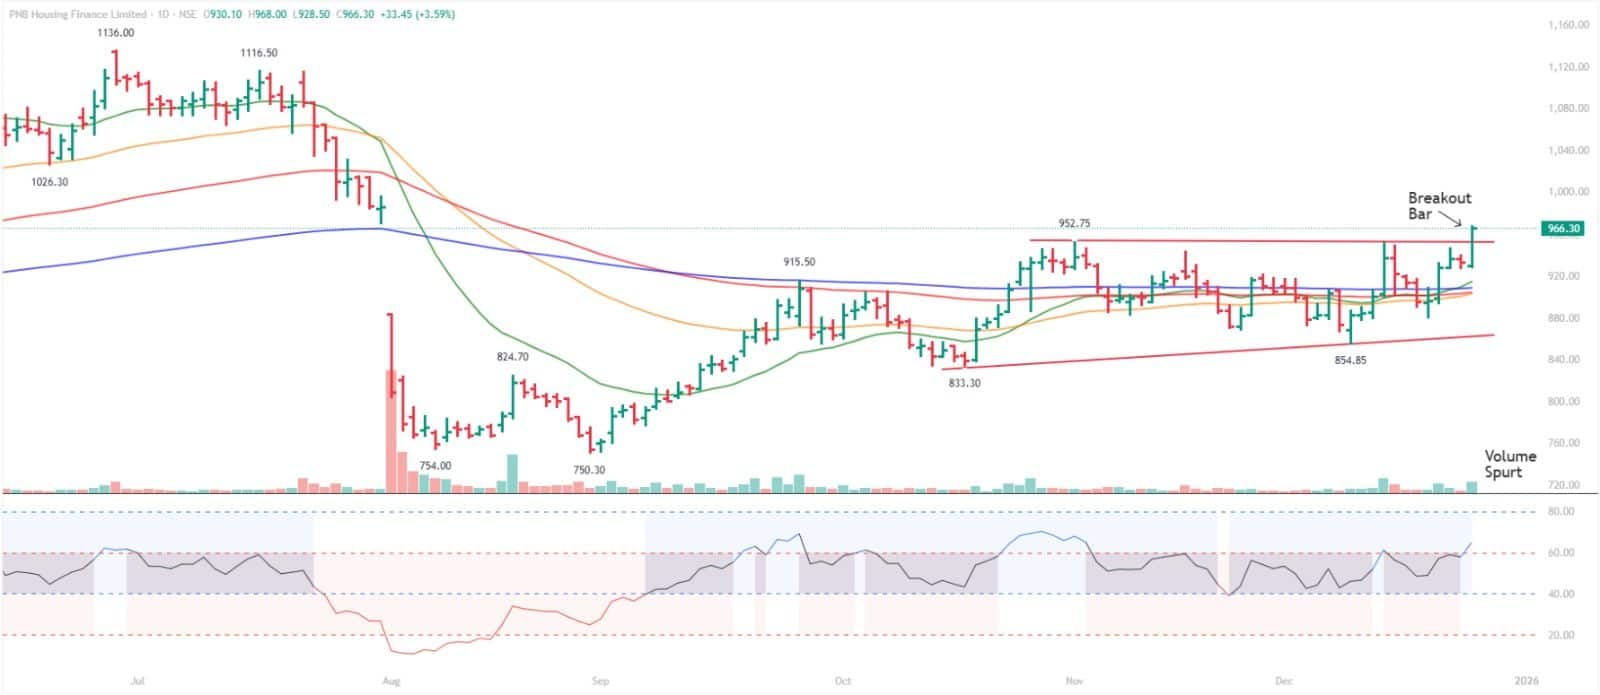
PNB Housing has delivered a breakout above its horizontal trendline resistance on the daily chart, supported by a healthy rise in volumes, signalling strong participation and conviction behind the move. The stock has also successfully filled the sharp 88-point gap created on August 1, 2025, strengthening the bullish structure.
Momentum indicators remain firmly supportive. The RSI is in a rising mode and sustaining above the 60 mark, indicating strong bullish momentum and buying strength. The ADX has started to rise, suggesting an improvement in trend strength. Meanwhile, the MACD is well above the signal and zero lines, with expanding green histogram bars, confirming accelerating upside momentum.
Overall, the technical setup remains decisively bullish. Hence, accumulation is recommended in the Rs 970–960 zone.
Strategy: Buy
Target: Rs 1,040
Stop-Loss: Rs 925
Indus Towers | CMP: Rs 423.9
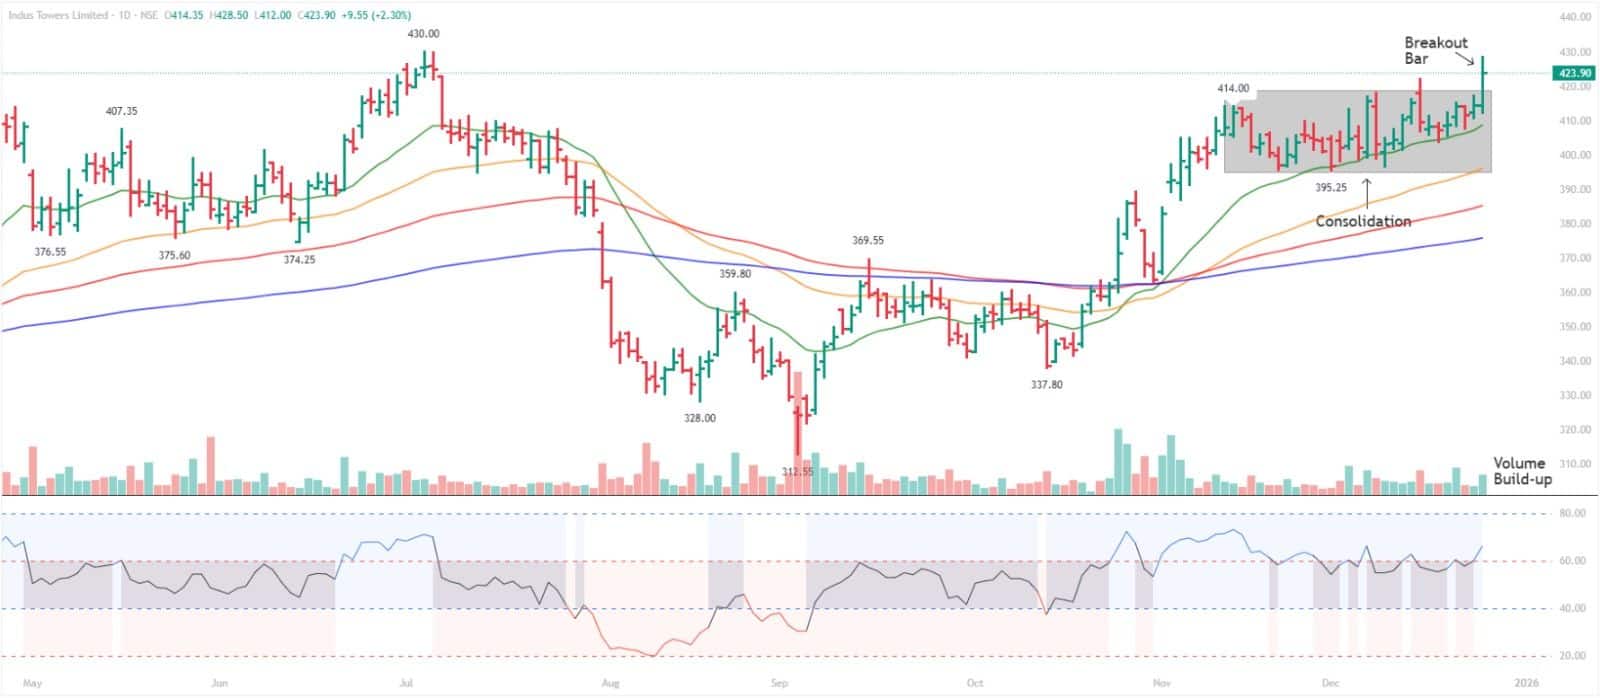
Indus Towers has delivered a consolidation breakout on the daily chart. Since the beginning of December, the stock has consistently held above its 20-day EMA, which continues to act as a strong dynamic support, reflecting sustained buying interest on dips. On the momentum front, the RSI has broken above its downward-sloping trendline, indicating a fresh pickup in bullish momentum.
Additionally, the widening gap between the DI lines, along with a rising ADX, points to strengthening trend strength and improving directional clarity. Overall, the technical structure remains constructive, with the breakout supported by improving momentum and trend indicators. Accumulation is recommended in the Rs 424–420 zone with a stop-loss at Rs 405. On the upside, the stock is likely to test the Rs 460 level in the short term.
Strategy: Buy
Target: Rs 460
Stop-Loss: Rs 405
Rupak De, Senior Technical Analyst at LKP Securities
Vedanta | CMP: Rs 598.15
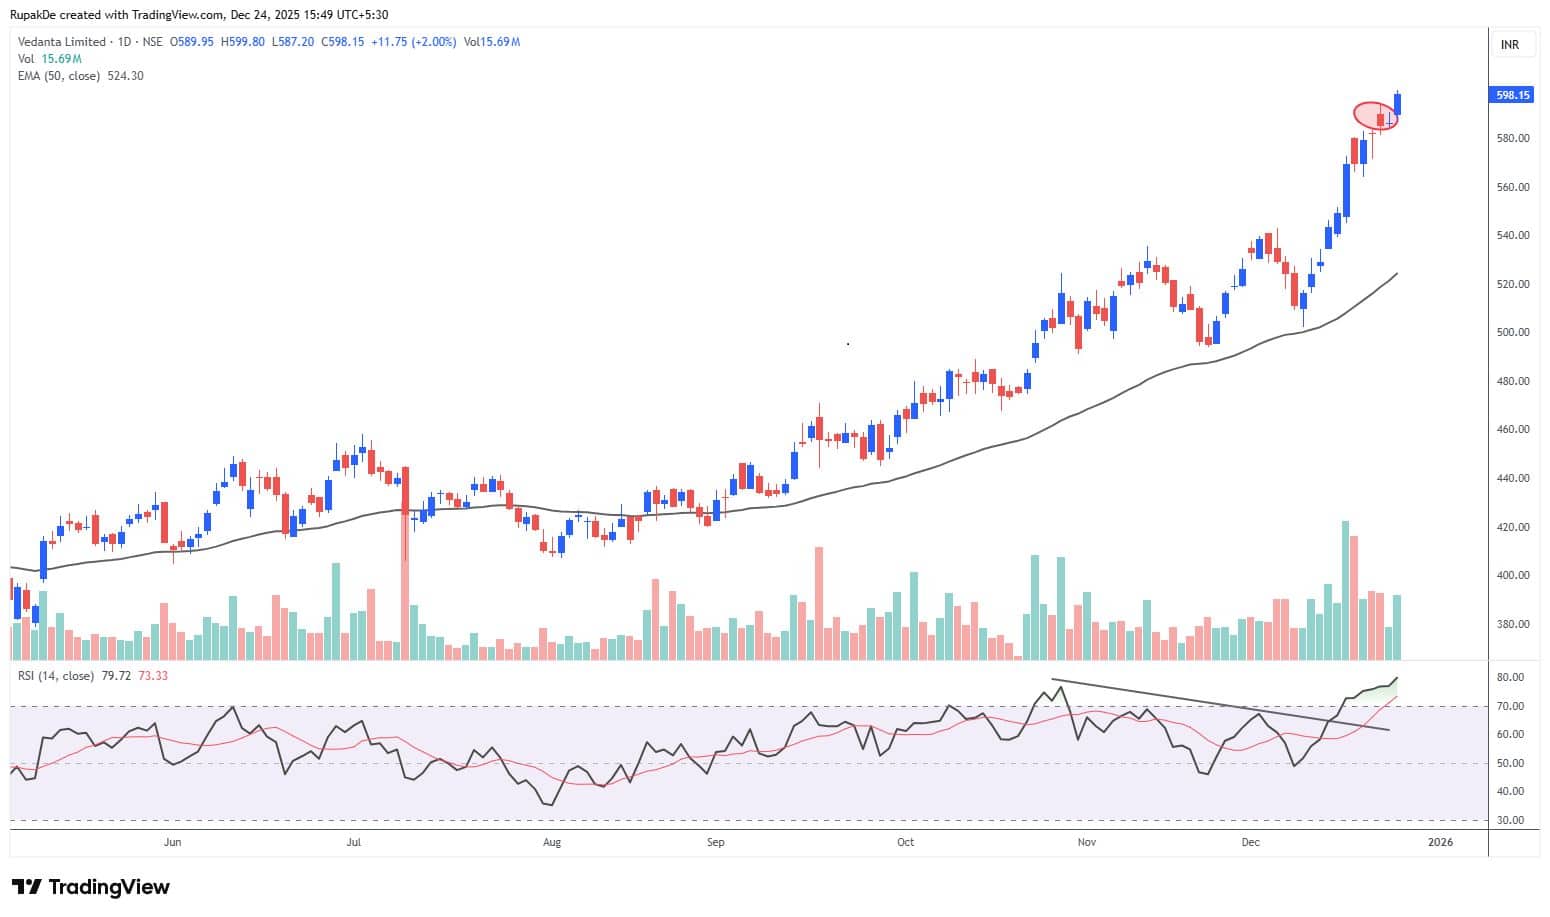
Vedanta has formed a doji reversal pattern on the daily timeframe, indicating a breakout after a brief pause. Moreover, the price is comfortably trading above the 21-day EMA on the daily chart, confirming an ongoing positive trend.
The RSI is in a bullish crossover and positioned in a strong momentum zone. The positive sentiment is likely to persist, with potential upside toward Rs 630, while support is placed at Rs 584.
Strategy: Buy
Target: Rs 630
Stop-Loss: Rs 584
Chambal Fertilisers and Chemicals | CMP: Rs 473.5
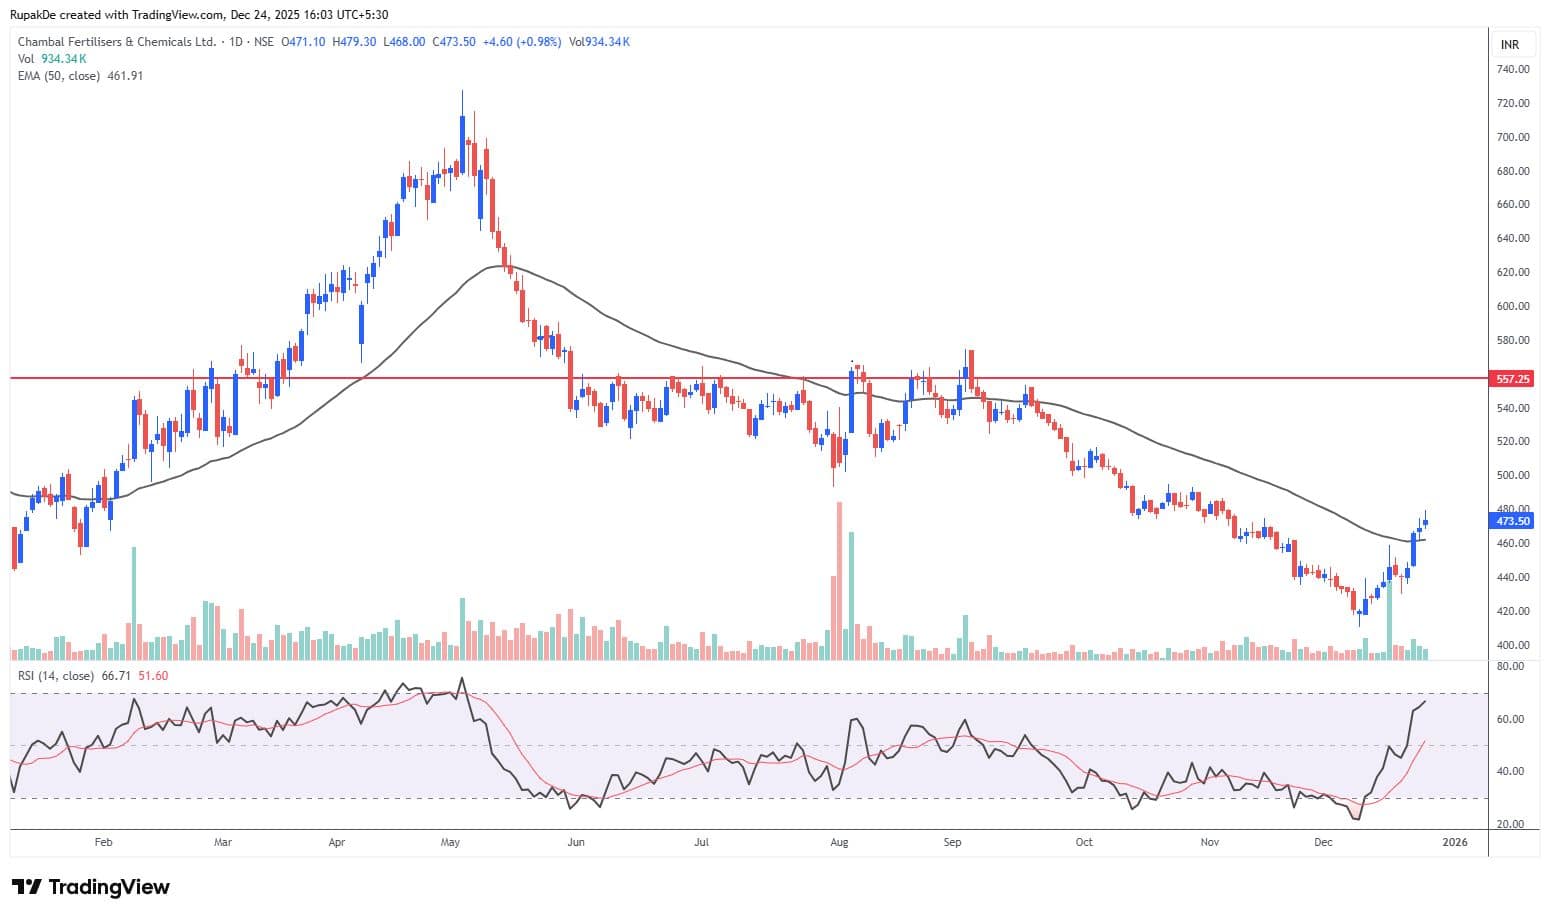
Chambal Fertilisers is showing signs of emerging from bearish control. The stock has delivered a consolidation breakout and moved above the 21-day EMA on the daily timeframe after an extended period. The RSI is in a bullish crossover and trending higher, indicating improving momentum.
In the short term, the trend is expected to remain positive, with the possibility of a move toward Rs 500. On the downside, support is placed at Rs 458.
Strategy: Buy
Target: Rs 500
Stop-Loss: Rs 458
Hitesh Tailor, Technical Research Analyst at Choice Broking
Berger Paints India | CMP: Rs 555.15
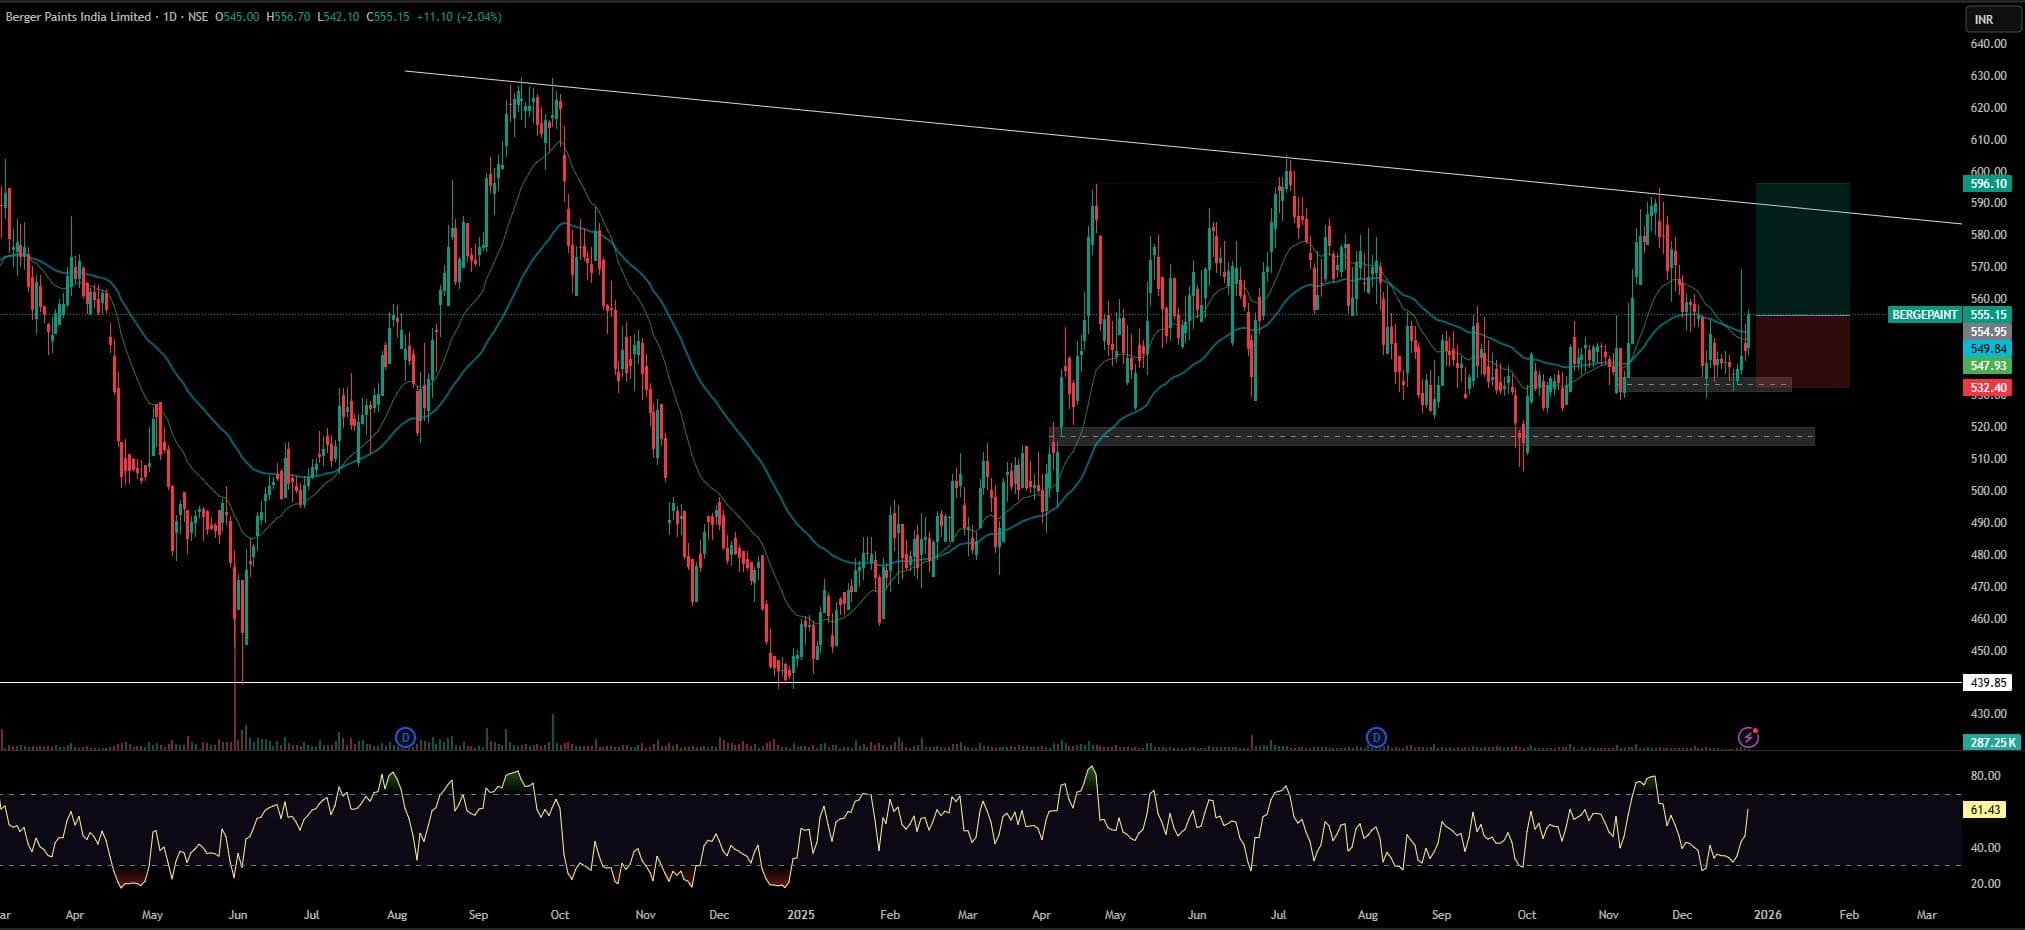
Berger Paints is showing clear signs of strength after undergoing a healthy accumulation phase near its previous swing bottom. This price behaviour suggests that selling pressure has been absorbed and fresh buying interest is emerging at lower levels. The stock’s ability to stabilise and move higher from this base reflects improving sentiment and indicates that the corrective phase may be nearing completion.
From a technical standpoint, Berger Paints continues to trade comfortably above its key 20-day, 50-day, and 200-day EMAs, reinforcing the positive underlying trend and confirming that the broader structure remains bullish. On the downside, immediate support is placed around Rs 540, a zone where accumulation has been observed earlier. This level is likely to act as a strong demand area, and any minor dips toward this region may attract fresh buying interest, keeping the overall bias constructive.
On the upside, immediate resistance is seen in the Rs 560–565 range. A decisive breakout and sustained move above this resistance band would indicate a continuation of the uptrend and open the door for further upside. Momentum indicators also support this view, with the RSI currently at 61.43, suggesting healthy bullish momentum with room for expansion.
Strategy: Buy
Target: Rs 600
Stop-Loss: Rs 530
City Union Bank | CMP: Rs 296.05
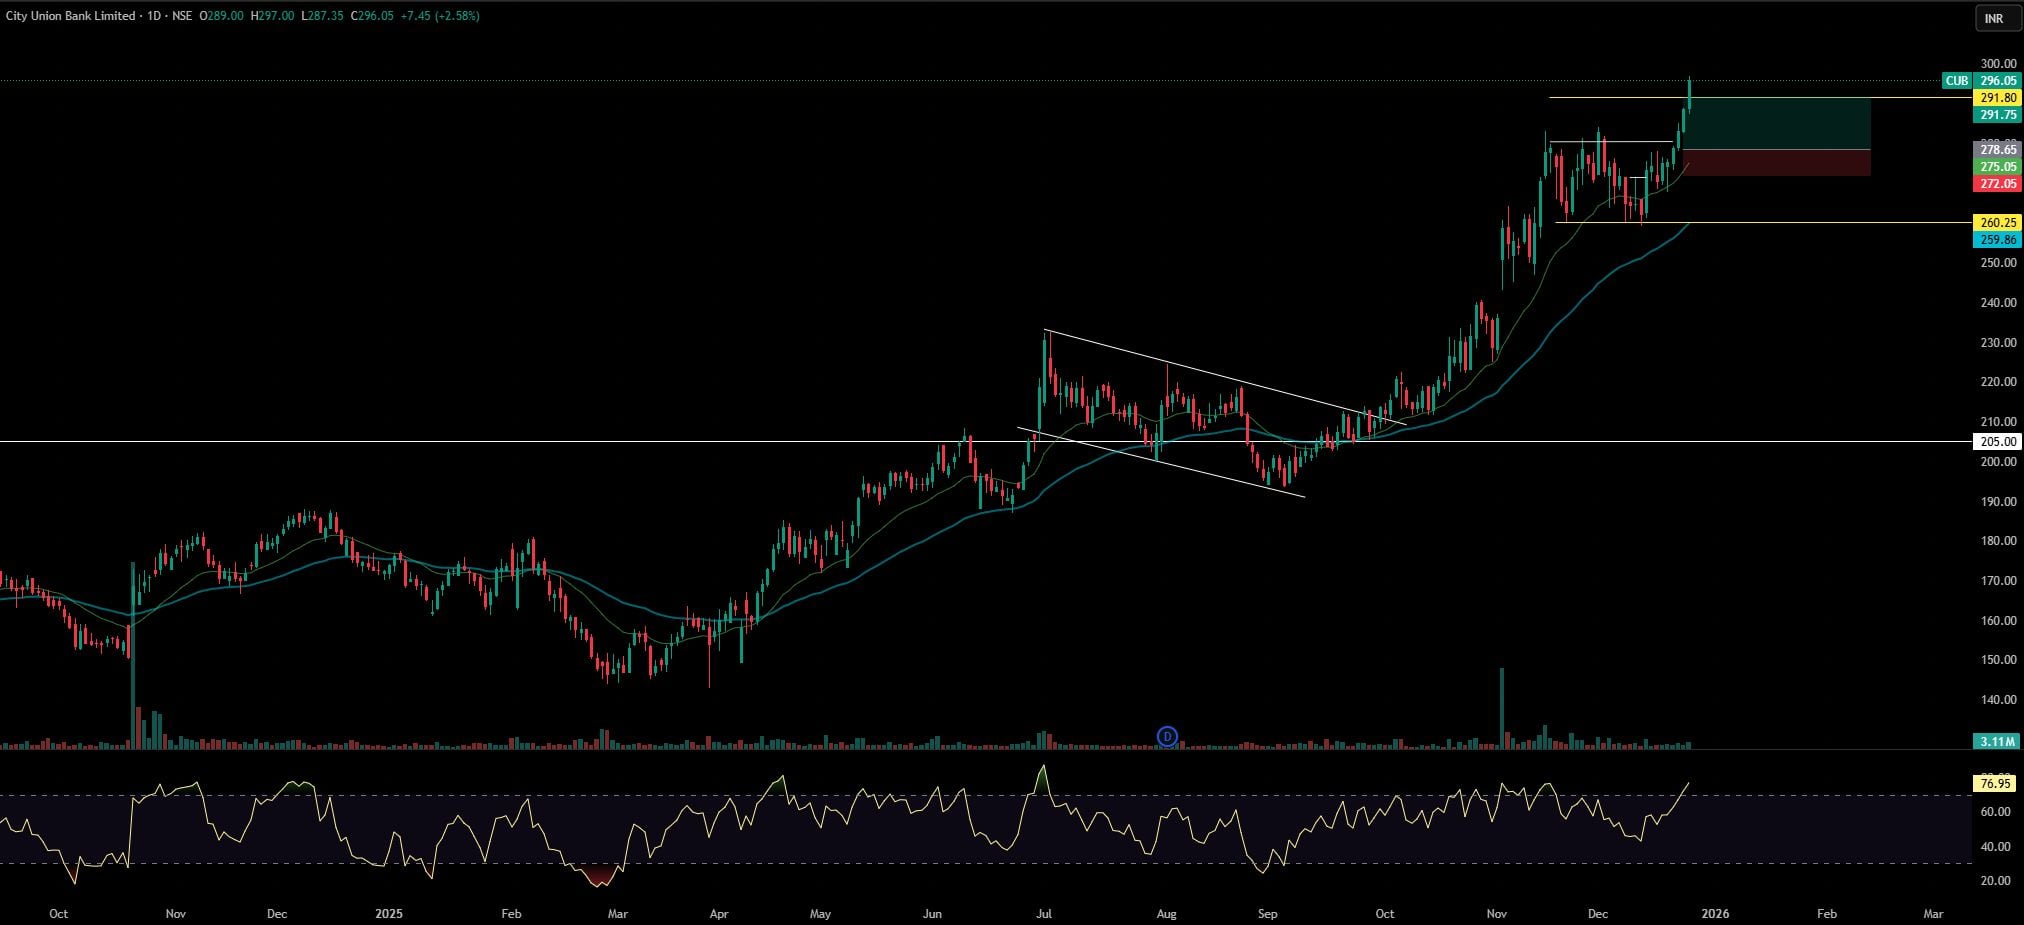
City Union Bank continues to show a strong upward trend, supported by steady buying interest and sustained higher price action. After retesting its earlier higher levels, the stock has resumed its upward move and registered a fresh all-time high near Rs 297, reflecting renewed confidence among market participants. The overall price structure remains positive, with consistent bullish candles and rising volumes confirming healthy momentum.
The stock is trading well above its key moving averages — the 20-day, 50-day, 100-day, and 200-day EMAs — all of which are sloping upward, indicating a strong and stable trend.
The Relative Strength Index (RSI) is around 70.5 and trending higher, suggesting continued buying strength. Immediate support is placed near Rs 288. A sustained close above the Rs 286 level could open the door for further upside, with a near-term target of Rs 322.
Strategy: Buy
Target: Rs 322
Stop-Loss: Rs 283
Jyoti CNC Automation | CMP: Rs 990.6
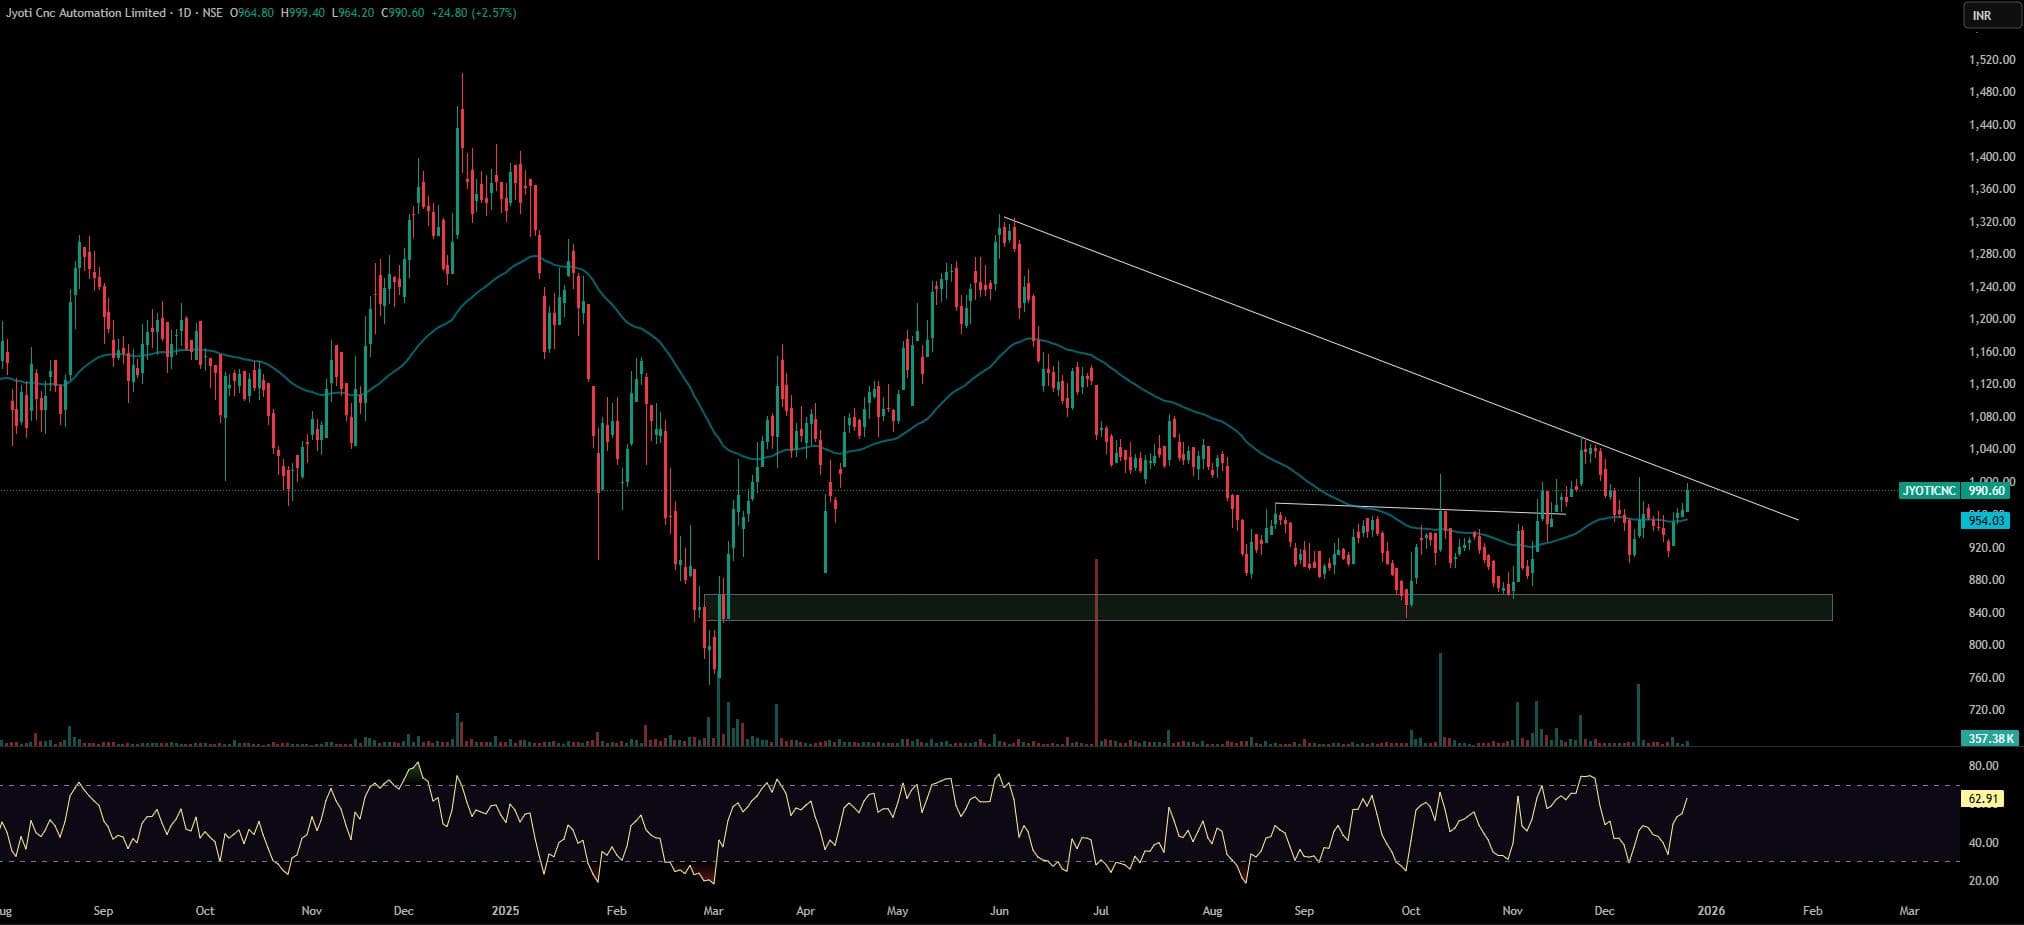
Jyoti CNC Automation has witnessed a strong rebound from its recent lows, forming a double-bottom pattern. This formation is a classic bullish signal, indicating a potential trend reversal and suggesting that the stock has established a strong base for a possible upward move.
The stock is trading above its 20-day, 50-day, and 100-day Exponential Moving Averages and is now approaching the 200-day EMA. A decisive close above the 200-day EMA would further confirm a shift in the broader trend and strengthen the bullish outlook. The successful reclaiming of these key moving averages highlights improving momentum and growing bullish sentiment.
On the upside, the next key resistance is placed at Rs 1,000. A sustained and decisive move above this level could open the path for a short-term upside target of Rs 1,073. On the downside, immediate support is seen near Rs 965, which is expected to act as a strong demand zone. The Relative Strength Index (RSI) stands at 58.03 and is trending upward, indicating increasing buying momentum without entering overbought territory.
Strategy: Buy
Target: Rs 1,073
Stop-Loss: Rs 954
Disclaimer: The views and investment tips expressed by experts on Moneycontrol are their own and not those of the website or its management. Moneycontrol advises users to check with certified experts before taking any investment decisions.Discover the latest Business News, Sensex, and Nifty updates. Obtain Personal Finance insights, tax queries, and expert opinions on Moneycontrol or download the Moneycontrol App to stay updated!
Find the best of Al News in one place, specially curated for you every weekend.
Stay on top of the latest tech trends and biggest startup news.


