


Equity benchmarks - Nifty 50 and BSE Sensex - outperformed the Bank Nifty and closed the session higher on May 22, with approximately 1,146 equity shares declining and 1,107 shares advancing on the NSE. Despite elevated volatility, the market is expected to maintain an upward journey in the coming sessions, along with intermittent consolidation. Here are some trading ideas for the near term.
Vidnyan Sawant, HOD - Research at GEPL CapitalHEG | CMP: Rs 2,687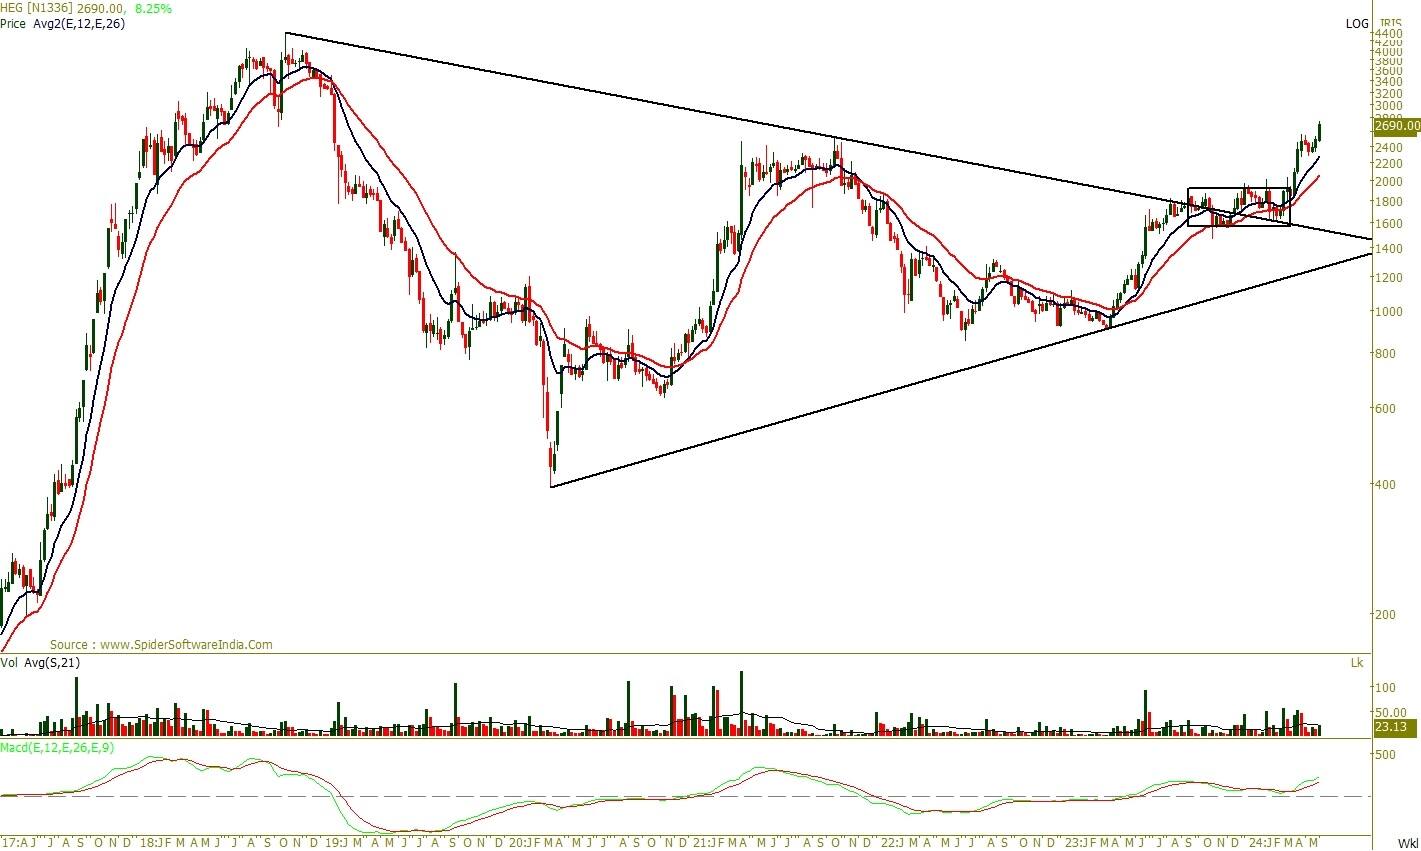
HEG has displayed a robust price structure following a breakout from a 7-month congestion zone in April 2024. Since then, the stock has consistently shown upward movement. Recently, it witnessed a breakout from a 4-week inside bar pattern, continuing its upward trajectory.
Despite current market turbulence, HEG has managed to sustain above its key 20-day EMA (exponential moving average), showcasing high relative strength.
The stock is trading above key 12-week and 26-week moving averages, indicating a positive trend. Furthermore, the MACD (Moving Average Convergence Divergence) study shows rising momentum in positive territory, reinforcing the trend's strength.
Looking ahead, we anticipate further upward movement in prices, targeting a level around Rs 3,282. However, it's essential to monitor the Rs 2,474 level closely; sustained price action below this point could invalidate the bullish outlook.
Strategy: Buy
Target: Rs 3,282
Stop-Loss: Rs 2,474
Coal India | CMP: Rs 502
Coal India's price structure displays resilience, with a clear uptrend since October 2020, consistently forming higher highs and higher lows.
On a weekly scale, the stock demonstrates notable relative strength compared to the broader market. This week, it broke out of a 14-week consolidation, indicating a continuation of its rising trend.
The stock has well sustained above key averages like the 12-week and 26-week EMA, denoting a bullish trend. The RSI shows a bullish cross and stands at 70, indicating robust bullish momentum.
Looking forward, we anticipate further upward movement in prices, with a target level around Rs 586. However, it's essential to monitor Rs 461 levels closely; sustained price action below this point could invalidate the bullish outlook.
Strategy: Buy
Target: Rs 586
Stop-Loss: Rs 461
Olectra Greentech | CMP: Rs 1,794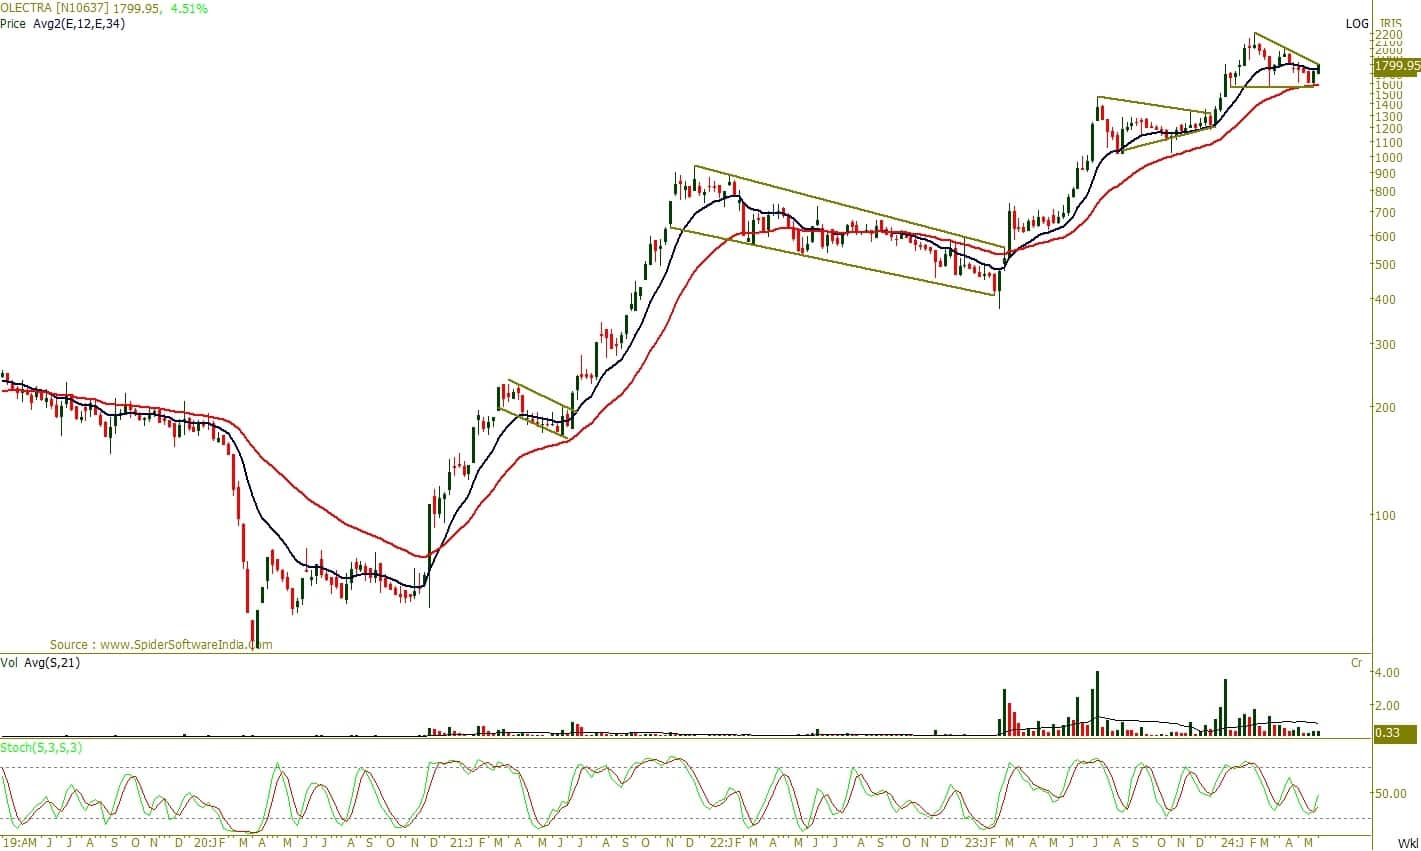
Since its 2020 low, the stock has exhibited a classic technical uptrend, consistently forming a classical upward structure. Following each rally, the stock has undergone healthy retracements, and subsequent breakouts have continued to drive rising momentum.
Zooming in on recent price action, the stock is on the verge of a triangular pattern breakout. Its recovery from a triple bottom formation on the daily chart indicates an improvement in the trend.
On the weekly scale, the stock has been forming a base near the 34-week EMA. Additionally, the stochastic study shows a positive cross, denoting bullish momentum.
Looking ahead, we anticipate continued upward movement in the stock, with a potential target price of Rs 2,160. To manage risk effectively, it's advisable to set a stop-loss at Rs 1,656 on a closing basis.
Strategy: Buy
Target: Rs 2,160
Stop-Loss: Rs 1,656
General Insurance Corporation of India | CMP: Rs 379.3
General Insurance Corporation of India (GICRE) has been in a significant uptrend since reaching a low in March 2023. The stock experienced a breakout from a saucer pattern, which had been forming since October 2019, with volume confirmation. It hit a multi-year high at Rs 467 in February 2024, followed by a correction to Rs 310, where it established a Change in Polarity (CIP) formation, signaling a strong bullish undertone for the medium to long term.
In the most recent week, GICRE broke out of a ten-week consolidation and remained above its 20-week SMA, affirming the strength of the uptrend. Rising volumes on every positive move suggest strong participation in the bullish trend.
Additionally, the momentum indicator, RSI, is sustaining above 60 and moving upward on the weekly charts, indicating a trend supported by momentum.
Looking ahead, further upward movement in prices is anticipated, targeting around Rs 465. However, it's crucial to monitor Rs 320 levels closely, as sustained price action below this point could invalidate the bullish outlook.
Strategy: Buy
Target: Rs 465
Stop-Loss: Rs 320
Shitij Gandhi, Senior Research Analyst (Technicals) at SMC GlobalCipla | CMP: Rs 1,482.3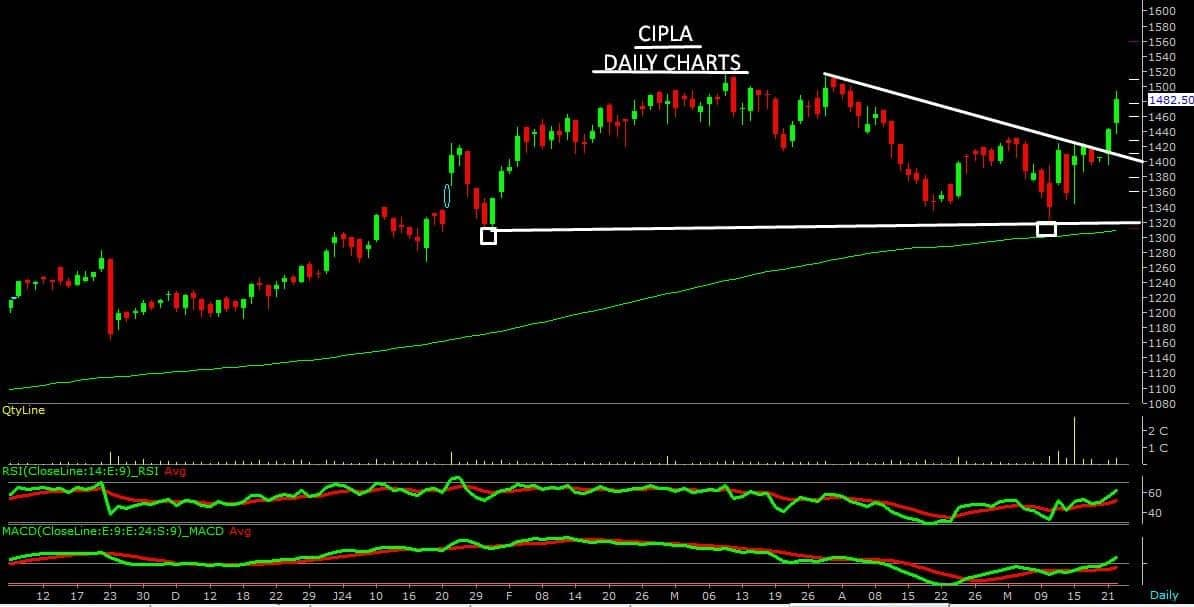
Cipla has been seen trading in a downward-sloping channel and managed to find support near its 200-day exponential moving average (DEMA) on daily charts. The stock formed a Double Bottom pattern around Rs 1,330 levels, indicating a resurgence of bullish momentum thereafter. At the current juncture, the stock has given a fresh breakout above its declining channel. The rise in volumes, along with price action, suggests further upside potential for the stock. Therefore, one can buy/hold/accumulate the stock for the expected upside target of Rs 1,580-1,600 levels, with a downside support zone of Rs 1,440-1,450 levels.
Strategy: Buy
Target: Rs 1,580, 1,600
Stop-Loss: Rs 1,380
Cholamandalam Investment and Finance Company | CMP: Rs 1,270
In the last three months, Cholamandalam Investment has staged an impressive recovery from its 52-week low, experiencing a remarkable rally from Rs 1,000 levels to reach a 52-week high of Rs 1,352.60 in a short span. However, it recently underwent a correction phase over the past two weeks, retracing to around Rs 1,230 levels due to profit booking.
Nevertheless, there has been a recent breakout above the symmetrical triangle pattern on the daily charts, indicating renewed momentum. With rising volumes and positive divergences on secondary oscillators, the stock is poised for further upside. Therefore, one can buy/hold/accumulate the stock for the expected upside target of Rs 1,420-1,425 levels, with a downside support zone of Rs 1,240-1,230 levels.
Strategy: Buy
Target: Rs 1,400, 1,425
Stop-Loss: Rs 1,175
Divi's Laboratories | CMP: Rs 4,058.55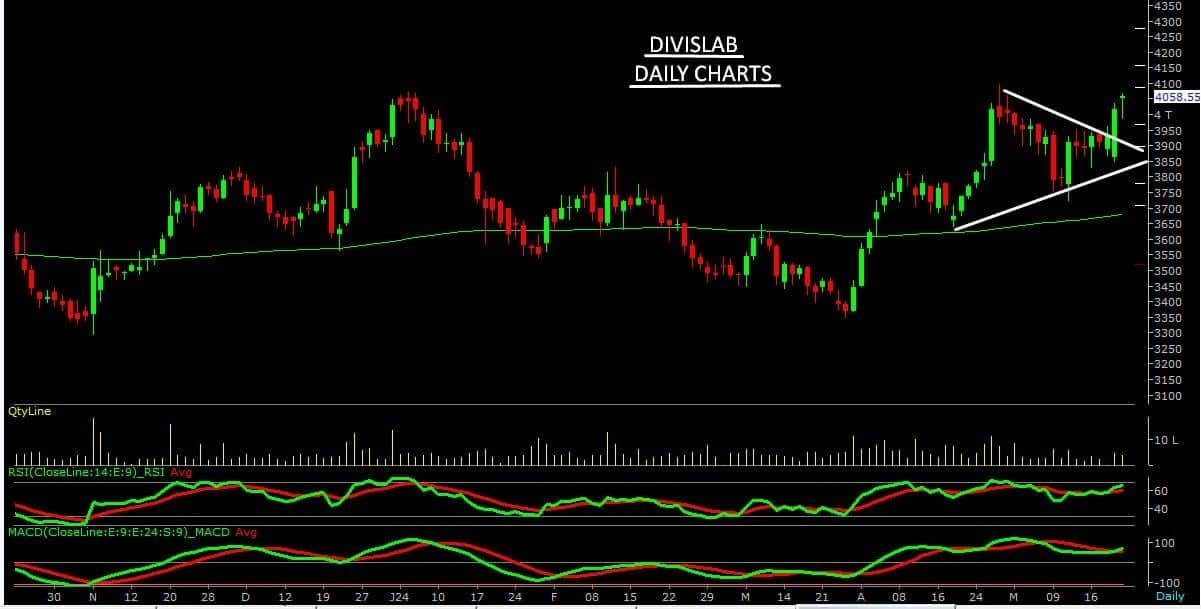
Following a bounce off its 200-day exponential moving average (DEMA) on the daily chart, Divis Labs displayed a notable resurgence, surging from Rs 3,650 to Rs 4,100 within a brief period. Nonetheless, profit-taking activities caused the stock to retrace towards the Rs 3,750 mark in recent times, initiating a consolidation phase.
Presently, the stock has marked a fresh breakout above the symmetrical triangle pattern on the daily timeframe, complemented by positive divergences observed on secondary oscillators. Therefore, one can buy/hold/accumulate the stock for the expected upside target of Rs 4,450-4,500 levels, with a downside support zone of Rs 3,980-4,000 levels.
Strategy: Buy
Target: Rs 4,450/4,500
Stop-Loss: Rs 3,800
Kunal Shah, Senior Technical & Derivative Analyst at LKP SecuritiesInfosys | CMP: Rs 1,454.8
Infosys is on the verge of a breakout from a significant consolidation phase, with notable buying observed at lower levels within this phase. It has surpassed its short-term moving average of 20DMA with volumes, confirming a bullish undertone. The stock is likely to test its 20DMA, placed at Rs 1,500, and a sustained move above this level can open the gates for further upside.
Strategy: Buy
Target: Rs 1480, 1,510
Stop-Loss: Rs 1,420
Emami | CMP: Rs 535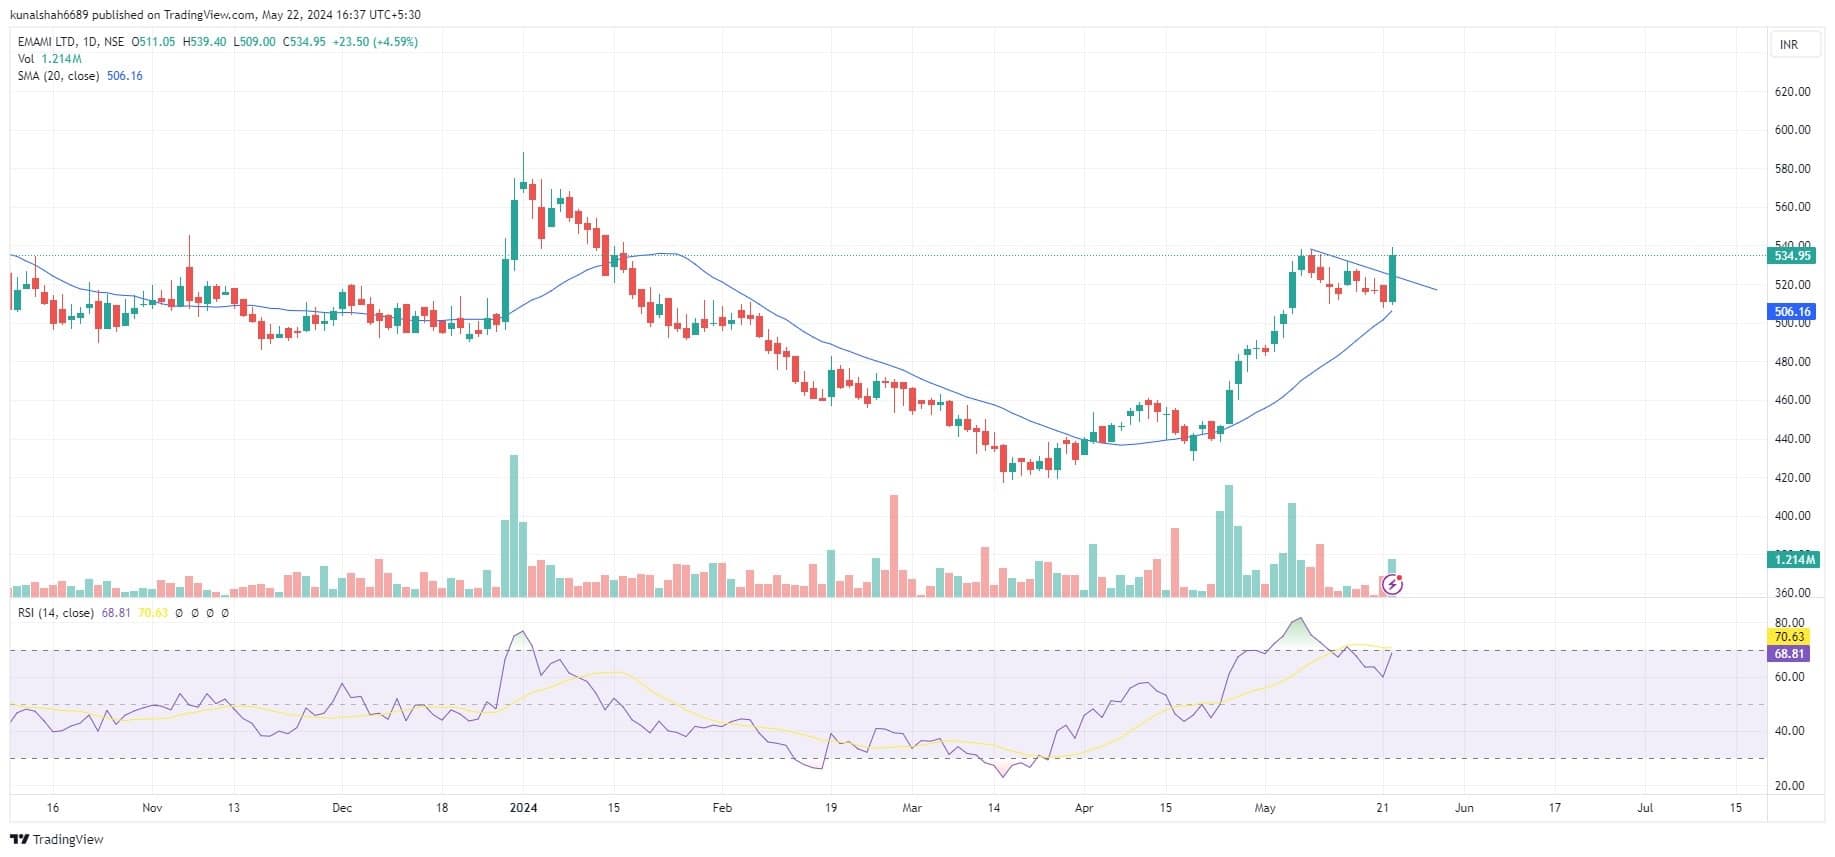
Emami has formed a Bullish Flag and Pole pattern on the daily chart, confirming a bullish setup. The momentum indicator RSI has given a positive crossover above the level of 60, reinforcing the buy signal. Additionally, the stock has surpassed its 20DMA with increased volumes, indicating active and dominant buyers.
Strategy: Buy
Target: Rs 560, 580
Stop-Loss: Rs 500
Disclaimer: The views and investment tips expressed by investment experts on Moneycontrol.com are their own and not those of the website or its management. Moneycontrol.com advises users to check with certified experts before taking any investment decisions.Discover the latest Business News, Sensex, and Nifty updates. Obtain Personal Finance insights, tax queries, and expert opinions on Moneycontrol or download the Moneycontrol App to stay updated!
Find the best of Al News in one place, specially curated for you every weekend.
Stay on top of the latest tech trends and biggest startup news.