


Equity benchmark indices gained 0.5 percent on July 21 following a couple of days of correction, but the market breadth was slightly in favour of bears. A total of 1,392 shares declined compared to 1,295 advancing shares on the NSE. The continuation of the northward journey is possible only if the market posts a strong close above the 20-day EMA. Below are some short-term trading ideas to consider:
Jigar S Patel, Senior Manager - Equity Research at Anand Rathi
Hero MotoCorp | CMP: Rs 4,408.2
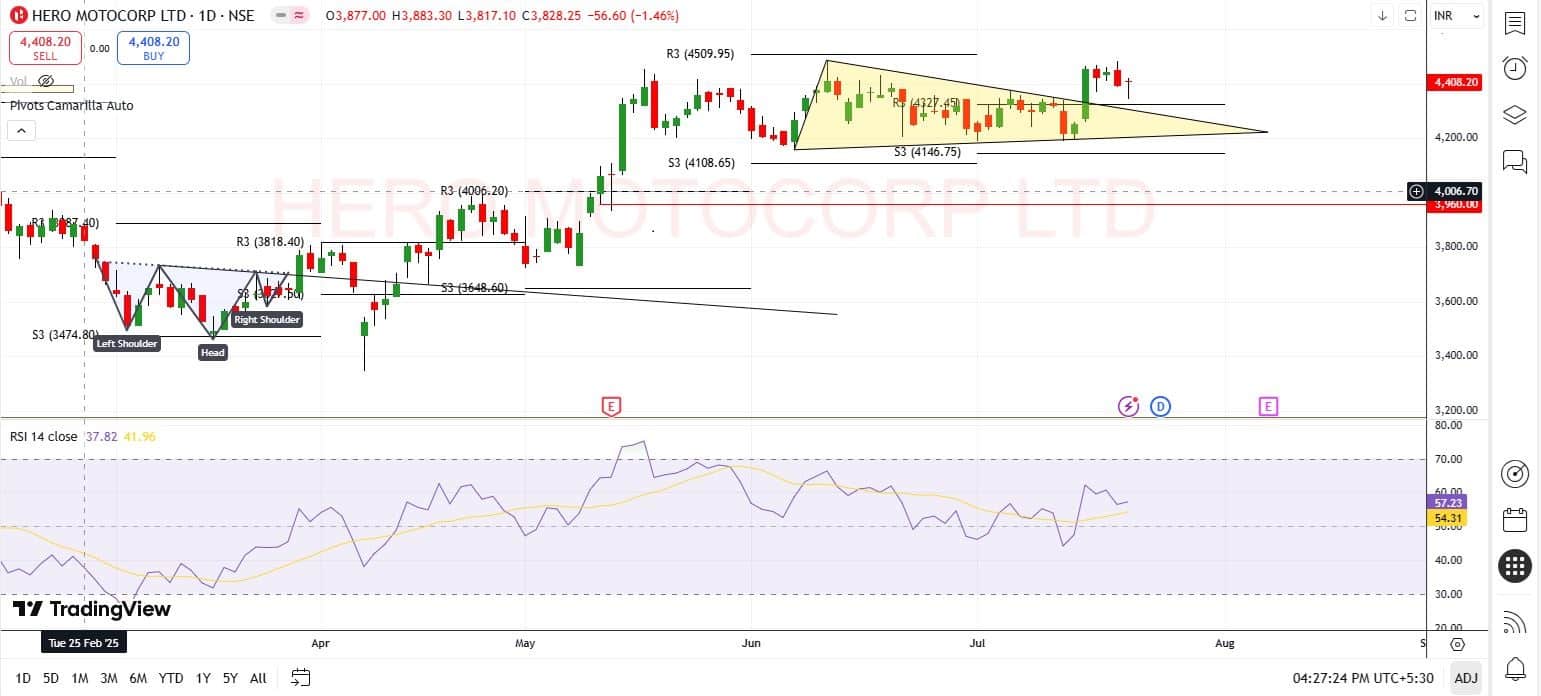
Hero MotoCorp recently consolidated within a tight range of Rs 4,150–4,375, forming a classic triangle pattern on the charts. On July 15, the stock broke out decisively from this formation, accompanied by a significant rise in volume, confirming the validity of the breakout. This technical strength is further supported by the Camarilla monthly pivot structure, which displayed an inside value relationship — a setup that often precedes sharp directional moves. The confluence of these factors suggests strong bullish potential in the near term. Traders may consider entering long positions in the Rs 4,420–4,380 zone.
Strategy: Buy
Target: Rs 4,800
Stop-Loss: Rs 4,200
Varun Beverages | CMP: Rs 489.3
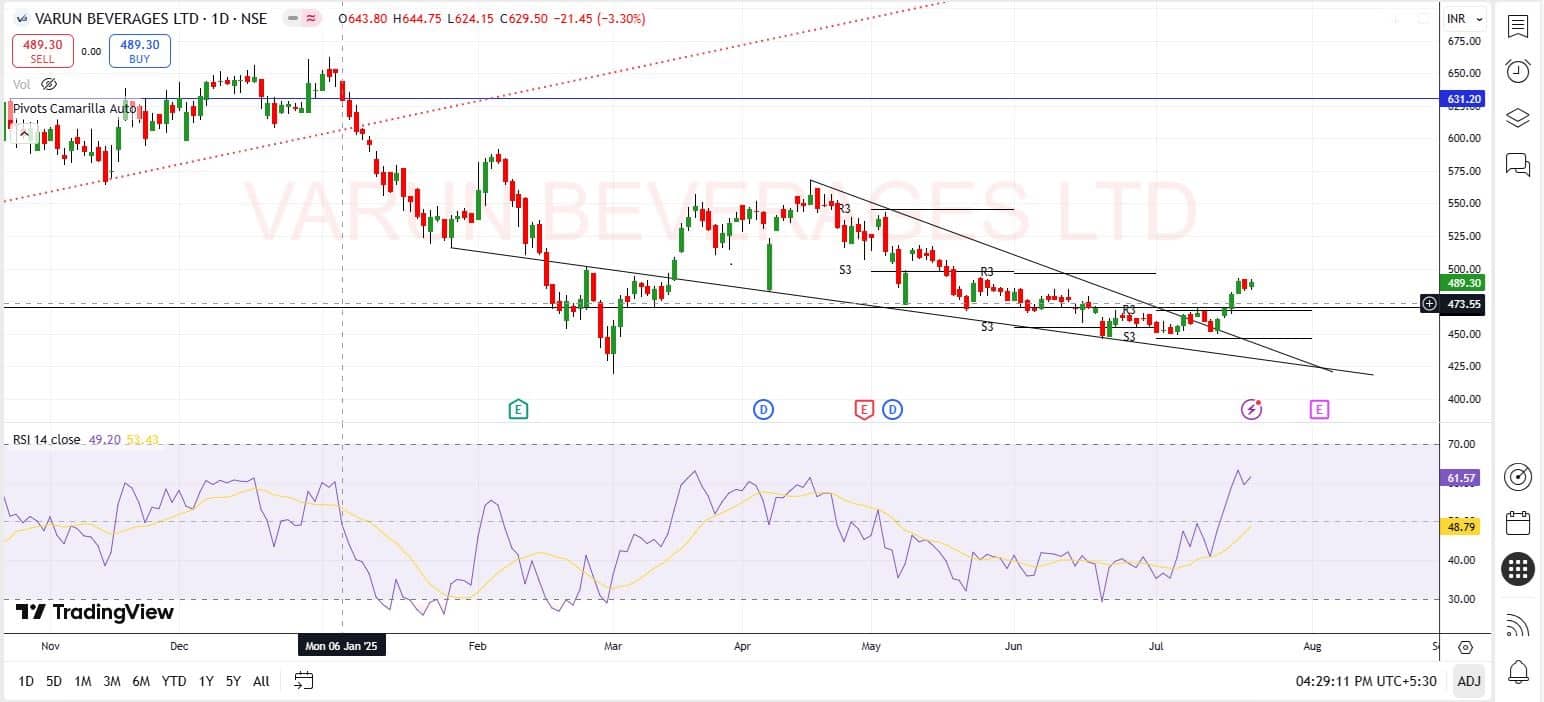
After undergoing a sharp correction of nearly 22% from its recent high of Rs 570, Varun Beverages has shown signs of a potential reversal. The stock has successfully breached a falling trendline on the daily chart, supported by a noticeable increase in volume — a key indicator of renewed buying interest. Adding to the bullish case, a positive RSI divergence is visible, reinforcing the likelihood of an upward move. Despite a 7% gain in the past week, the technical setup remains favourable, and a fresh long entry is still justified. Traders may consider entering long positions in the Rs 490–485 zone.
Strategy: Buy
Target: Rs 530
Stop-Loss: Rs 465
Sonata Software | CMP: Rs 438
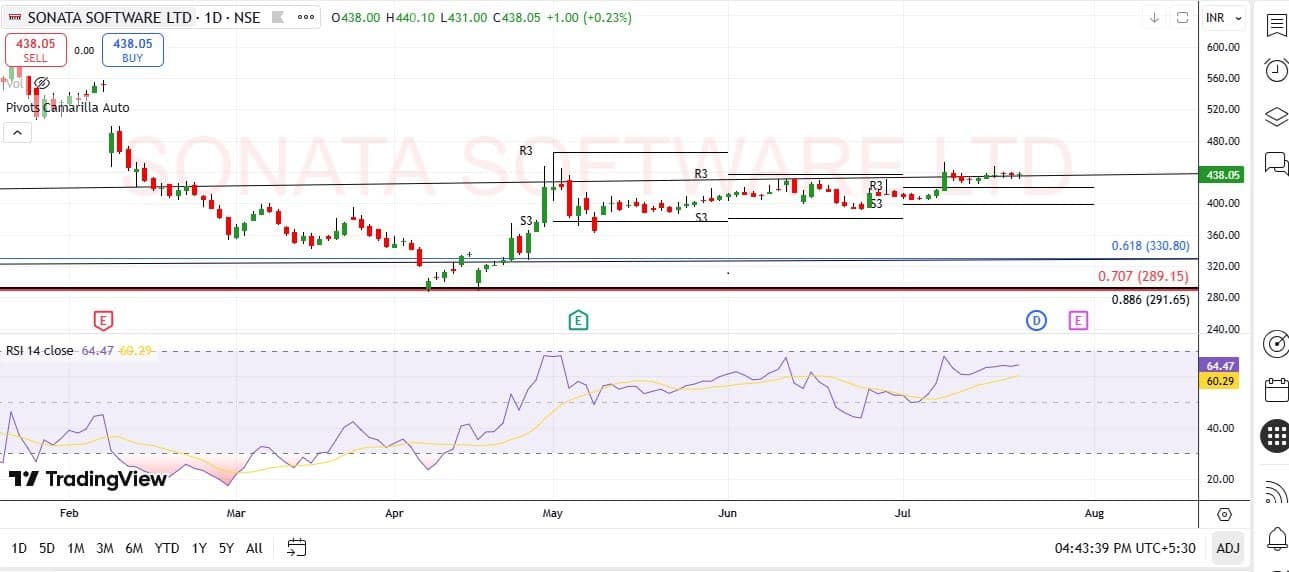
Sonata Software formed back-to-back inside value relationships on monthly Camarilla pivots, signaling consolidation and strong buildup. A breakout on July 8 confirmed the end of this phase. Since then, the stock has entered a healthy pullback, finding strong support above Rs 420 — a key technical level. Holding above this mark suggests buyer strength, and if sustained, Sonata Software may resume its upward trajectory in the coming sessions, with potential for further gains. Traders may consider entering long positions in the Rs 440–430 zone.
Strategy: Buy
Target: Rs 500
Stop-Loss: Rs 405
Jay Thakkar, Vice President & Head of Derivatives and Quant Research at ICICI Securities
Bajaj Auto | CMP: Rs 8,438.5
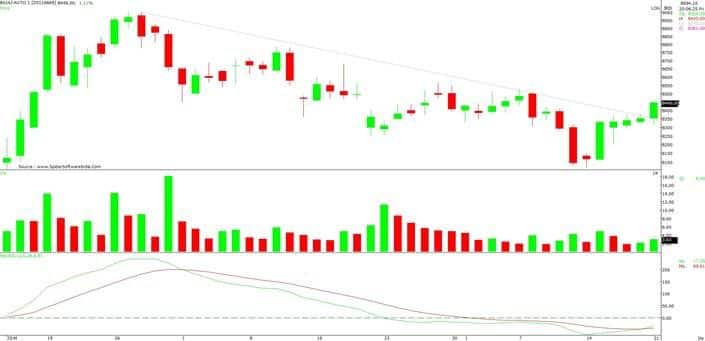
Bajaj Auto has provided a breakout from the falling trendline, and there has been short covering in the stock, which is likely to extend post this breakout. Significant Call unwinding has been observed from the Rs 8,100 to Rs 8,400 strikes, coupled with Put additions at the Rs 8,100 and Rs 8,200 strikes, which is positive in the near term. Therefore, in this series, further short covering is expected, which could help the stock bounce back to the Rs 8,600 to Rs 8,800 levels. Traders may consider buying Bajaj Auto Futures in the range of Rs 8,460 to Rs 8,430.
Strategy: Buy
Target: Rs 8,670, Rs 8,800
Stop-Loss: Rs 8,290
State Bank of India | CMP: Rs 824.2

SBI has provided a breakout from the sideways consolidation and has retested the breakout level. It has been observed that the stock witnessed short additions during the previous fall, but since then, it has bounced back from its March lows due to short covering. Recent data now indicates long additions as well. The Options data shows that the Rs 820 and Rs 830 strikes have the highest Call base, but since the stock is trading well above its maximum pain level, the probability of these resistance levels being overcome is quite high. Traders may consider buying SBI Futures in the range of Rs 825 to Rs 820.
Strategy: Buy
Target: Rs 850, Rs 870
Stop-Loss: Rs 814
Mahindra and Mahindra | CMP: Rs 3,246.7

M&M has been forming a higher base with increasing long buildup, and it has more room for long additions as the price nears lifetime highs. However, the overall long positions are still away from their highs, indicating that the stock is not overbought. Once the lifetime highs are surpassed, it can witness further upward momentum.
The stock has witnessed significant Put additions at the Rs 3,100 and Rs 3,200 strikes, as well as Call unwinding at the Rs 3,200 strike, which is a positive sign. Although there is still significant Call writing beyond the Rs 3,200 level, the probability of upward momentum remains high as the futures data indicates that bulls have the upper hand. Hence, a meaningful close above Rs 3,300 will likely lead to further short covering in the Calls. Traders may consider buying M&M Futures in the range of Rs 3,370 to Rs 3,240.
Strategy: Buy
Target: Rs 3,500, Rs 3,600
Stop-Loss: Rs 3,140
Vidnyan S Sawant, Head of Research at GEPL Capital
UPL | CMP: Rs 713.75
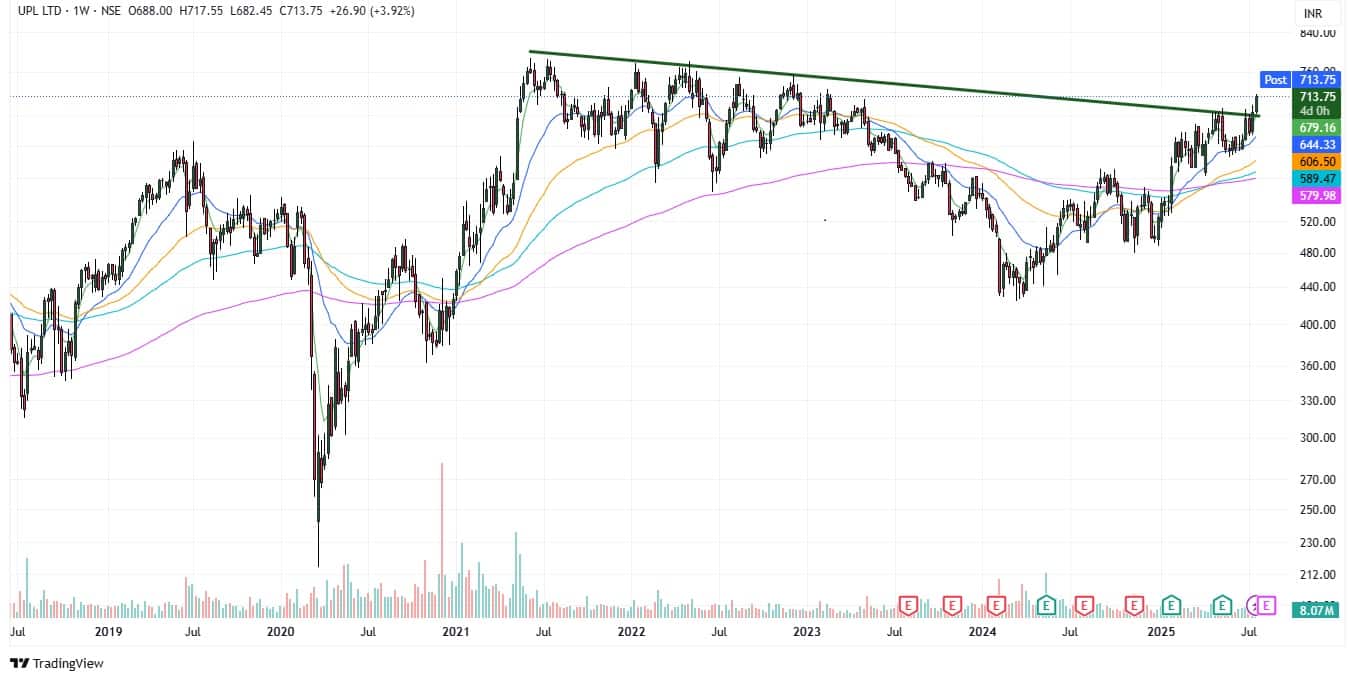
UPL has witnessed a breakout on the monthly chart, moving above both its recent consolidation range and a downward-sloping trendline. The breakout, marked by a strong bullish candlestick, indicates positive price development on the higher timeframes. On the weekly chart, the stock continues to form a structure of higher highs and higher lows, while sustaining well above its 12, 26, and 50-week EMAs, highlighting strength in the ongoing trend. On the daily chart, UPL exhibits high relative strength despite broader market weakness, supported by a noticeable volume surge exceeding its 20-day EMA average volume.
Strategy: Buy
Target: Rs 820
Stop-Loss: Rs 675
L&T Finance | CMP: Rs 210.58
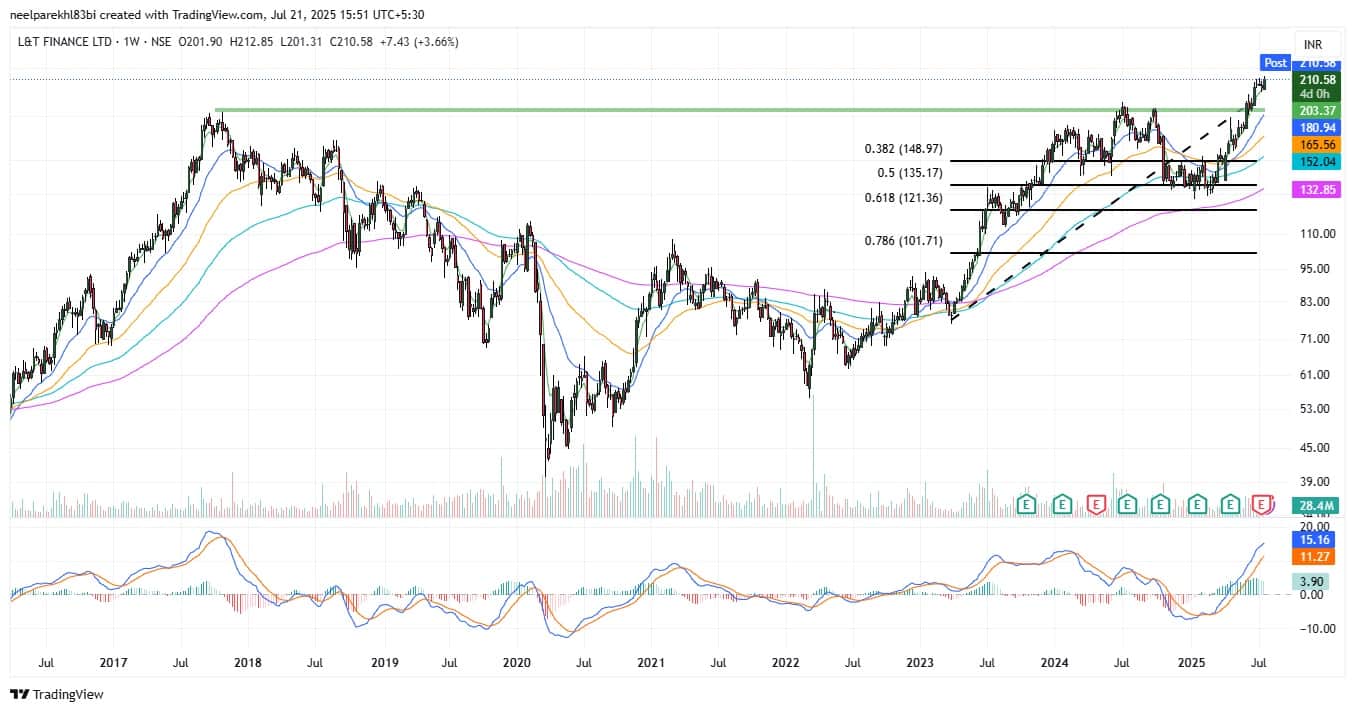
L&T Finance recently broke out of a large cup-and-handle pattern on the monthly chart, with the current month showing follow-through positive momentum — reinforcing the bullish setup. On the weekly scale, the stock is well sustained above its key 5, 12, 26, and 50-week EMAs, reflecting strong trend alignment. The MACD indicator is trending higher, indicating accelerating momentum. On the daily chart, LTF has shown a bullish mean reversion from its 26-day EMA, accompanied by a volume surge above its 20-day average, further supporting the positive price action.
Strategy: Buy
Target: Rs 240
Stop-Loss: Rs 200
ICICI Bank | CMP: Rs 1,465.8
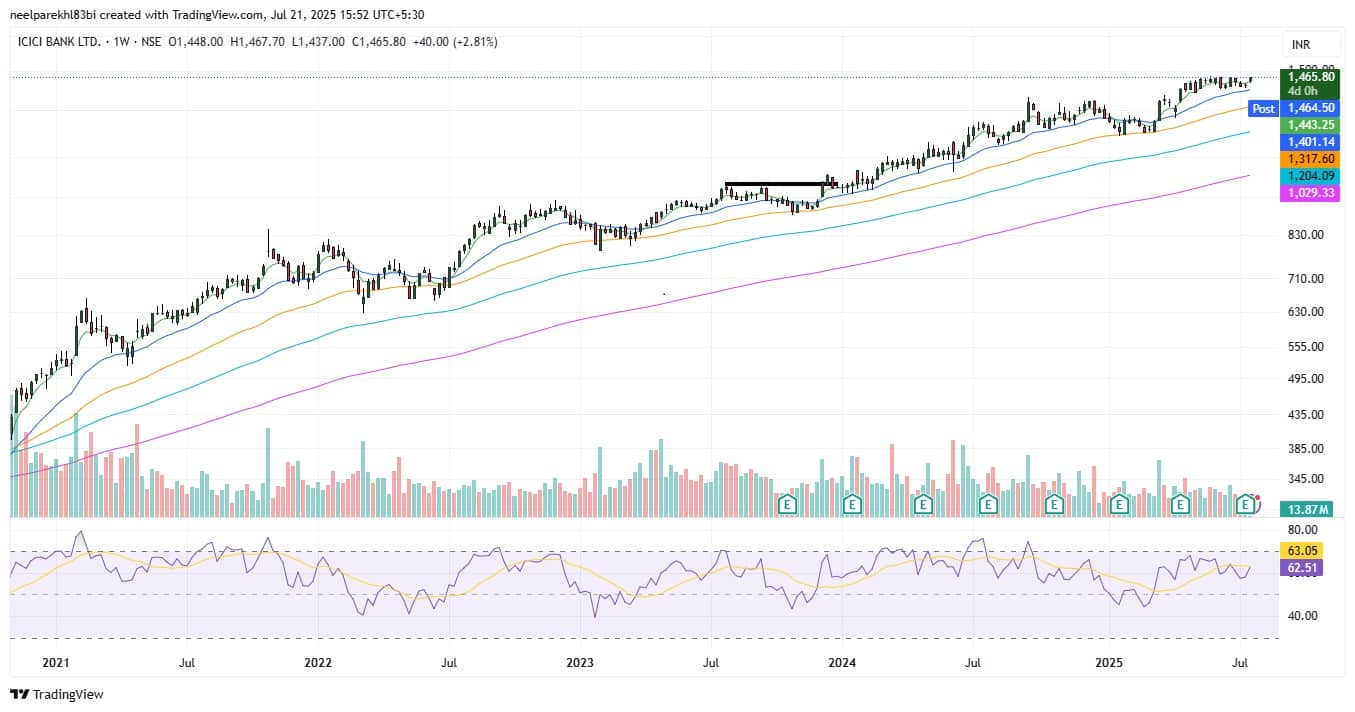
ICICI Bank has been forming a consistent pattern of higher tops and higher bottoms across timeframes, highlighting a sustained long-term uptrend. On the weekly chart, the stock is consolidating near its 12-week EMA, indicating healthy digestion of prior gains. On the daily scale, it has formed a double bottom around the 50-day EMA, signaling a bullish price structure. The weekly RSI holding above 60 reflects sustained positive momentum and underlying strength.
Strategy: Buy
Target: Rs 1,627
Stop-Loss: Rs 1,390
KEI Industries | CMP: Rs 3,972.4
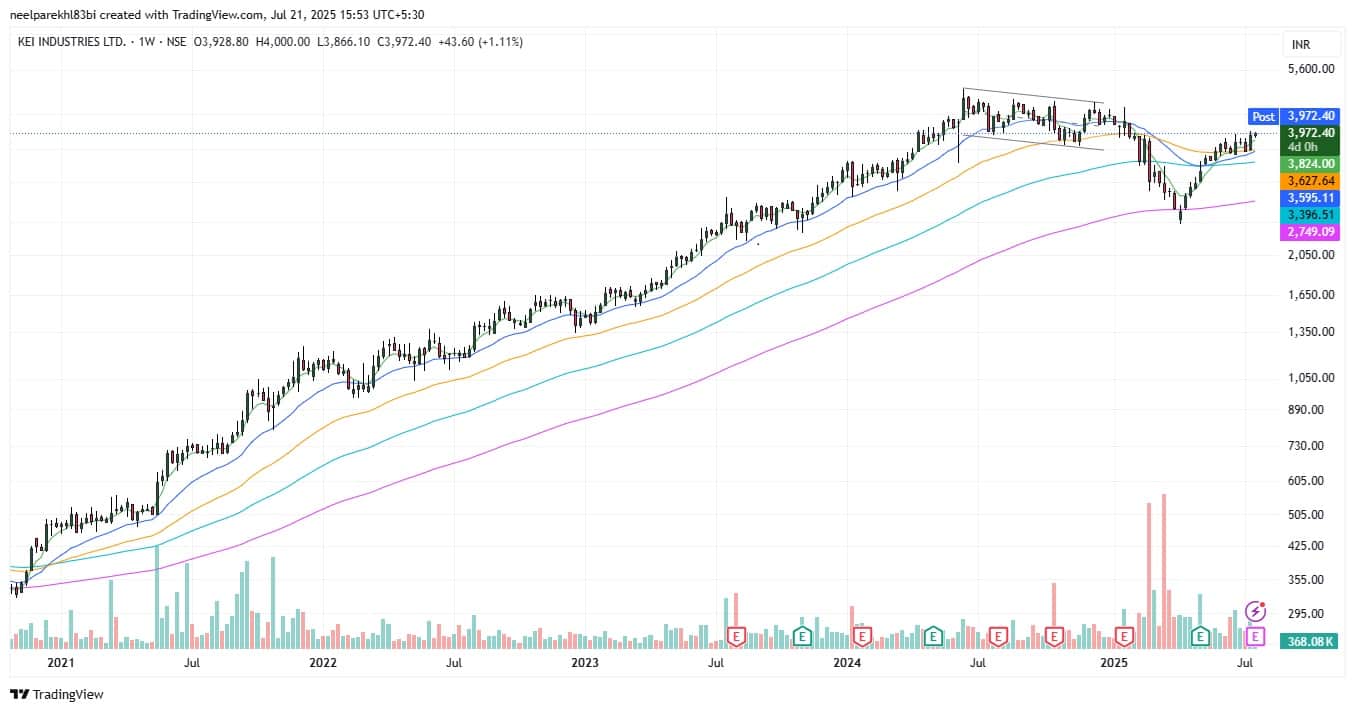
KEI Industries has been in a strong long-term uptrend, consistently forming higher tops and higher bottoms. In April 2025, the stock witnessed a bullish mean reversion from its 50-month EMA, reigniting upward momentum. On the daily chart, a positive hidden divergence signaled renewed strength, with the stock maintaining high relative performance despite broader market volatility. It continues to trade above key moving averages — 12, 26, and 50-week EMAs — highlighting strong trend alignment and resilience.
Strategy: Buy
Target: Rs 4,648
Stop-Loss: Rs 3,734
Disclaimer: The views and investment tips expressed by investment experts on Moneycontrol.com are their own and not those of the website or its management. Moneycontrol.com advises users to check with certified experts before taking any investment decisions.Discover the latest Business News, Sensex, and Nifty updates. Obtain Personal Finance insights, tax queries, and expert opinions on Moneycontrol or download the Moneycontrol App to stay updated!


Find the best of Al News in one place, specially curated for you every weekend.
Stay on top of the latest tech trends and biggest startup news.


