


The benchmark indices recorded a consolidation breakout with a massive sell-off on February 28, losing nearly 2 percent, with market breadth consistently favouring bears. About 2,278 shares declined compared to 346 rising shares on the NSE. The rebound after a severe fall can't be ruled out, but the sustainability is key to watch. Below are some trading ideas for the near term:
Rajesh Palviya, Senior Vice President Research (Head Technical Derivatives) at Axis Securities
Bharat Heavy Electricals | CMP: Rs 179.17

BHEL is trending lower, forming a series of lower tops and bottoms on the daily and weekly charts, signaling a sustained downtrend. With the current close, the stock has decisively broken down its past one-month support zone of Rs 184 on a closing basis, which signals a bearish bias. The stock is sustaining below its 20, 50, 100, and 200-day SMAs, which reconfirms further weakness. The daily, weekly, and monthly strength indicator RSI (Relative Strength Index) is in negative territory, indicating rising weakness. Investors/traders should sell or exit this stock, with an expected downside of Rs 165-145, and its upside resistance zone is Rs 190-200.
Strategy: Sell
Target: Rs 165, Rs 145
Stop-Loss: Rs 190
UltraTech Cement | CMP: Rs 10,128.5
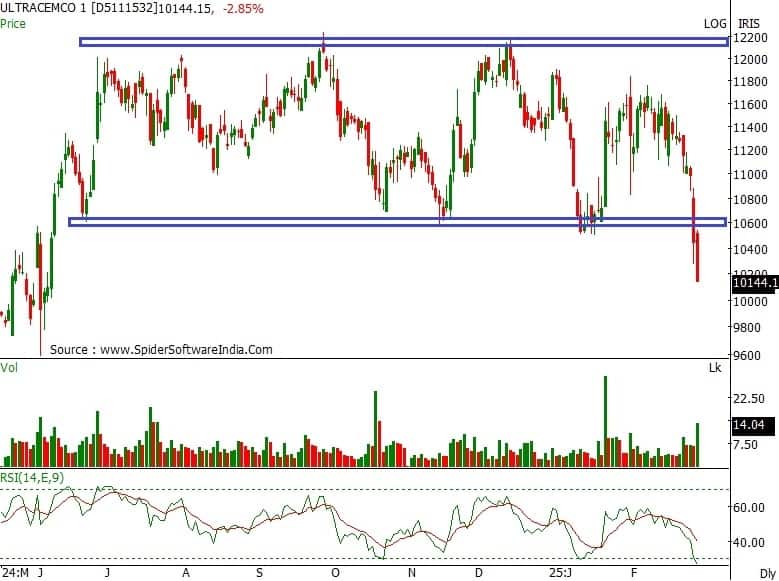
Since June 2024, UltraTech Cement has been consolidating within a broad range (Rs 12,100-10,500), indicating a sideways trend. However, with Friday's sell-off, the stock decisively broke down its multiple support zone of Rs 10,500 on a closing basis, signaling a change of trend towards the downside. The stock is sustaining below its 20, 50, 100, and 200-day SMAs, which reconfirms further weakness.
The daily, weekly, and monthly strength indicator RSI is in negative territory, indicating rising weakness. The daily and weekly "Bollinger bands" sell signal suggests increased momentum. Investors/traders should sell or exit this stock, with an expected downside of Rs 9,700-9,500 and an upside resistance zone of Rs 10,500-10,800.
Strategy: Sell
Target: Rs 9,700, Rs 9,500
Stop-Loss: Rs 10,500
Ipca Laboratories | CMP: Rs 1,355.35
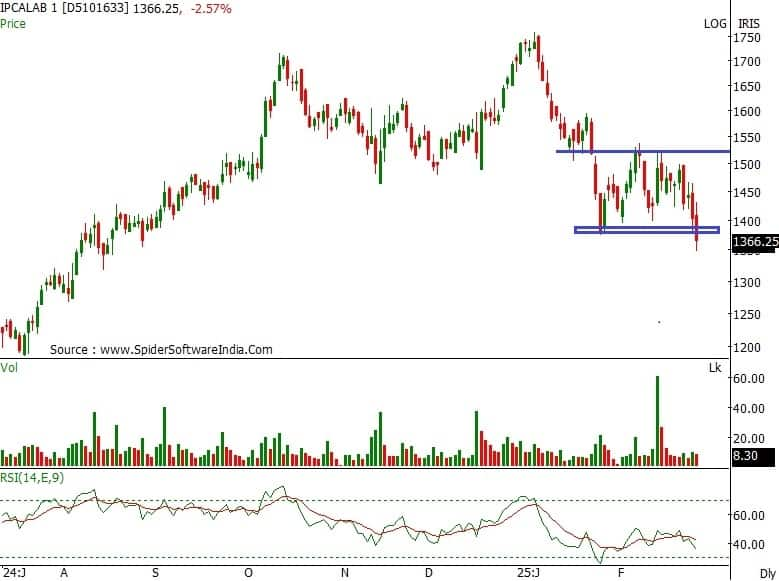
Recently, Ipca Laboratories has confirmed a downtrend, forming a series of lower tops and bottoms on the daily chart. It has also violated the past four weeks' multiple support zone of Rs 1,380 on a closing basis, indicating further weakness. The stock is sustaining below its 20, 50, 100, and 200-day SMAs, which reconfirms further weakness. The daily, weekly, and monthly strength indicator RSI is in negative territory, indicating rising weakness. The daily and weekly "Bollinger bands" sell signal suggests increased momentum. Investors/traders should sell or exit this stock, with an expected downside of Rs 1,250-1,175 and an upside resistance zone of Rs 1,425-1,460.
Strategy: Sell
Target: Rs 1,250, Rs 1,175
Stop-Loss: Rs 1,425
Ameya Ranadive, CMT, CFTe, Senior Technical Analyst at Stoxbox
BSE | CMP: Rs 4,633.7
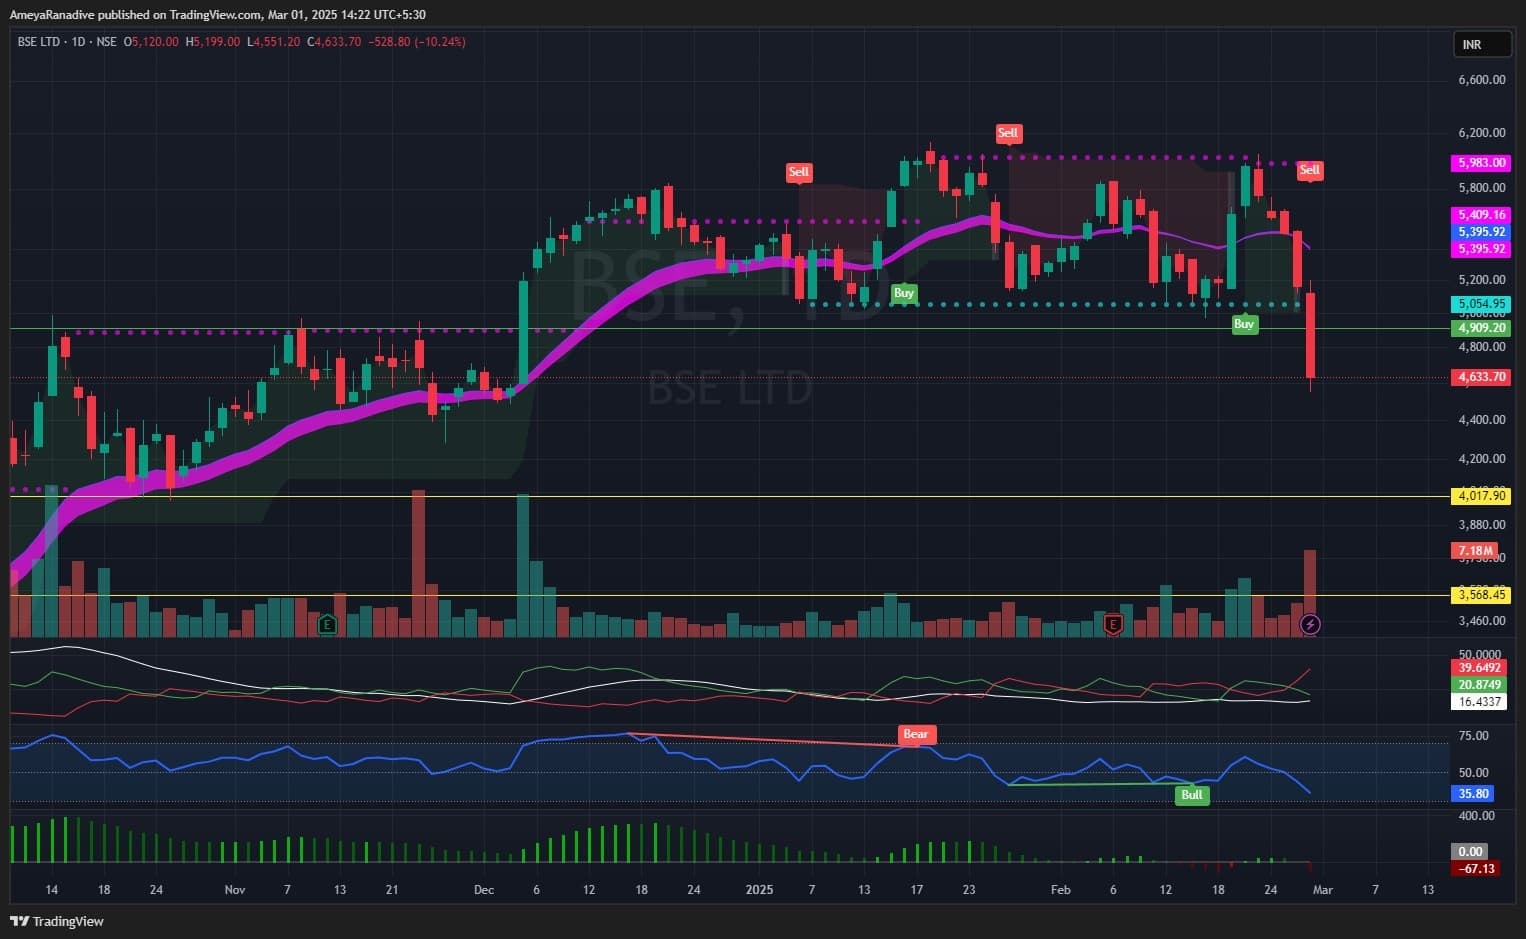
BSE fell over 10% on Friday, reinforcing a strong bearish momentum. The stock has broken below the crucial support of Rs 5,050, confirming a sell-on-rise strategy. Any rebound toward Rs 4,800 can be used as a shorting opportunity, with downside targets placed at Rs 4,200 and Rs 4,100. The RSI at 36 indicates weak momentum, while the Average Directional Index (ADX) signals an intensifying bearish trend. Additionally, price rejection near Rs 5,100 suggests that buyers are failing to absorb the selling pressure, keeping the sentiment negative.
As long as BSE trades below Rs 5,100, the broader trend remains weak, favouring a bearish stance. Traders should look for sustained lower highs and failed intraday recoveries as confirmation of further downside. A decisive breakout above Rs 5,100 would invalidate this view, but until then, selling on rallies remains the preferred approach.
Strategy: Sell
Target: Rs 4,200, Rs 4,100
Stop-Loss: Rs 4,800
Granules India | CMP: Rs 461.8

Granules India declined nearly 9% on Friday. The stock has decisively breached the key support zone of Rs 505-500, confirming a sell-on-rise strategy. Any pullback toward Rs 480 can be used as a shorting opportunity, with downside targets placed at Rs 435 and Rs 420. The RSI at 28 signals oversold conditions; however, the lack of reversal signs suggests that weakness could persist. The ADX indicates a strengthening bearish trend, while repeated price rejection from the Rs 529-Rs 535 resistance zone reinforces the negative sentiment.
Despite the oversold RSI, caution is warranted as stocks in strong downtrends often remain oversold for an extended period. A sustained move above Rs 510 would negate this bearish view, but as long as the stock remains below this level, the overall structure remains weak.
Strategy: Sell
Target: Rs 435, Rs 420
Stop-Loss: Rs 480
LIC Housing Finance | CMP: Rs 496.9
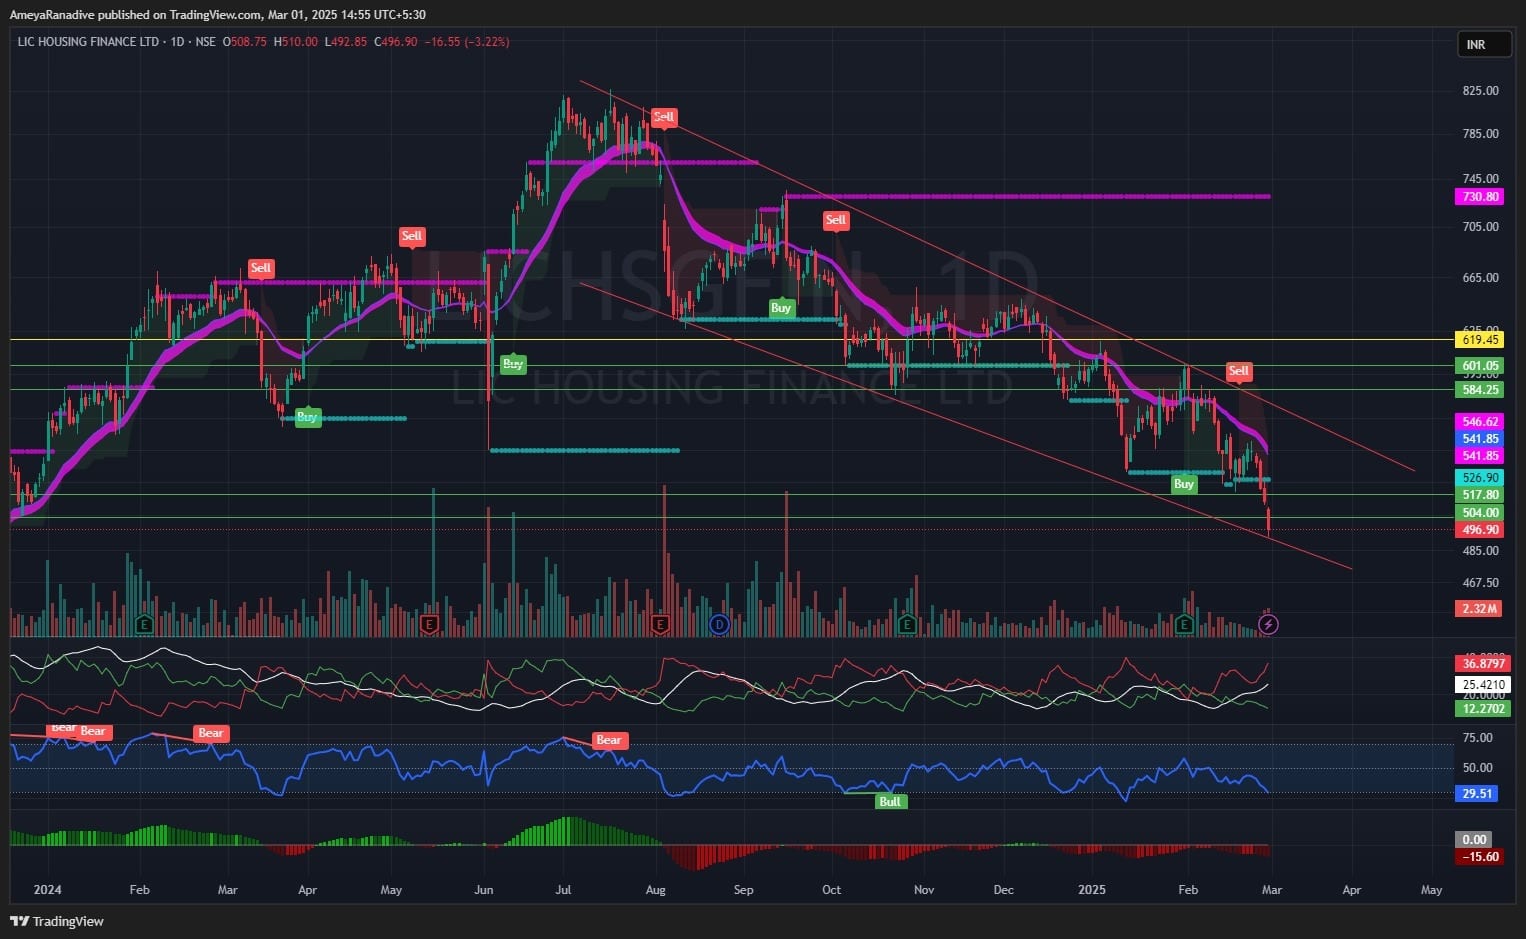
LIC Housing Finance continues to trend lower within a well-defined falling channel, indicating sustained bearish momentum. The stock has witnessed strong selling pressure over the last three sessions, supported by high volumes, reinforcing the weakness. Additionally, it is trading below all key exponential moving averages (10, 50, 100, and 200-EMA), further strengthening the bearish outlook. Any pullback toward Rs 505 can be utilized as a shorting opportunity, with downside targets placed at Rs 477 and Rs 470. The RSI at 29.51 suggests oversold conditions, but the absence of reversal signals indicates that the weakness is likely to persist.
The ADX confirms a strengthening bearish trend, while repeated price rejection from the Rs 517-Rs 526 resistance zone suggests that sellers remain in control. Despite the oversold RSI, a reversal is unlikely unless the stock decisively moves above Rs 520, which would negate the bearish outlook. Until then, the broader trend remains weak, favouring a sell-on-rise approach.
Strategy: Sell
Target: Rs 477, Rs 470
Stop-Loss: Rs 505
Osho Krishan, Senior Analyst - Technical & Derivative Research at Angel One
Coal India | CMP: Rs 369.35
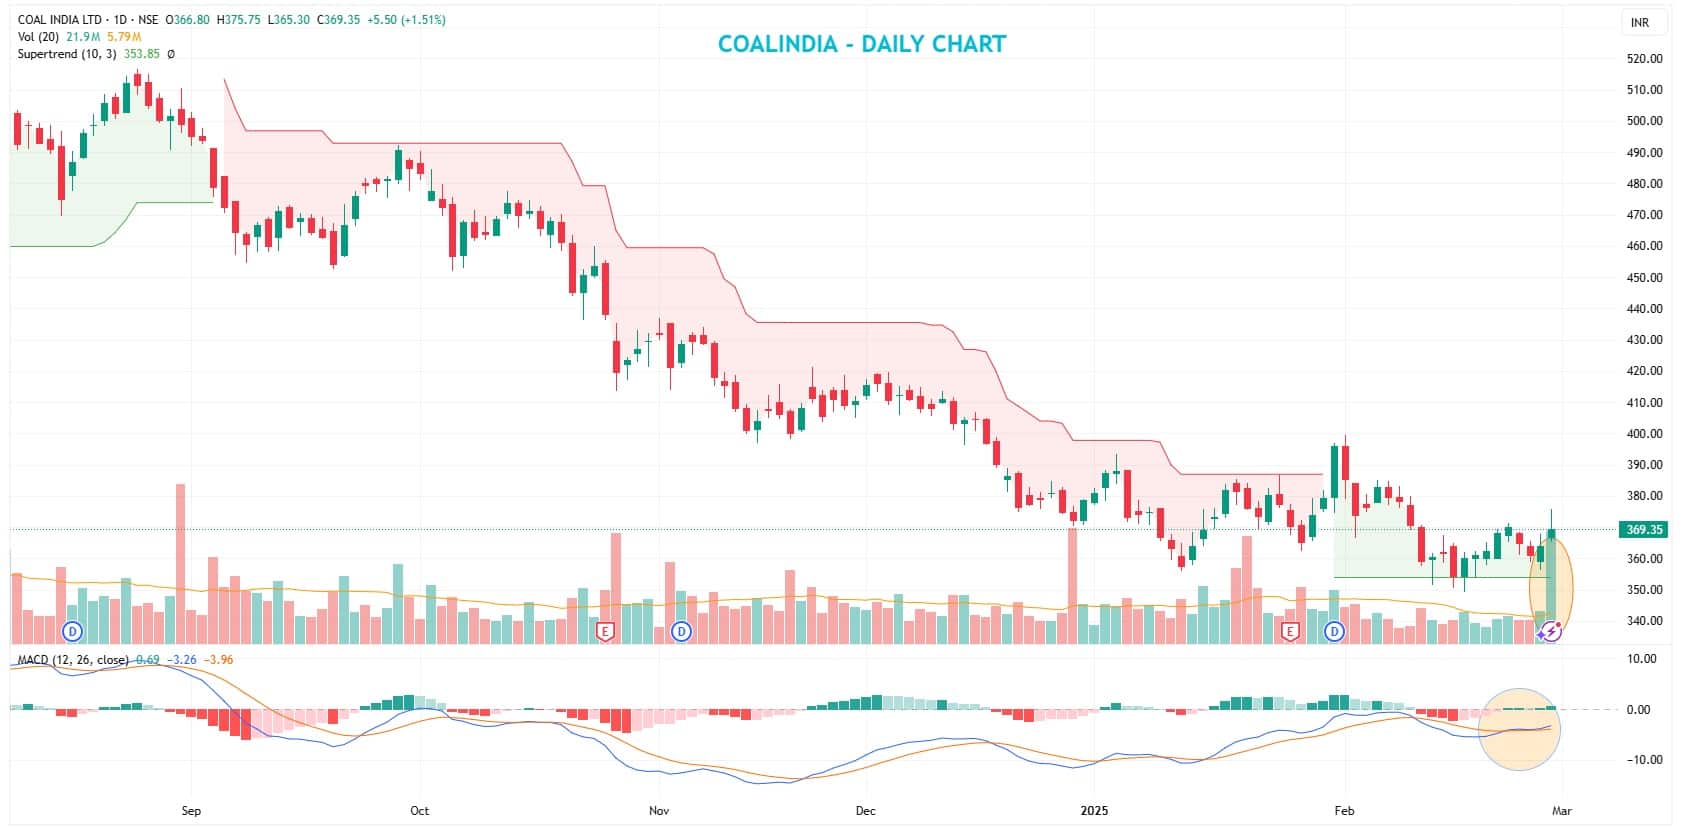
Coal India has been on a stellar down run, eroding nearly 30 percent from its peak of Rs 517. Currently, the counter is hovering near the 20 DEMA, portraying a consolidation phase. However, in the shorter duration, the counter has been witnessing some buying traction and seems to have a counter-trend with a supportive bullish trend indicated by the SuperTrend indicator. Also, the 14-period RSI and MACD (Moving Average Convergence Divergence) align well with the undertone, adding a bullish quotient. Hence, we recommend buying Coal India around Rs 360-355.
Strategy: Buy
Target: Rs 400
Stop-Loss: Rs 340
HDFC Bank | CMP: Rs 1,732.4
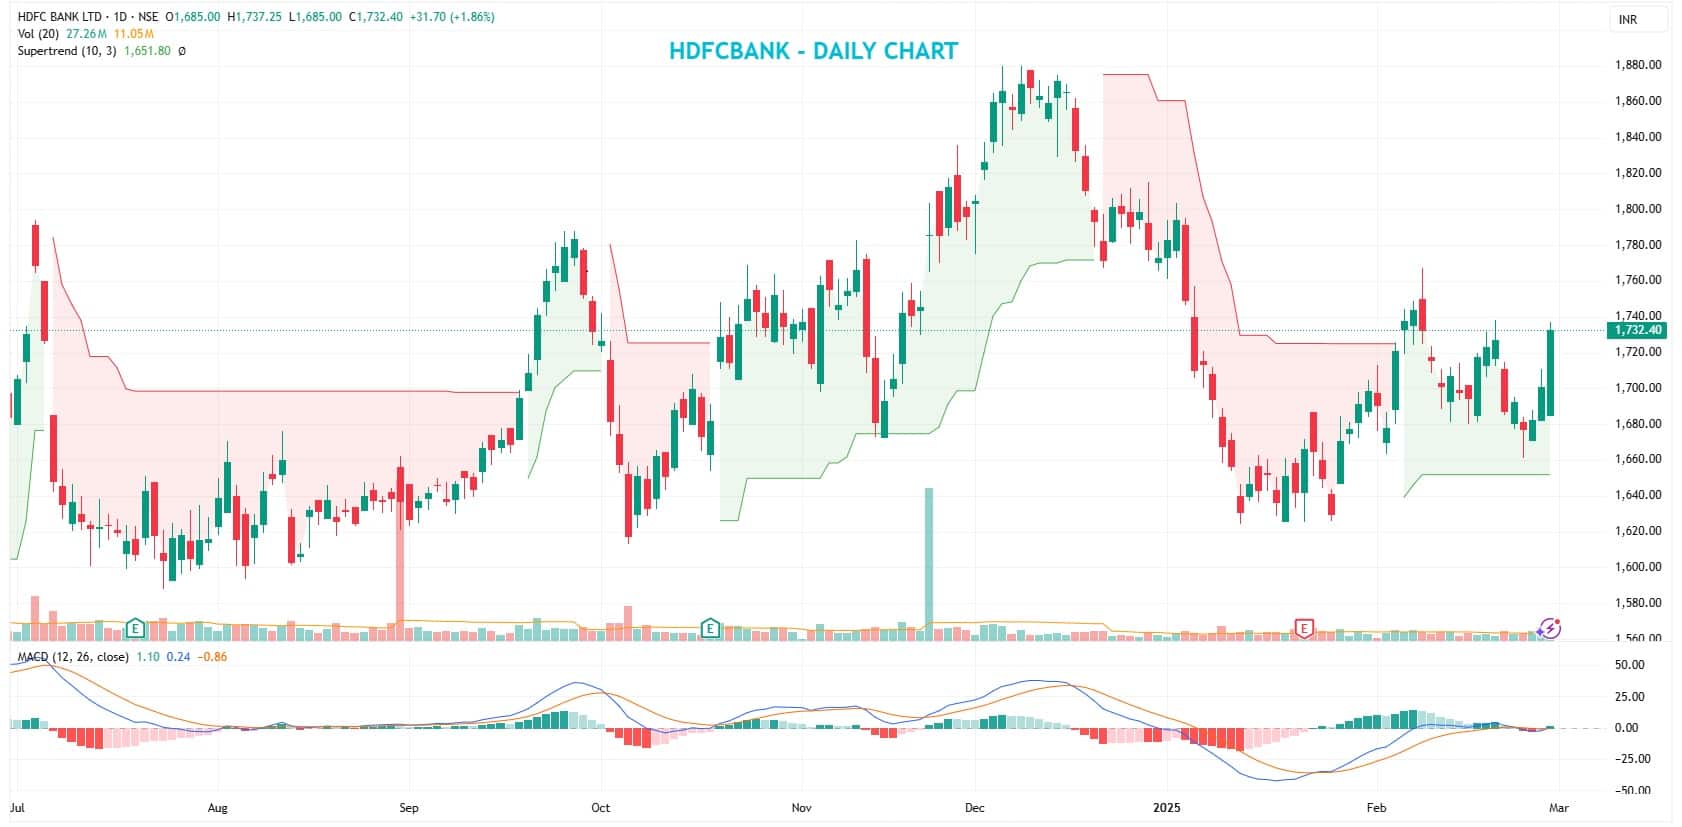
HDFC Bank has seen a decent recovery from the 200 DSMA and is now placed above the short-term EMAs on the daily chart. The recent buying traction has been backed by a rise in trading volumes, attributing to positive development in the counter. Additionally, the counter is comfortably placed above the SuperTrend indicator, adding to its bullish quotient. Simultaneously, the MACD indicator has surged to the zero line from lower levels, suggesting potential momentum in the near future. Hence, we recommend buying HDFC Bank around Rs 1,730-Rs 1,720.
Strategy: Buy
Target: Rs 1,850
Stop-Loss: Rs 1,630
SRF | CMP: Rs 2,795.40
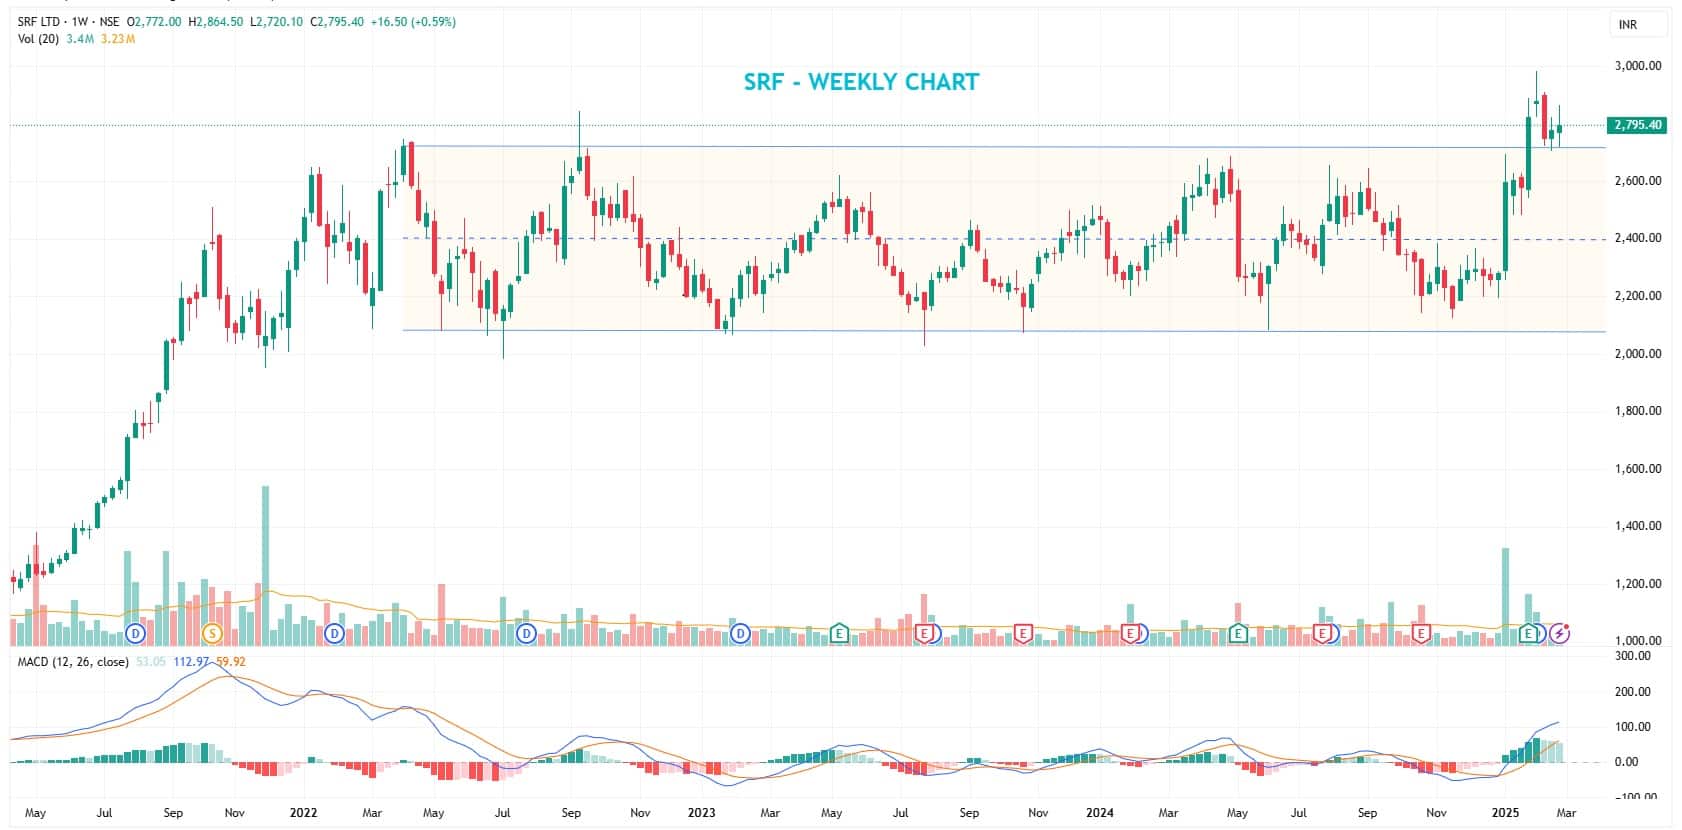
SRF has experienced a significant bull run from the zone of Rs 2,200 in the last couple of trading months and has witnessed a multi-week breakout of the Rs 2,700 subzone. The counter is placed above all its significant EMAs on the daily time frame structure, suggesting inherent strength, and is anticipated to continue the same in the near term. The neckline of the breakout is likely to provide a cushion, while the stock seems likely to enter uncharted territory in the upcoming period. Hence, we recommend buying SRF around Rs 2,750-Rs 2,730.
Strategy: Buy
Target: Rs 3,000
Stop-Loss: Rs 2,600
Disclaimer: The views and investment tips expressed by investment experts on Moneycontrol.com are their own and not those of the website or its management. Moneycontrol.com advises users to check with certified experts before taking any investment decisions.
Discover the latest Business News, Sensex, and Nifty updates. Obtain Personal Finance insights, tax queries, and expert opinions on Moneycontrol or download the Moneycontrol App to stay updated!
Find the best of Al News in one place, specially curated for you every weekend.
Stay on top of the latest tech trends and biggest startup news.


