


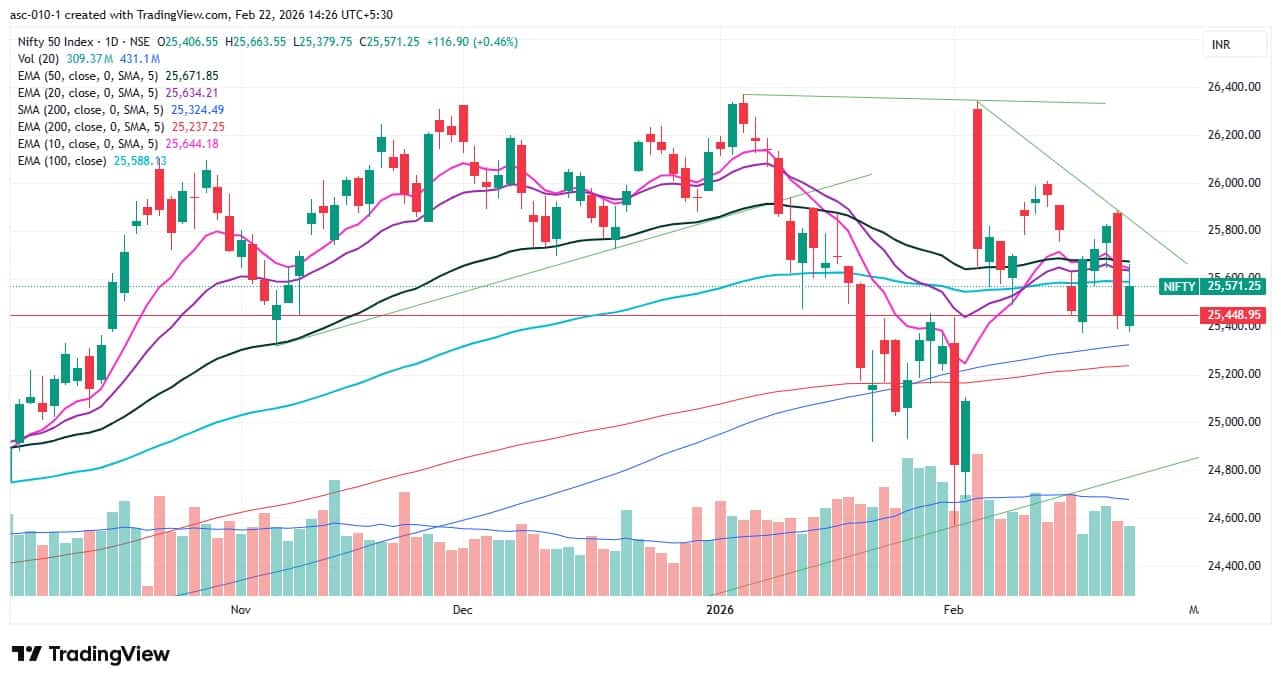
The Nifty 50 failed to show follow-through selling, with the chart formation signaling an attempt to bounce back from the lows. The index rose half a percent on February 20 following a 1.4 percent loss in the previous session. It consistently held above the 25,400 level three times on a closing basis during the week. As long as the index holds above this level, along with the positive signal from the US Supreme Court striking down Trump’s tariffs with a 6–3 vote—though Trump later announced an increase in global tariffs to 15 percent from 10 percent—a possible move toward the 25,900–26,000 levels (which also coincide with recent swing highs) may occur in the upcoming sessions. Only a move above these levels can negate the lower high–lower low formation. However, a decisive and sustained fall below 25,400 could drive the index toward the 25,300–25,200 levels, experts said.
Here are 15 data points we have collated to help you spot profitable trades:
1) Key Levels For The Nifty 50 (25,571)
Resistance based on pivot points: 25,647, 25,714, and 25,822
Support based on pivot points: 25,430, 25,363, and 25,254
Special Formation: The Nifty 50 formed a bullish candle with an upper shadow on the daily charts following a long red candle in the previous session, signaling an attempt to bounce back from the lows. The index tested but failed to hold the 10-, 20-, and 100-day EMAs on a closing basis, while it has sustained well above the 200-day EMA and DMA since February 3. It managed to close slightly above the midline of the Bollinger Bands; hence, sustaining above this level is crucial for further upside. However, the momentum indicators remain weak to sideways. The RSI inclined upward to 48.35, though it remains below the reference line. The MACD is on the verge of breaking below the zero line, though it is still slightly above the signal line, while the histogram shows fading momentum. All this indicates cautious undertones despite the bounce.
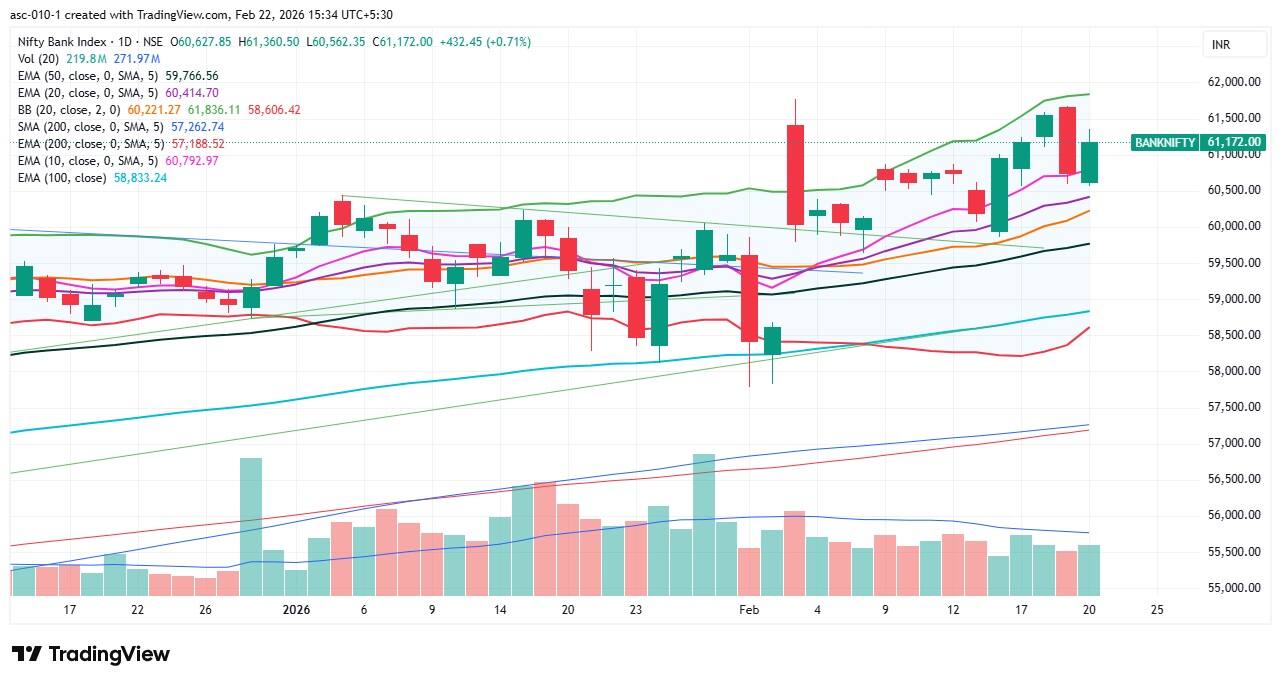
2) Key Levels For The Bank Nifty (61,172)
Resistance based on pivot points: 61,337, 61,525, and 61,830
Support based on pivot points: 60,727, 60,538, and 60,234
Resistance based on Fibonacci retracement: 62,106, 64,777
Support based on Fibonacci retracement: 60,200, 59,730
Special Formation: The Bank Nifty also bounced back sharply and recouped more than half of the previous day’s losses, rising 0.71 percent on Friday. The index formed a bullish candle on the daily timeframe, sustaining above all key moving averages as well as well above the falling support trendline. In fact, the moving averages are trending upward. The RSI rose to 58.93 with a positive crossover, while the MACD sustained above the signal line, though the histogram showed slightly fading momentum. All this indicates improving strength with some caution due to slowing momentum.
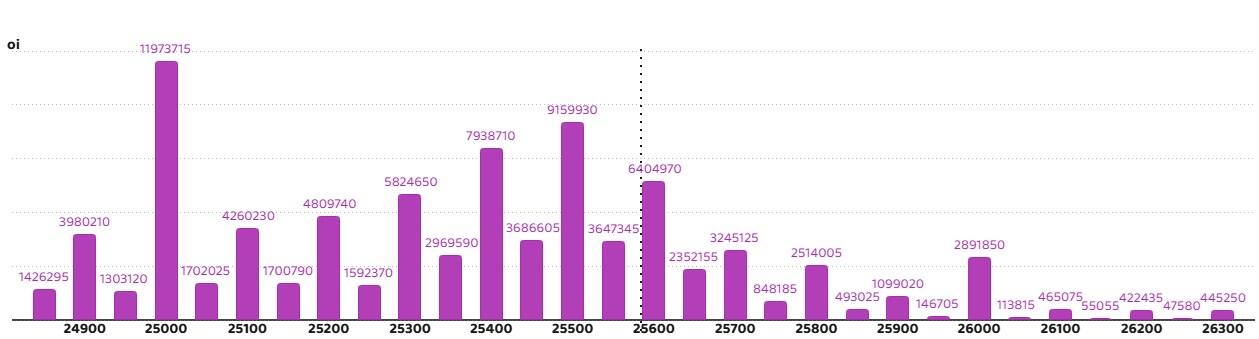
According to the monthly options data, the maximum Call open interest was placed at the 26,000 strike (with 1.41 crore contracts). This level can act as a key resistance level for the Nifty in the short term. It was followed by the 25,800 strike (1.07 crore contracts) and 25,700 strike (88.69 lakh contracts).
Maximum Call writing was observed at the 25,650 strike, which saw an addition of 2.48 lakh contracts, followed by the 26,050 and 26,150 strikes, which added 1.91 lakh and 34,450 contracts, respectively. The maximum Call unwinding was seen at the 24,800 strike which shed 39.47 lakh contracts, followed by the 25,600 and 25,700 strikes, which shed 37.26 lakh and 34.39 lakh contracts, respectively.

On the Put side, the 25,000 strike holds the maximum Put open interest (with 1.19 crore contracts), which can act as a key support level for the Nifty in the short term. It was followed by the 25,500 strike (91.59 lakh contracts) and the 25,400 strike (79.38 lakh contracts).
The maximum Put writing was placed at the 25,500 strike, which saw an addition of 35.3 lakh contracts, followed by the 25,600 and 25,550 strikes, which added 25.71 lakh and 22.23 lakh contracts, respectively. The maximum Put unwinding was seen at the 25,800 strike, which shed 4.62 lakh contracts, followed by the 25,900 and 26,000 strikes, which shed 2.83 lakh and 2.21 lakh contracts, respectively.
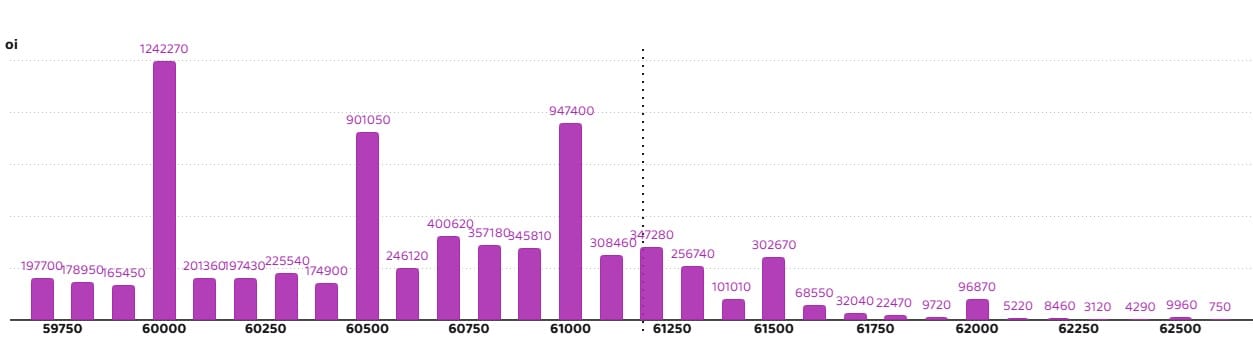
5) Bank Nifty Call Options Data
According to the monthly options data, the maximum Call open interest was seen placed at the 62,500 strike, with 8.85 lakh contracts. This can act as a key resistance level for the index in the short term. It was followed by the 61,000 strike (8.71 lakh contracts) and the 62,000 strike (8.35 lakh contracts).
Maximum Call writing was observed at the 61,200 strike (with the addition of 1.88 lakh contracts), followed by the 61,300 strike (1.13 lakh contracts) and 61,900 strike (72,150 contracts). The maximum Call unwinding was seen at the 61,000 strike, which shed 2.52 lakh contracts, followed by the 61,500 and 60,000 strikes which shed 2.31 lakh and 2.3 lakh contracts, respectively.
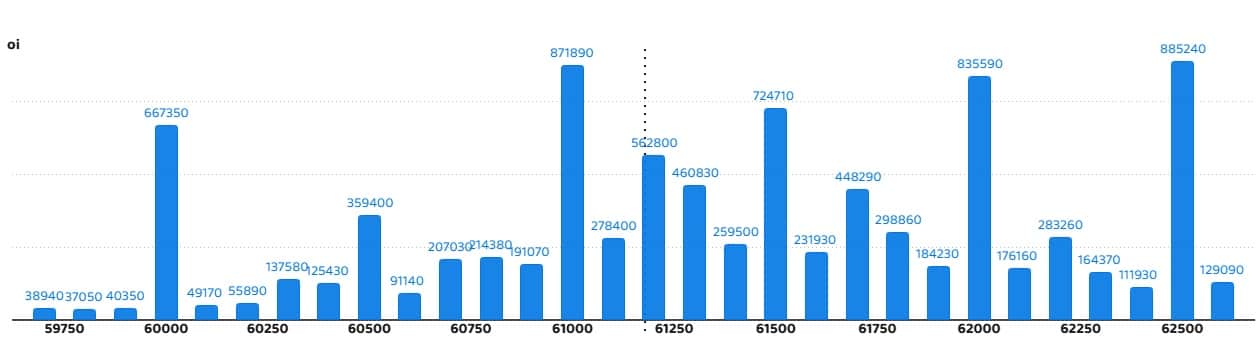
6) Bank Nifty Put Options Data
On the Put side, the 60,000 strike holds the maximum Put open interest (with 12.42 lakh contracts), which can act as a key support level for the index. This was followed by the 61,000 strike (9.47 lakh contracts) and the 60,500 strike (9.01 lakh contracts).
The maximum Put writing was placed at the 61,000 strike (which added 3.14 lakh contracts), followed by the 61,200 strike (1.84 lakh contracts) and the 60,900 strike (1.82 lakh contracts). The maximum Put unwinding was seen at the 60,000 strike, which shed 1.22 lakh contracts, followed by the 60,200 and 59,800 strikes, which shed 20,130 and 9,240 contracts, respectively.
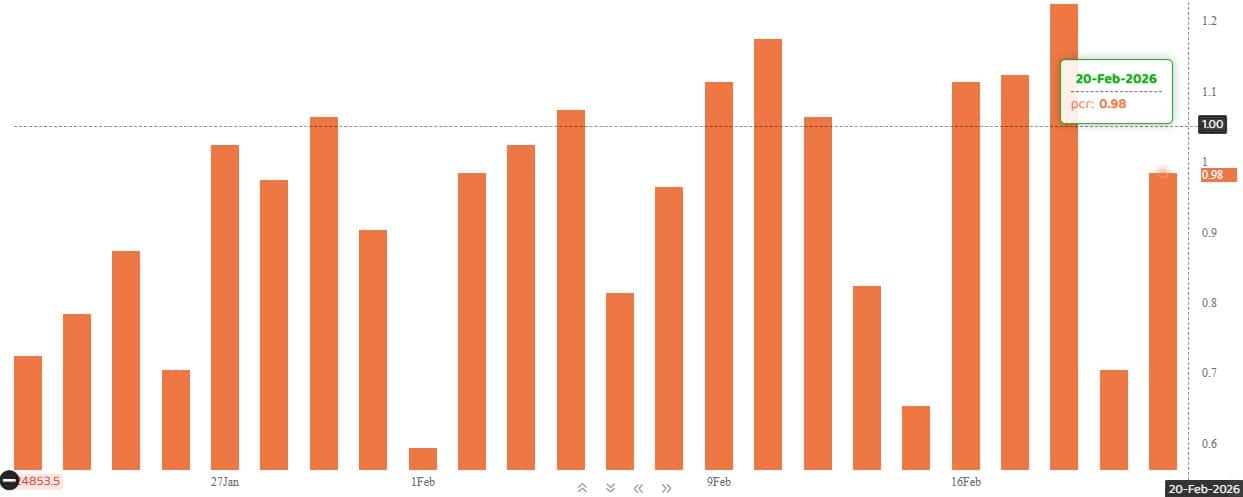
The Nifty Put-Call ratio (PCR), which indicates the mood of the market, jumped to 0.98 on February 20, compared to 0.7 in the previous session.
The increasing PCR, or being higher than 0.7 or surpassing 1, means traders are selling more Put options than Call options, which generally indicates the firming up of a bullish sentiment in the market. If the ratio falls below 0.7 or moves towards 0.5, then it indicates selling in Calls is higher than selling in Puts, reflecting a bearish mood in the market.
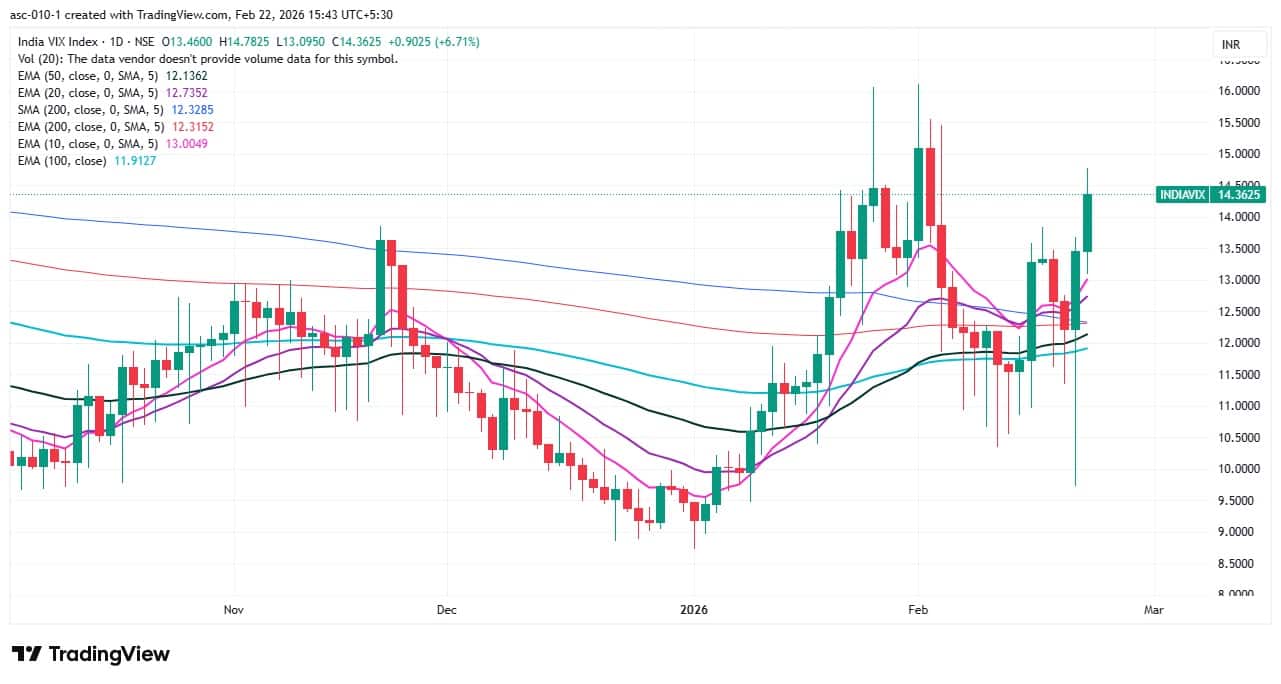
9) India VIX
The fear gauge, India VIX, spiked further to 14.36—the highest closing level since February 1—rising 6.71 percent on Friday, in addition to a 10.12 percent jump in the previous session, signaling concerns for bulls and rising uncertainty. A decisive fall below 12 is needed for bulls to enter a comfort zone.
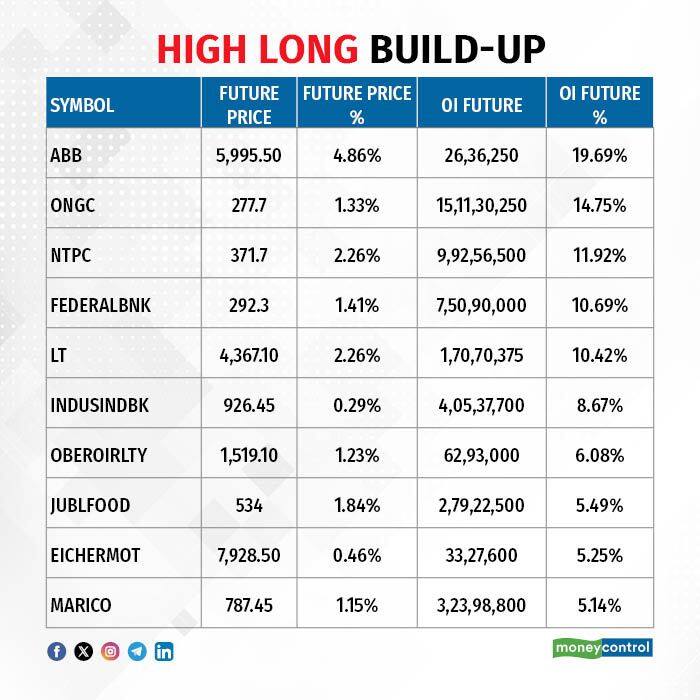
A long build-up was seen in 50 stocks. An increase in open interest (OI) and price indicates a build-up of long positions.
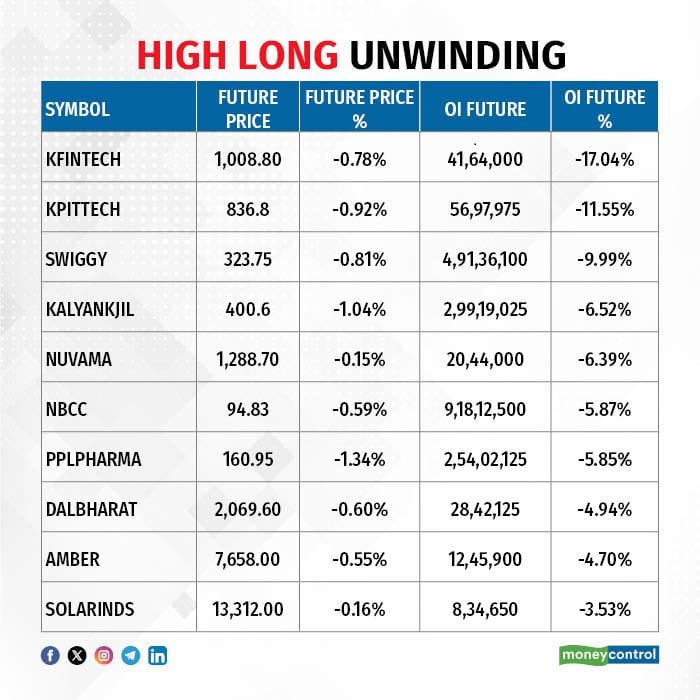
11) Long Unwinding (25 Stocks)
25 stocks saw a decline in open interest (OI) along with a fall in price, indicating long unwinding.
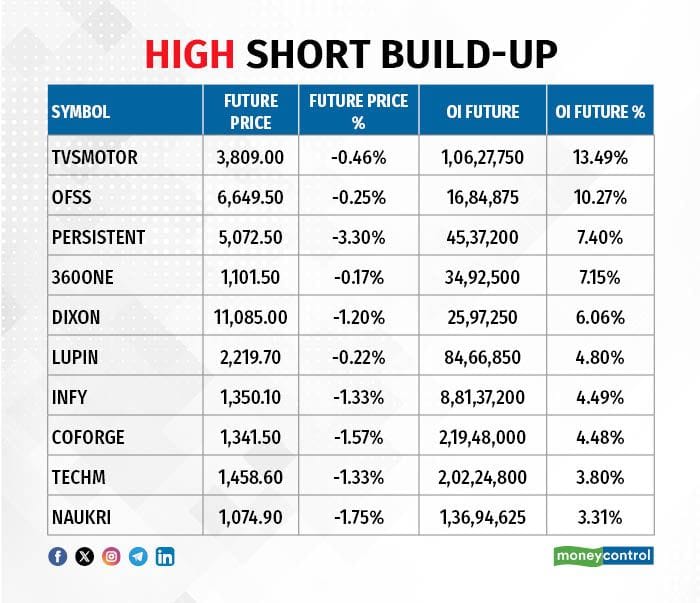
12) Short Build-up (32 Stocks)
32 stocks saw an increase in OI along with a fall in price, indicating a build-up of short positions.
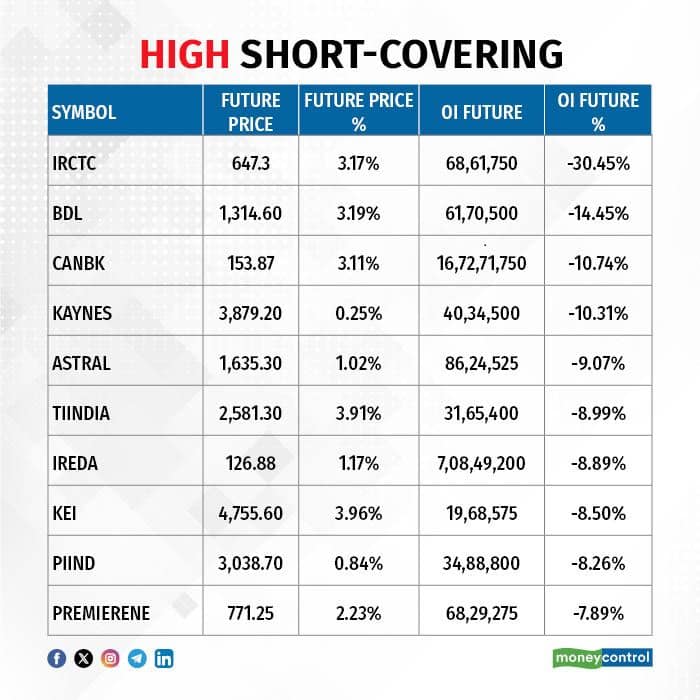
13) Short-Covering (101 Stocks)
101 stocks saw short-covering, meaning a decrease in OI, along with a price increase.
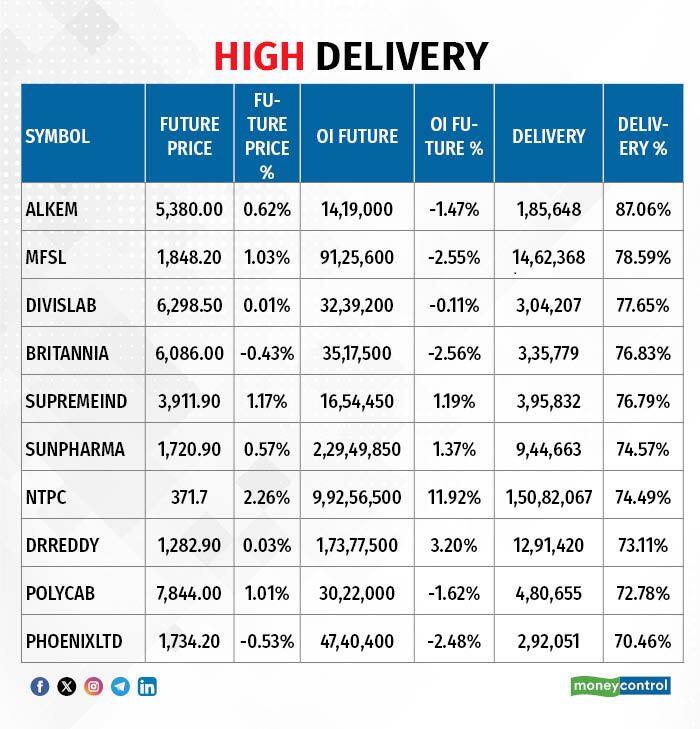
Here are the stocks that saw a high share of delivery trades. A high share of delivery reflects investing (as opposed to trading) interest in a stock.
Securities banned under the F&O segment include companies where derivative contracts cross 95 percent of the market-wide position limit.
Stocks added to F&O ban: Nil
Stocks retained in F&O ban: SAIL, Sammaan Capital
Stocks removed from F&O ban: Nil
Disclaimer: The views and investment tips expressed by experts on Moneycontrol are their own and not those of the website or its management. Moneycontrol advises users to check with certified experts before taking any investment decisions.Disclaimer: Moneycontrol is a part of the Network18 group. Network18 is controlled by Independent Media Trust, of which Reliance Industries is the sole beneficiary.Discover the latest Business News, Sensex, and Nifty updates. Obtain Personal Finance insights, tax queries, and expert opinions on Moneycontrol or download the Moneycontrol App to stay updated!
Find the best of Al News in one place, specially curated for you every weekend.
Stay on top of the latest tech trends and biggest startup news.


