


The markets had yet another disappointing week ended Friday with the benchmark indices losing six-tenth of a percent and staying in the red for the fourth week in a row. The last week's low point of 19,250, which also coincides with 50-day EMA (exponential moving average), is expected to be crucial this week as well. A breach of this level may pull down the index up to the psychological 19,000 mark, whereas on the higher side, 19,400-19,500, which have the maximum Call open interest, can be critical hurdles, experts said.
The Nifty50 ended the week above 19,300 and formed a bearish candlestick pattern on the weekly charts, making lower highs for the fourth straight session, indicating the sentiment remains weak but we have not seen a severe correction yet. The index fell around 3.4 percent from its all-time high of 19,992 on July 20.
"Key indices are stuck in a range and till we do not find any major trigger, the consolidation is likely to continue," Sameet Chavan, head research, technical and derivatives at Angel One said.
For any kind of revival, he said the first sign of revival would be confirmed once the Nifty sustains above the 19,370 – 19,400 levels, which may then push Nifty towards the next cluster of 19,550 – 19,650.
On the flipside, 19,250 is to be seen as a critical support; because a drift below this would result in a sharp correction towards the major support zone of 19,100 – 19,000 (which seems unlikely at this moment), said Sameet who advised traders to refrain from complacent trades and continue with one step at a time approach.
Rupak De, senior technical analyst at LKP Securities also sees support at 19,250 on the lower end. "A fall below 19,250 may trigger a correction towards 19,000 and beyond. On the higher end, resistance is at 19,500."
Let's take a look at the top 10 trading ideas from experts for the next three-four weeks. Returns are based on the August 18 closing prices:
Expert: Viraj Vyas, CMT, technical & derivatives analyst | institutional equity at Ashika Stock BrokingMishra Dhatu Nigam: Buy | LTP: Rs 390 | Stop-Loss: Rs 365 | Target: Rs 445 | Return: 14 percentUndergoing significant time and price consolidation from 2020 until June 2023, the stock recently achieved a notable breakthrough above Rs 270 levels, thereby initiating a robust impulsive move. Demonstrating a consistent upward trajectory, the stock has consistently established higher highs and higher lows.
Remarkably, even amid market turbulence last week, the stock effectively surmounted its former swing high of Rs 380, sustaining this achievement. With minor fluctuations aside, the stock is projected to maintain its current trajectory, characterized by a trend acceleration phase.

After experiencing a substantial corrective phase following its IPO listing in November 2021, the stock stabilized around June 2022. Over the past 13 months, the stock has been confined within a broad range of Rs 300 to Rs 400. Notably, last week saw a significant breakthrough beyond the upper boundary of this range, accompanied by robust trading volumes.
Historically, extensive consolidations of this nature often prompt swift movements in the breakout direction. Anticipating this pattern, the stock is likely to establish a structure of higher highs and higher lows, indicating the potential for an imminent impulsive move.

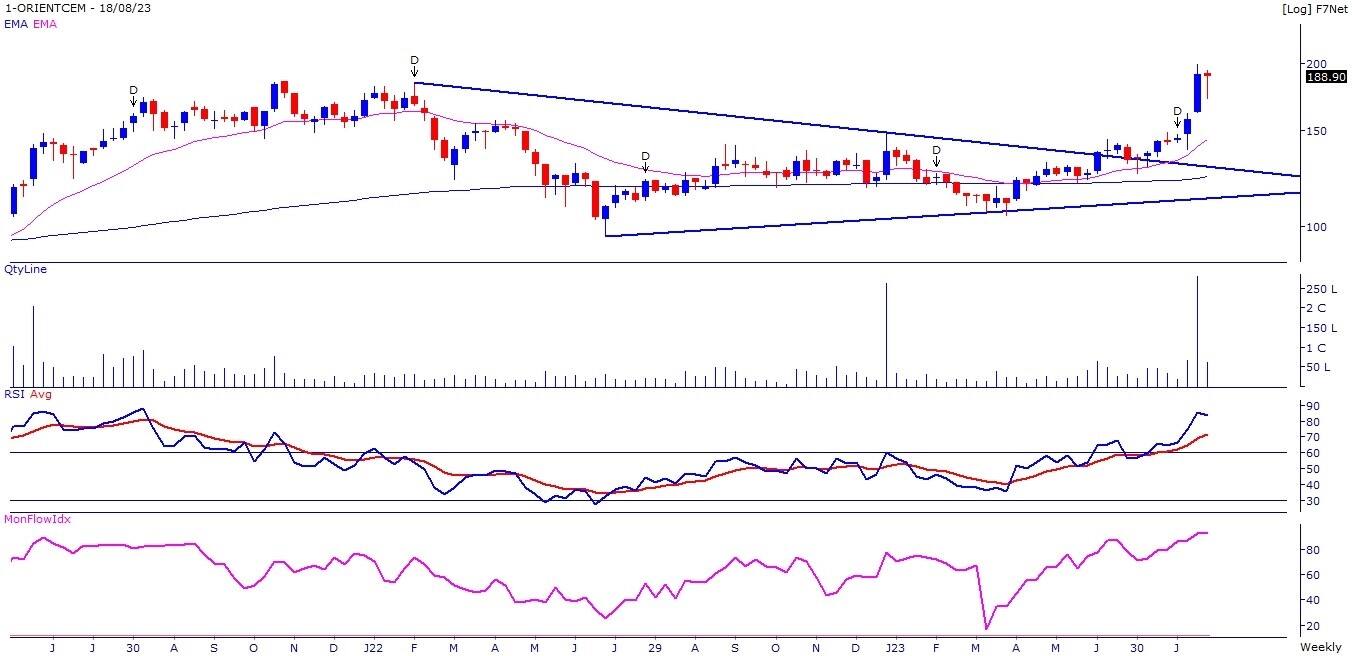
After running correction of last few days, the stock price resumed its uptrend on Friday with higher volumes. Stock price has broken out on the weekly chart by surpassing the previous top resistance of Rs 185.
Momentum Oscillators like - RSI (relative strength index 11) and MFI (money flow index 10) are sloping upwards and placed above 60 on the weekly chart, indicating strength in the current uptrend of the stock.
The stock price has broken out on the weekly and monthly charts on the higher side. Momentum Oscillators like - RSI (11) and MFI (10) are sloping upwards and placed above 60 on the weekly chart, indicating strength in the current uptrend of the stock.
PSU banks as a sector is showing strength on the short and medium term chart.

On week ended August 11, 2023, the stock price had broken out by surpassing resistance of Rs 920 odd levels to close at all time high level. Primary trend of the stock remains positive as stock price is trading above its important moving averages.
Plus DI (directional indicator) is trading above minus DI while ADX (average directional index) line is placed above 25, indicating stock price is likely to gather momentum in the coming days.

The stock has formed a higher bottom at Rs 1,266 compared to Rs 1,251 it formed at the beginning of the month. In the last 7 days, it has lost over 7 percent and is now trading near Rs 1,251.
We believe the primary trend is positive, and based on the last three weeks, the stock may form a double bottom around Rs 1,250. Buying at current levels and placing a stop-loss at Rs 1,245 would provide a good risk-reward ratio.
The stock would face hurdles near Rs 1,330 and Rs 1,370 levels on the upside, which should be the targets for positional traders.
 Max Financial Services: Buy | LTP: Rs 871.5 | Stop-Loss: Rs 840 | Targets: Rs 1,000-1,050 | Return: 20.5 percent
The stock is on the verge of crossing Rs 885 levels, below which the stock has spent almost 18 months. Based on the volume indicator, buyers are turning aggressive which will keep the stock above Rs 885 levels.
Above Rs 885 levels, its next hurdle lies only in Rs 1,000-1,050 zone. Based on key oscillators like MACD (moving average convergence divergence) and DMI (directional movement index), we believe the stock is fully bullish and ready to move higher in the medium term.
A buy is recommended with a stop-loss of Rs 840 for a target of Rs 1,000 and Rs 1,050.

The stock has formed a Dragonfly Doji on a weekly basis, which may be a sign of a trend inverter. However, for that the stock should cross the level of Rs 580, which is the final resistance to the stock.
On the dismissal of Rs 580, the stock may hit the level of Rs 600 and Rs 620 in the coming few weeks. Since the formation is bullish, our strategy should be purchased with a stop-loss at Rs 550.

The stock has seen breaking out of a bullish candle on the weekly timeframe after more than four years with a big bullish candlestick pattern, adding to it the stock is trading and sustaining above all its important EMAs which can be used as a confluence towards the bullish view.
On the indicator front, the Ichimoku Cloud is also suggesting a bullish move as the price is trading above the conversion line, base line and cloud.
Momentum oscillator RSI (14) is at around 66 on the daily time frame indicating strength by sustaining above 50.
Observation of the above factors indicates that a bullish move in EIH is possible for target upto Rs 254. One can initiate a buy trade in between the range of Rs 221-223, with a stop-loss of Rs 203 on daily closing basis.

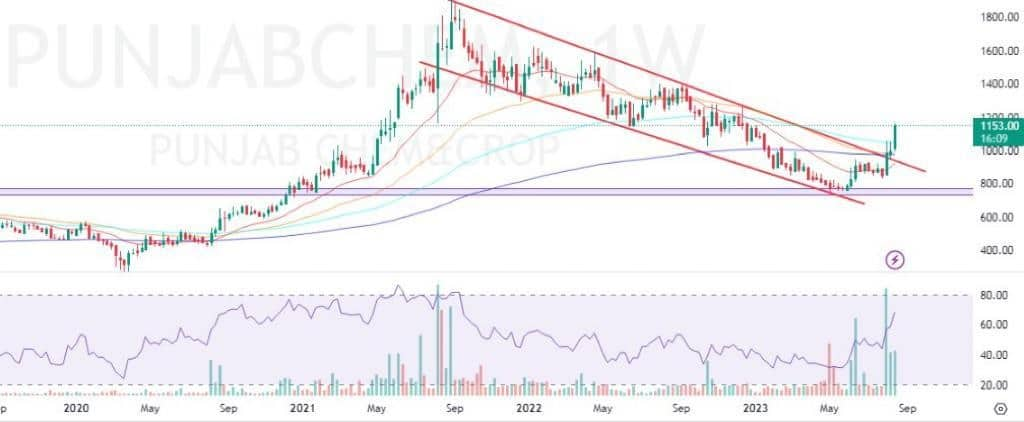
Punjab Chemicals has seen breaking out of a downwards sloping parallel channel pattern with above average volumes and a big bullish candlestick on the daily timeframe. The stock is also trading above important EMAs of 20, 50, 100, and 200-day which indicates strength.
On the indicator front, the supertrend indicator is indicating a bullish continuation, momentum oscillator RSI (14) is at around 79 on the daily time frame indicating strength by sustaining above 50. And the Ichimoku Cloud is also suggesting a bullish move as the price is trading above the conversion line, base line and cloud on the daily timeframe.
Observation of the above factors indicates that a bullish move in Punjab Chemicals is possible for target upto Rs 1,342. One can initiate a buy trade in the range of Rs 1,147-1,151, with a stop-loss of Rs 1,025 on daily closing basis.
Discover the latest Business News, Sensex, and Nifty updates. Obtain Personal Finance insights, tax queries, and expert opinions on Moneycontrol or download the Moneycontrol App to stay updated!
Find the best of Al News in one place, specially curated for you every weekend.
Stay on top of the latest tech trends and biggest startup news.


