


The market made a smooth rebound in the week ended April 26, following 1.65 percent decline in the previous week. The mood remained in favour of bulls, despite investors booking some profits last Friday, forming a dark cloud cover pattern, which is a bearish reversal trend, as experts feel the index has been in an upward sloping channel since the middle of January and, hence, as long as it holds 22,300-22,200 levels on a closing basis, a march towards 22,800 can't be ruled out.
The Nifty 50 during the week rallied 1.23 percent to 22,420 and formed a bullish candlestick pattern with long upper shadow and a small lower shadow on the weekly charts, while major action was reflected in the broader markets, as the Nifty Midcap 100 and Smallcap 100 indices jumped around 4 percent each.
"Despite Friday's setback, the market mostly adopted a 'buy on dip' strategy, maintaining a bullish undertone," Rajesh Bhosale, technical analyst at Angel One, said.
Going ahead, he feels the immediate support is seen around Thursday’s low of 22,300, which coincides with 20-day EMA (exponential moving average), followed by the pivotal support of the bullish gap around 22,200.
According to Jigar S Patel, senior manager - equity research at Anand Rathi, the Nifty is currently trading within a rising channel pattern, suggesting potential bullish momentum if it manages to maintain levels above 22,300 in the current week, with a likely target range of 22,750-22,800.
Additionally, he feels the long-short ratio of foreign institutional investors (FIIs) stands at around 39 percent, indicating limited downside potential.
Hence, immediate resistance levels for the Nifty are anticipated at 22,700-22,800, and a decisive close above this range could trigger renewed buying interest in index futures.
Overall, experts advised traders to monitor these levels and focus on buying on dips while booking profits at higher levels.
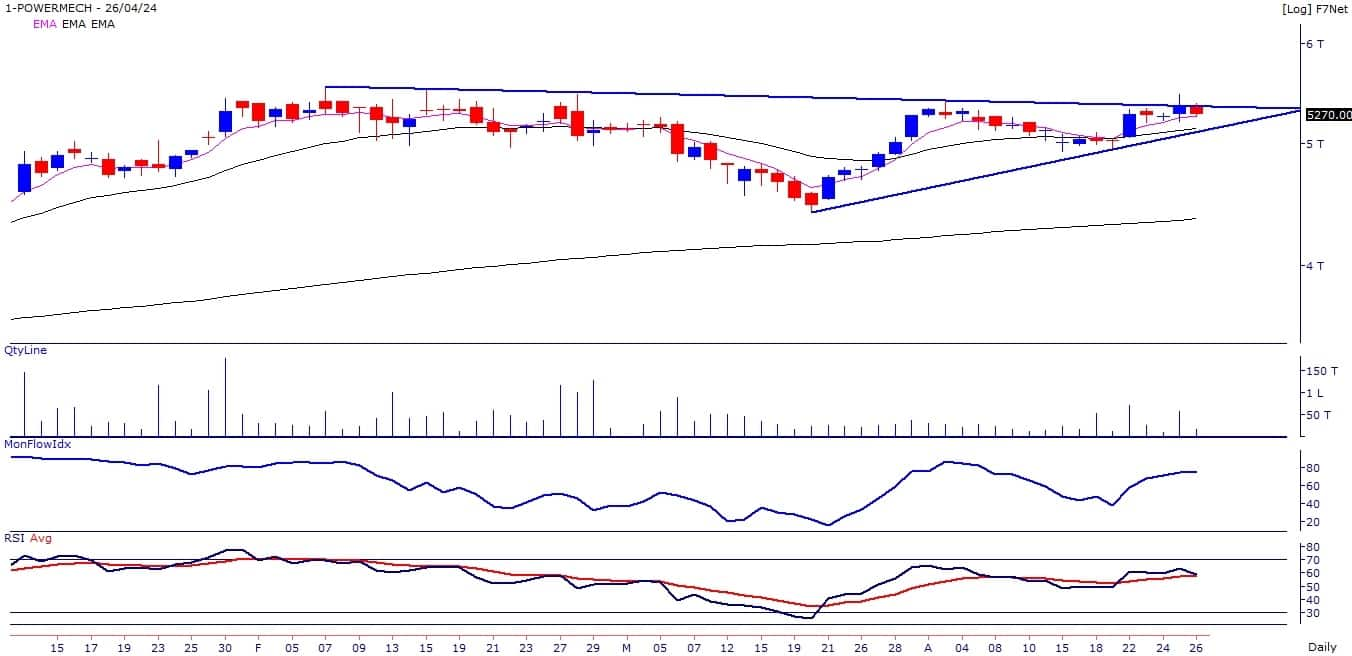
Primary trend of the stock has been bullish with higher tops and higher bottoms on the weekly chart. Short term trend of the stock remains strong as stock price is trading above its 11 and 20-day EMA (exponential moving average).
Momentum indicators and oscillators like RSI (relative strength index) and MFI (money flow index) are in rising mode and placed above 60 on the weekly and monthly chart, indicating strength in the current uptrend of the stock. Stock price is on the verge of breaking out from the symmetrical triangle on the daily chart.
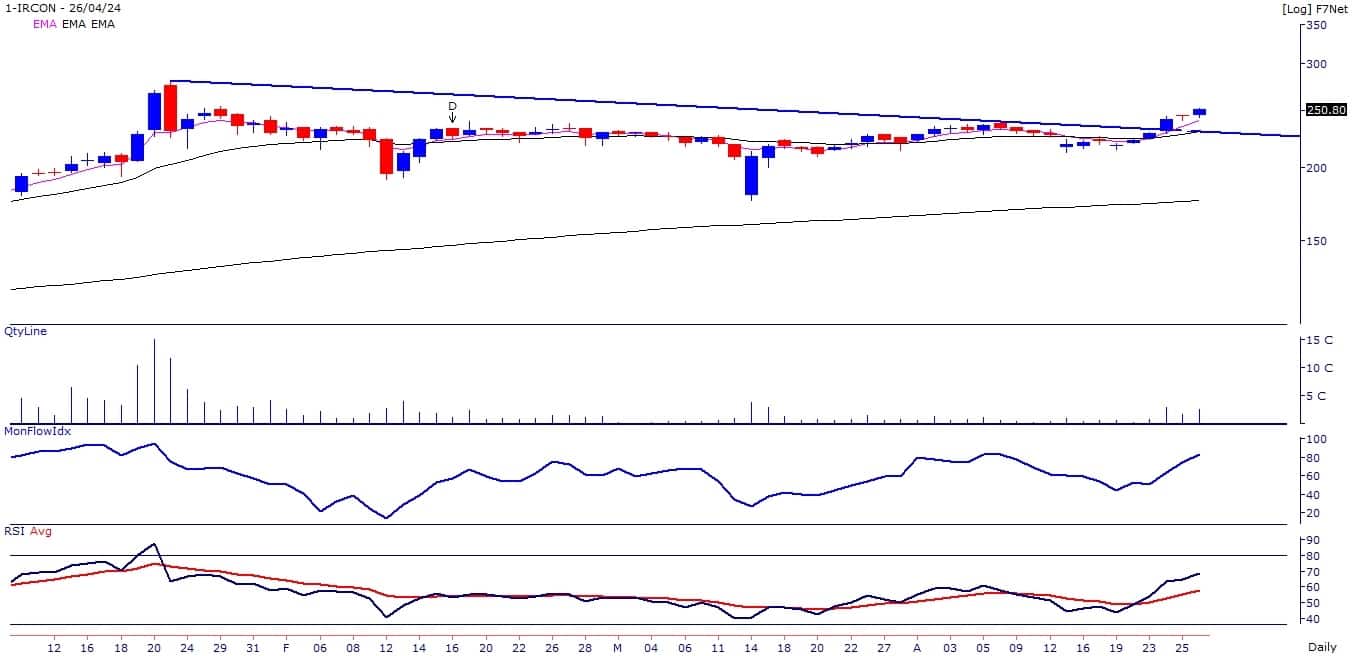
The stock price has broken out on the daily chart with higher volumes to close at three-month high. Moreover it has broken out from the downward sloping trendline.
Primary trend of the stock has been bullish with higher tops and higher bottoms on the weekly chart. Momentum indicators and oscillators are showing strength in the current uptrend of the stock.
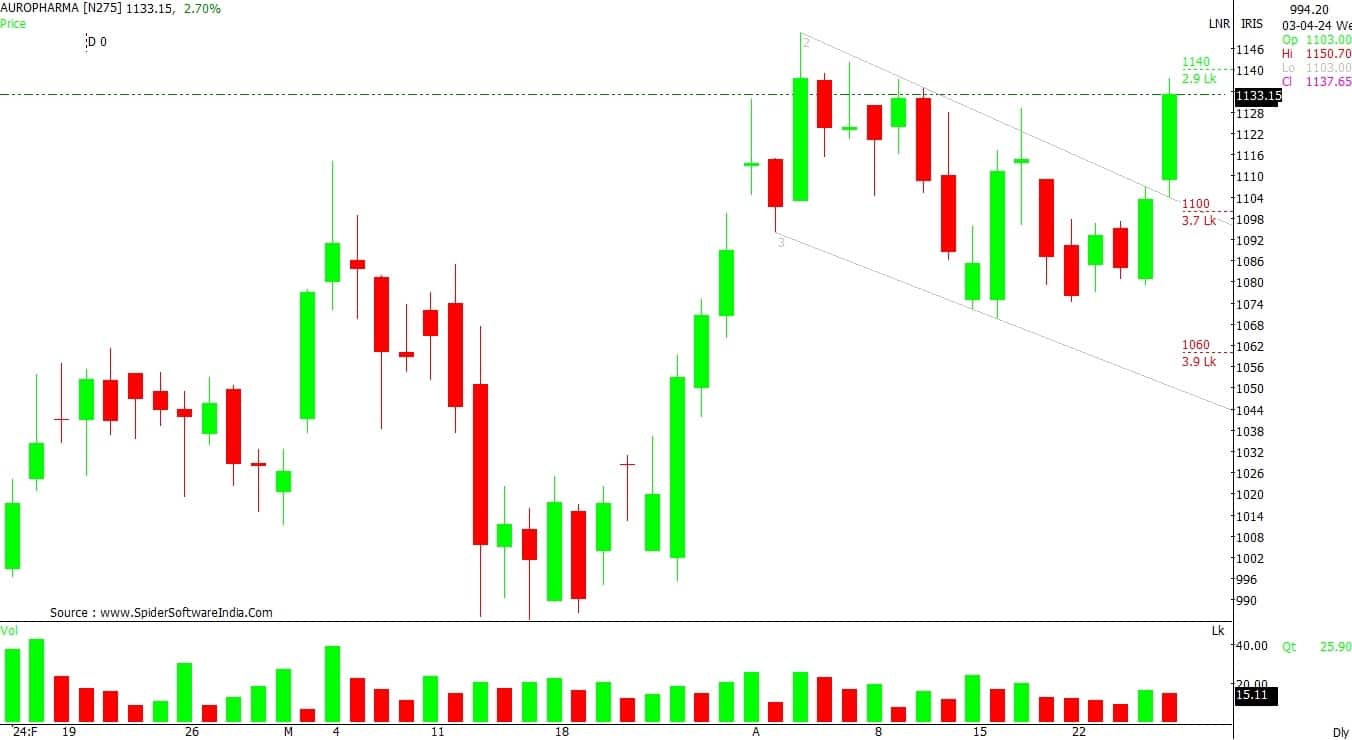
The stock price has broken out on the daily chart from the consolidation of last many weeks where it closed at highest level since February 3, 2024. Moreover, it has broken out from the downward sloping trendline adjoining highs of February 5 and April 10, 2024.
The stock price has been taking support at 20-week EMA. Momentum indicators and oscillators like MFI and RSI are sloping upwards and placed above 60 on the daily chart, suggesting strength in the current bullish trend.

Post decline from the higher levels, the counter rebounded from its demand zone and witnessed a steady recovery from the lower levels. Additionally, on the daily charts, the counter has given a breakout from its sloping channel formation.
The up moves in the counter suggest a new leg of bullish trend from the current levels.
The counter had been in a strong uptrend in the past many months. Post remarkable up move the counter witnessed consolidation on higher levels.
Additionally, there is a fresh breakout from the ascending triangle chart formation on the daily scale. As a result, the comfortable close above its breakout zone suggest upward momentum to persist in the coming horizon.

The counter is in the accumulation zone where it is trading in a rangebound mode for the past few sessions. The texture of the chart formation and technical indicator RSI is indicating that the counter is in oversold territory.
Therefore, it is very likely to rebound from current levels for a new leg of the up move in the near term.

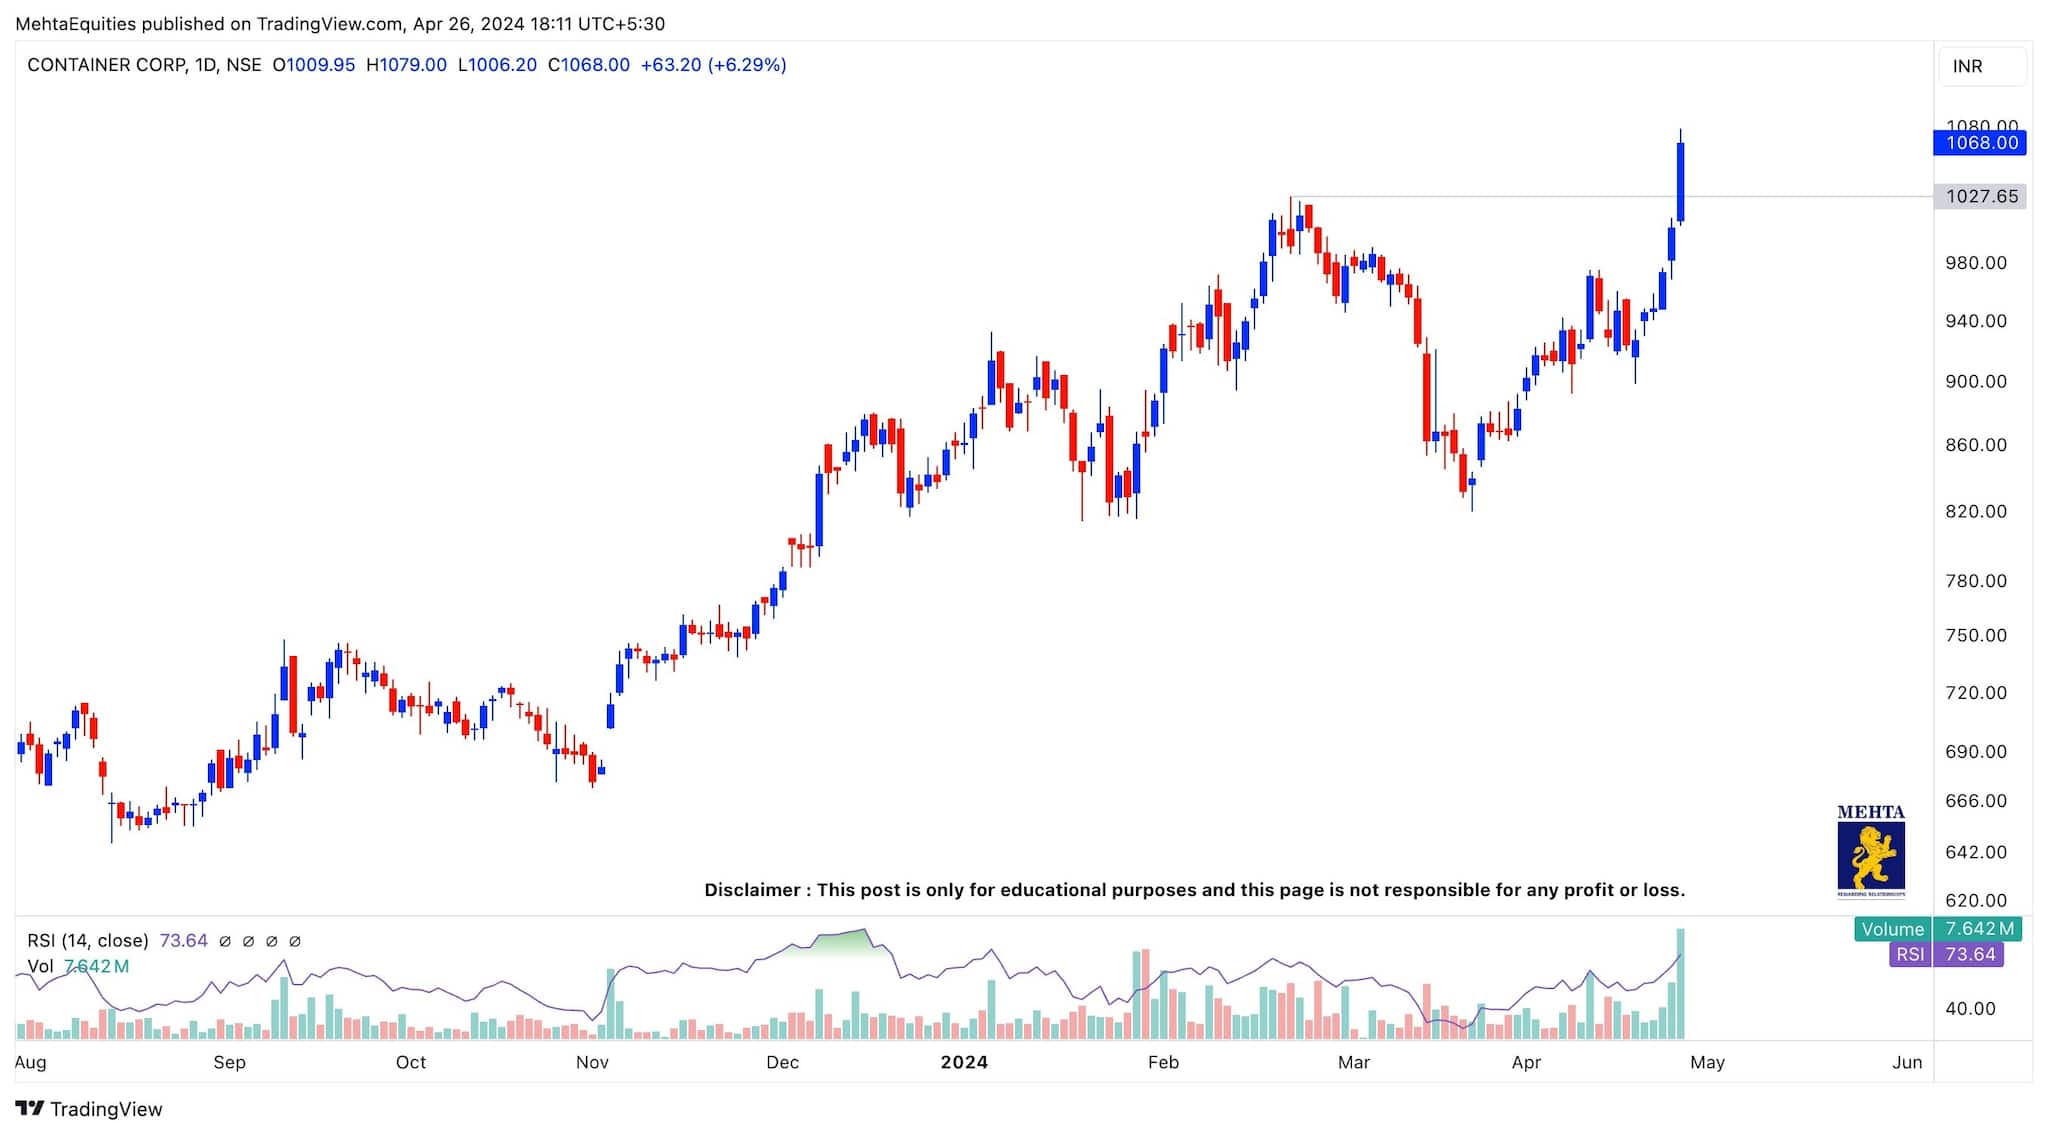
The stock has given a strong breakout above its all-time high mark of Rs 1,027.65 on its daily charts and has successfully managed to close above the same.
With the RSI (14) near 74, the overall momentum looks strong, and with volumes nearly three times its average (30) days volume, there is another positive indicator for the stock. A strict stop-loss should be kept at Rs 1,000 mark for potential upside targets of Rs 1,200 and above.
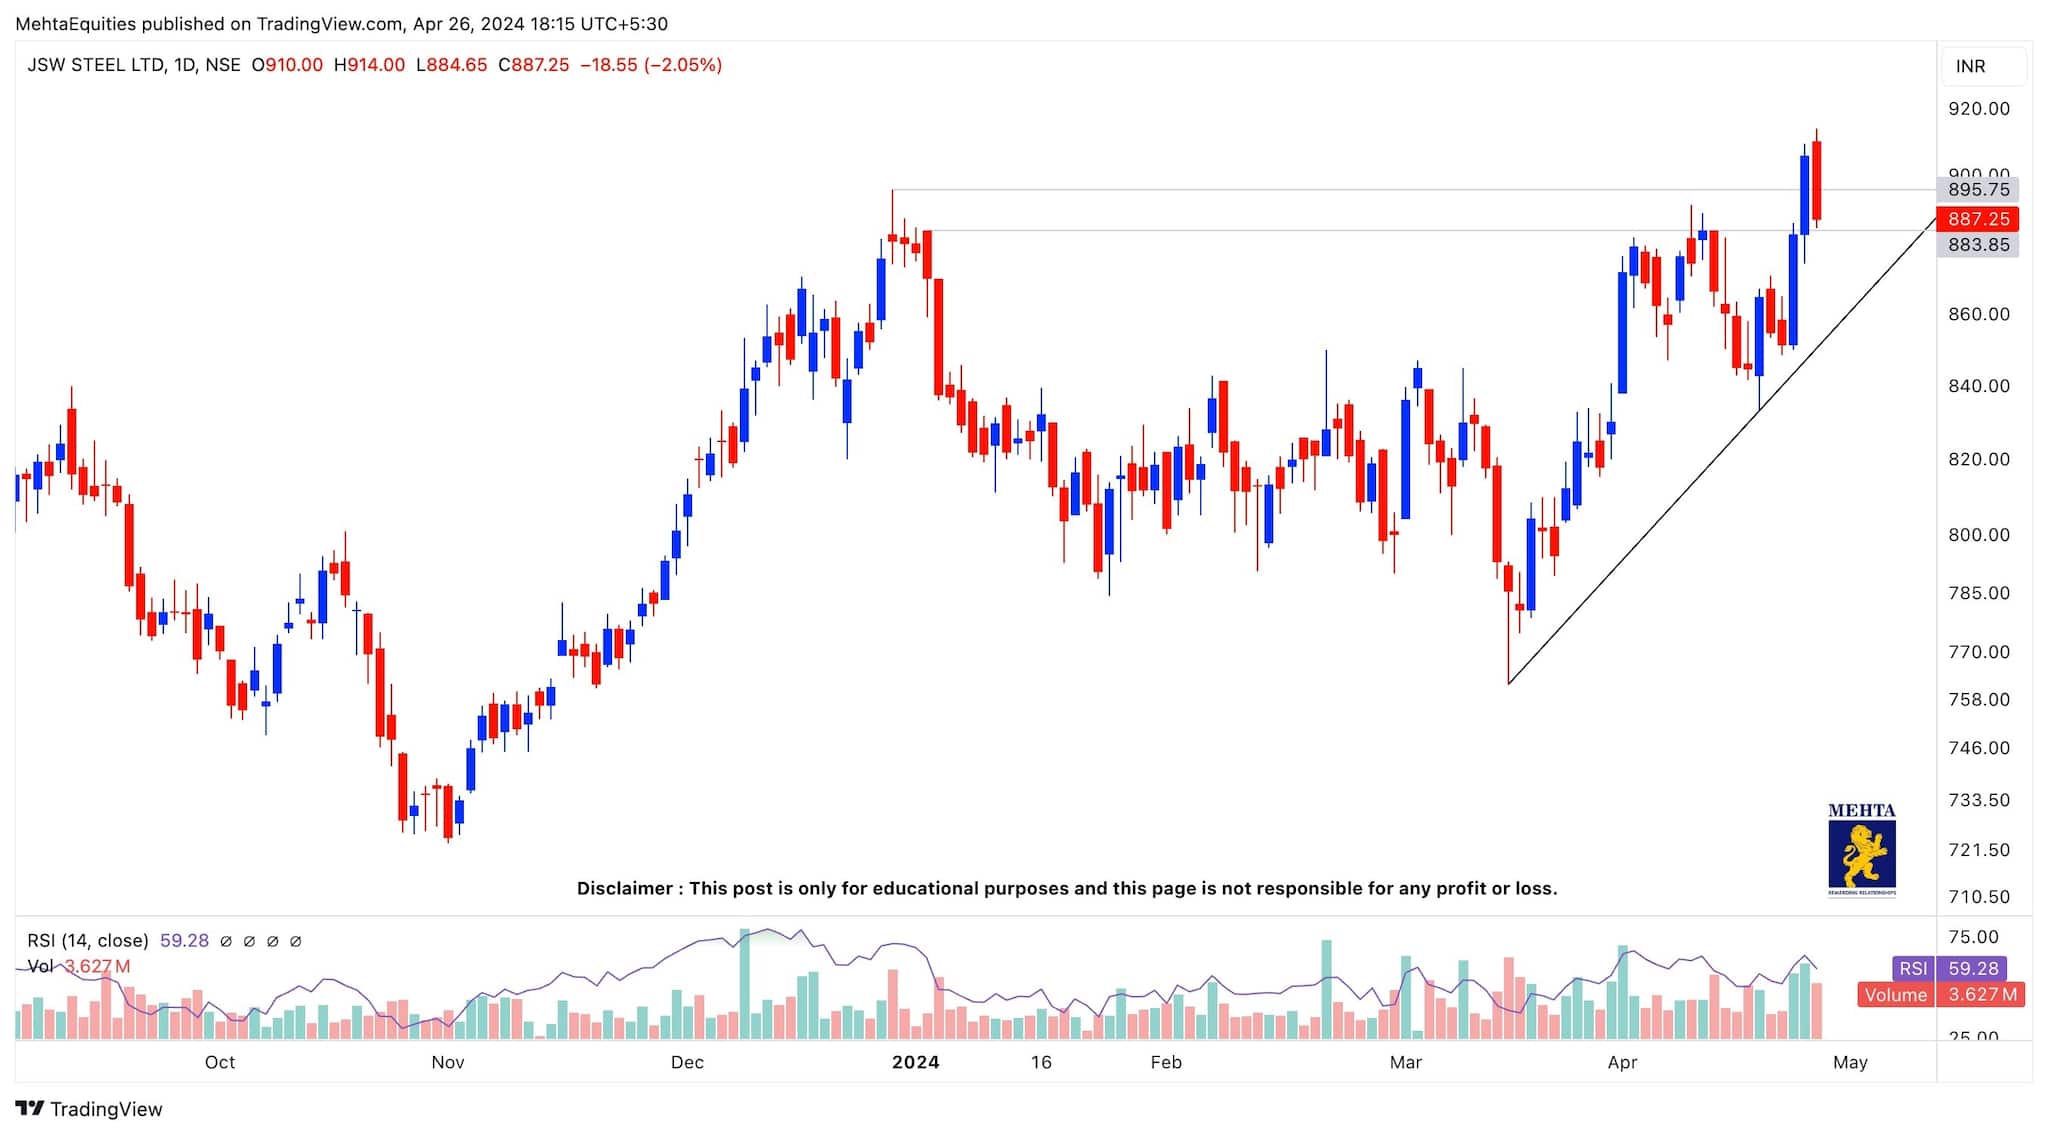
The stock has seen a good re-test of its breakout mark of Rs 883-895 on its technical charts after breaking out above its resistance mark of Rs 895 in a Cup & Handle formation on the daily charts.
With the RSI (14) around 60, momentum appears to be on the positive side for the stock. At present levels, the risk-reward ratio looks favourable for buying. A strict stop-loss should be placed at Rs 860 to manage risk well, and potential targets of Rs 1,000 and above can be expected for JSW Steel.
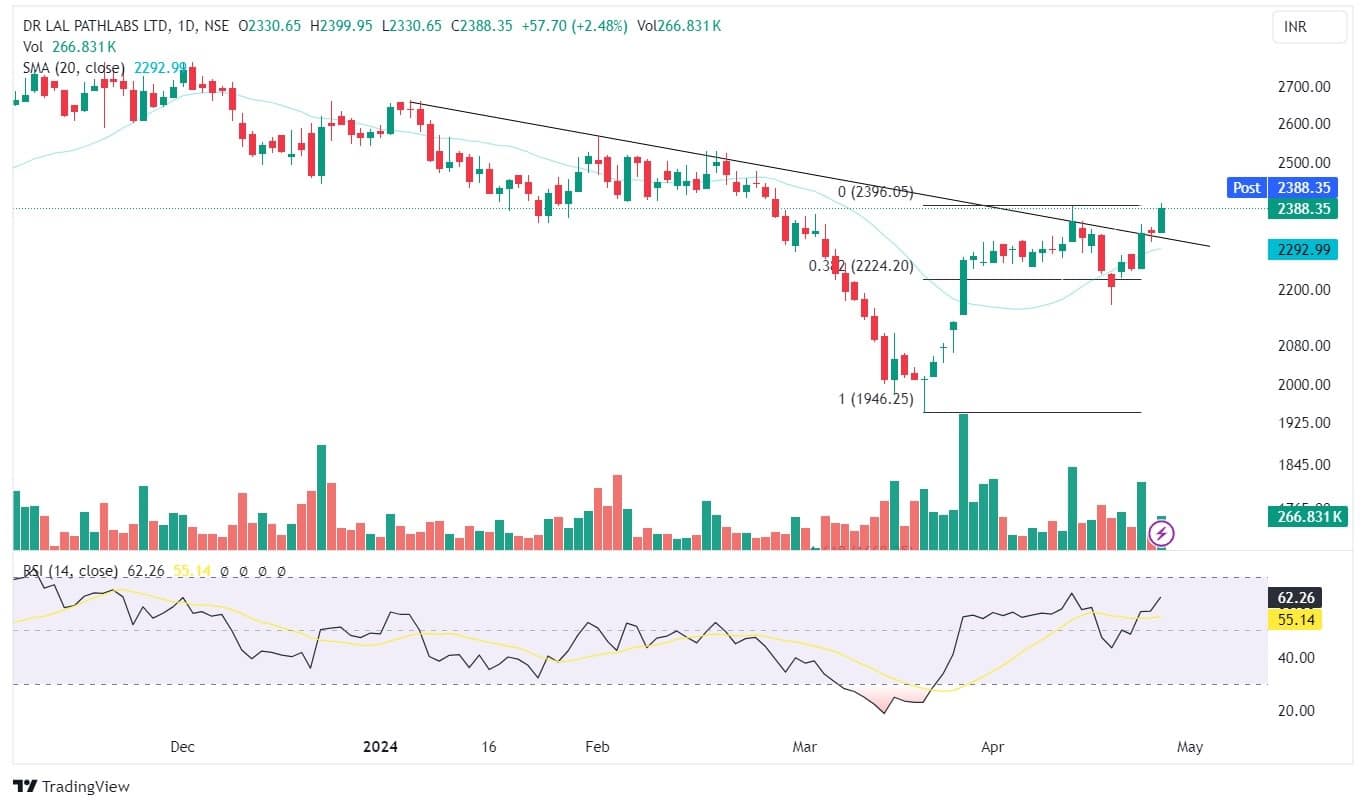
Dr Lal PathLabs stock is forming higher highs and higher lows indicating a sustained uptrend. It is trading comfortably above its short-term (20-day) and medium-term (50-day) moving averages.
The RSI is comfortably holding at 62 and is steadily rising. The stock continues to hold levels above Rs 2,330, which previously served as resistance, indicating buying interest among short-term traders.
Hence, based on the above technical structure, one can initiate a long position at CMP Rs 2,388 for a target price of Rs 2,520. The stop-loss can be kept at Rs 2,310.
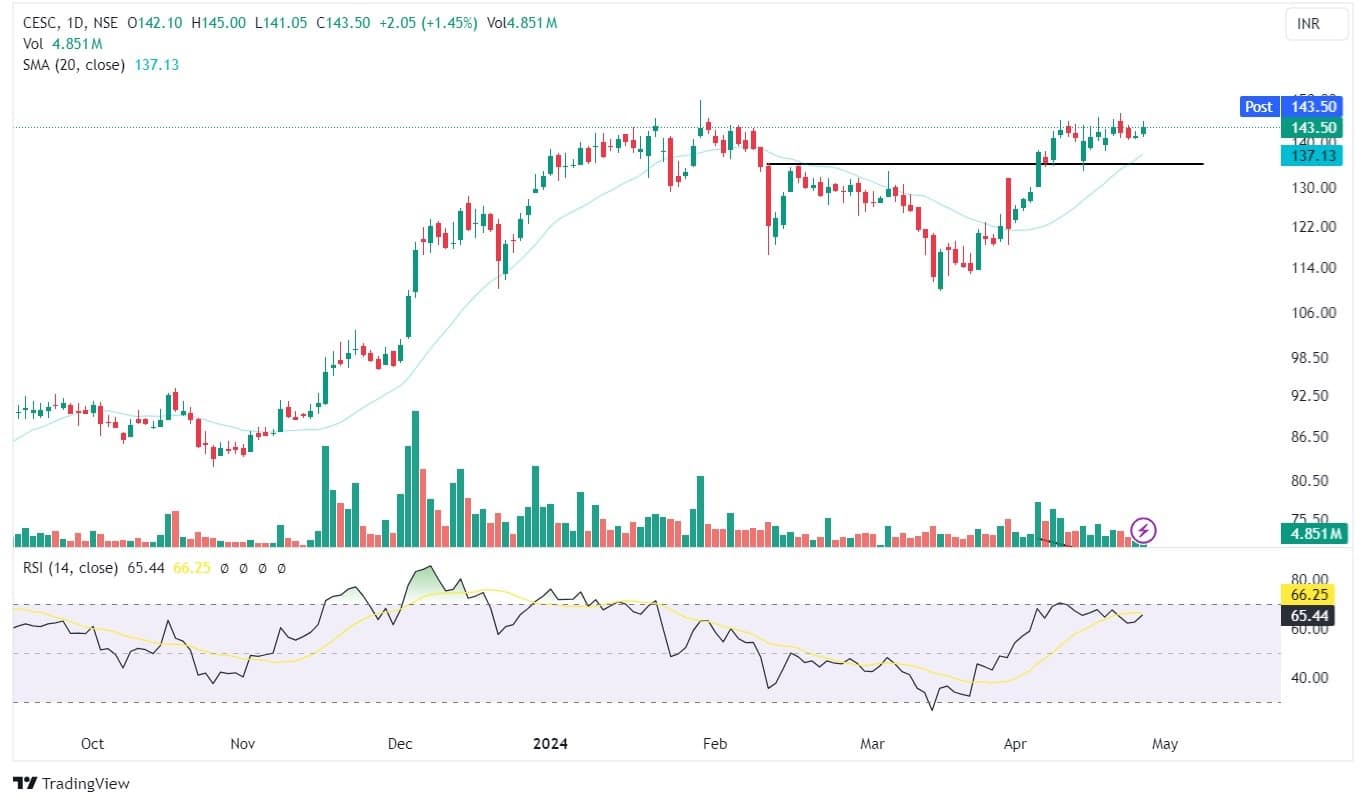
The CESC stock has been consolidating near its strong support zone in recent trading sessions. The stock is currently trading above all of its short-term moving averages. Meanwhile, the RSI remains at 65. There is minor resistance near the Rs 147 level; once this is overcome, the stock might inch higher to set a new high.
Hence, based on the above technical structure, one can initiate a long position at CMP Rs 143.50 for a target price of Rs 158. The stop-loss can be kept at Rs 135.
Discover the latest Business News, Sensex, and Nifty updates. Obtain Personal Finance insights, tax queries, and expert opinions on Moneycontrol or download the Moneycontrol App to stay updated!
Find the best of Al News in one place, specially curated for you every weekend.
Stay on top of the latest tech trends and biggest startup news.


