


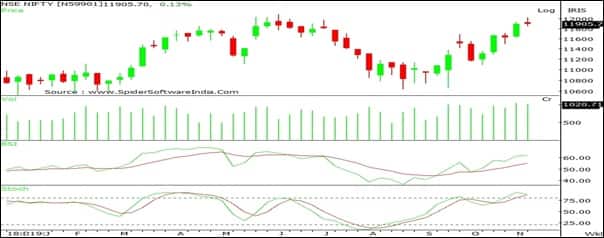
Nifty started the week on a flat note and traded with extreme volatility on either side within narrow range (12,040-11,850). Nifty closed at 11,908 with a gain of 18 points on a weekly basis.
On the weekly chart, the index has formed a 'Doji' candlestick formation indicating indecisiveness among market participants regarding the direction.
The index is moving in a Higher Top and Higher Bottom formation on the weekly chart indicating positive bias.
The chart pattern suggests that if Nifty crosses and sustains above 12,050 levels it would witness buying which would lead the index towards 12,150-12,300 levels.
However, if index breaks below 11,850 level it would witness selling which would take the index towards 11,750-11,600.
Nifty is trading above its 20, 50, 100 and 200-day SMA's which are important short term moving average, indicating positive bias in the short term. Nifty continues to remain in an uptrend in the medium term, so buying on dips continues to be our preferred strategy. For the week, we expect Nifty to trade in the range of 12,150-11,650 with mixed bias.
The weekly strength indicator RSI and momentum oscillator Stochastic have both turned positive and are above their respective reference lines indicating positive bias.
Bank Nifty started the week on a flat note but continued its previous week's positive momentum to end the week on a positive terrain. Bank Nifty closed at 30,749 with a gain of 419 points on a weekly basis.
On the weekly chart, the index has formed a bullish candle carrying either side shadows representing volatility as well as indecisiveness regarding the future direction. The index is moving in a Higher Top and Higher Bottom formation on the weekly chart indicating positive bias.
The chart pattern suggests that if Bank Nifty crosses and sustains above 31,000 levels it would witness buying which would lead the index towards 31,000-31,650 levels.
However, if the index breaks below 30,450 level it would witness selling which would take the index towards 30,000-29,650. Bank Nifty is trading above 20, 50, 100 and 200 day SMA's which are important short term moving average, indicating negative bias in the short to medium term.
Bank Nifty continues to remain in an uptrend in the medium term, so buying on dips continues to be our preferred strategy. For the week, we expect Bank Nifty to trade in the range of 31,100-29,700 with mixed bias.

The weekly strength indicator RSI and momentum oscillator Stochastic have both turned positive and are above their respective reference lines indicating positive bias.
Here is the list of stocks which could return 7-15 percent in short term:Navin Fluorine International | CMP: Rs 856.65 | Buying Range: Rs 830-815 | Stoploss: Rs 798 | Target: Rs 880-905 | Return: 7-10 percent
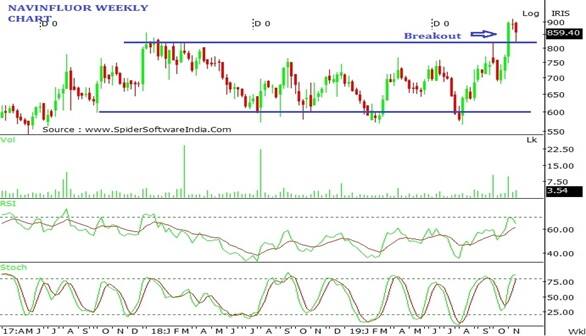
On the weekly chart, stock price has decisively broken out consolidation range of Rs 825-580 levels on closing basis.
Since past couple of weeks, the stock is sustaining above the breakout zone which signals bullish sentiments. This breakout was accompanied with huge volumes indicating increased participation.
The weekly strength indicator RSI and the momentum indicator Stochastic both are in positive territory which supports upside momentum to continue in near term. Stock price is sustaining well above its 20 and 50 and 100-day SMA which supports bullish sentiments ahead.
Max Financial Services | CMP: Rs 477.2 | Buying Range: Rs 465-455 | Stoploss: Rs 440 | Target: Rs 500-515 | Return: 9-12 percent
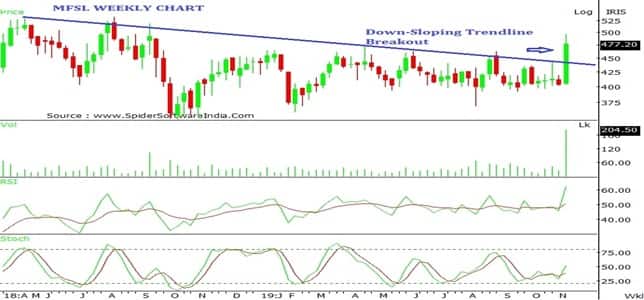
On the weekly chart, stock price has decisively broken out from its Down Sloping Trendline on closing basis and sustaining above the same. This breakout has accompanied with increase in volumes which supports bullish sentiments.
The weekly strength indicator RSI and the momentum indicator Stochastic both are in positive territory which supports upside momentum to continue in near term. Stock price is sustaining well above its 20 and 50 day SMA which supports bullish sentiments ahead.
Quess Corp | CMP: Rs 533 | Buying Range: Rs 525-515 | Stoploss: Rs 500 | Target: Rs 560-580 | Return: 8-12 percent

On the weekly chart, stock price has decisively broken out consolidation range of Rs 490-425 levels on closing basis and sustaining above the same. This breakout has accompanied with good volumes which supports bullish sentiments ahead.
The weekly strength indicator RSI and the momentum indicator Stochastic both are in positive territory which supports upside momentum to continue in near term. Stock price is sustaining well above its 20 day SMA which supports bullish sentiments ahead.
Kolte-Patil Developers | CMP: Rs 270.85 | Buying Range: Rs 265-260 | Stoploss: Rs 249 | Target: Rs 290-303 | Return: 10-15 percent

On the weekly chart, stock price has decisively broken out from its Down Sloping Trendline of Rs 235 levels and sustaining above the same. On the daily and weekly chart the stock has witnessed shift of trend to the upward forming a series of higher Tops and higher Bottoms.
The weekly strength indicator RSI and the momentum indicator Stochastic both are in positive territory which supports upside momentum to continue in near term. Stock price is sustaining well above its 20 and 50 day SMA which supports bullish sentiments ahead.
(The author is DGM - Research ( Head Technical & Derivatives Research) at Axis Securities Limited.)Disclaimer: The views and investment tips expressed by investment expert on moneycontrol.com are his own and not that of the website or its management. Moneycontrol.com advises users to check with certified experts before taking any investment decisions.
Discover the latest Business News, Sensex, and Nifty updates. Obtain Personal Finance insights, tax queries, and expert opinions on Moneycontrol or download the Moneycontrol App to stay updated!
Find the best of Al News in one place, specially curated for you every weekend.
Stay on top of the latest tech trends and biggest startup news.


