


Nifty IT is poised for a technical breakout, marked by a substantial long build-up in stocks such as HCL Tech, Tech Mahindra, Persistent and TCS on the derivatives front. Meanwhile, Mphasis, Infosys, Birla Soft and LTIM exhibit short covering, signaling a bullish outlook.
 Technical chart of Nifty IT | Source: Emkay Global
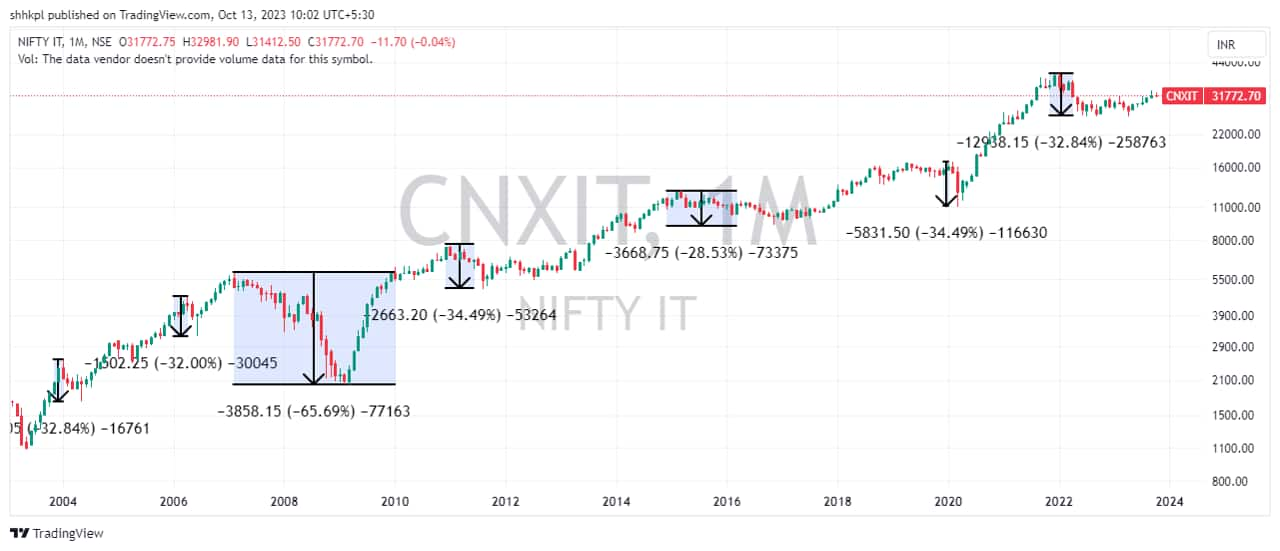
The technical chart of Nifty IT, sourced from Emkay Global, provides insights. According to Kapil Shah, Senior Technical Analyst at Emkay Global Financial Services, "Nifty IT Monthly Chart (Intensity of price fall – Price-wise correction) reveals that since 2004, the index has experienced seven falls. Six out of seven declines were in the range of 30 to 35 percent. The recent correction stands at 33 percent, followed by a time-wise correction."
 Nifty IT index quarterly chart (time cycle) | Source: Emkay Global
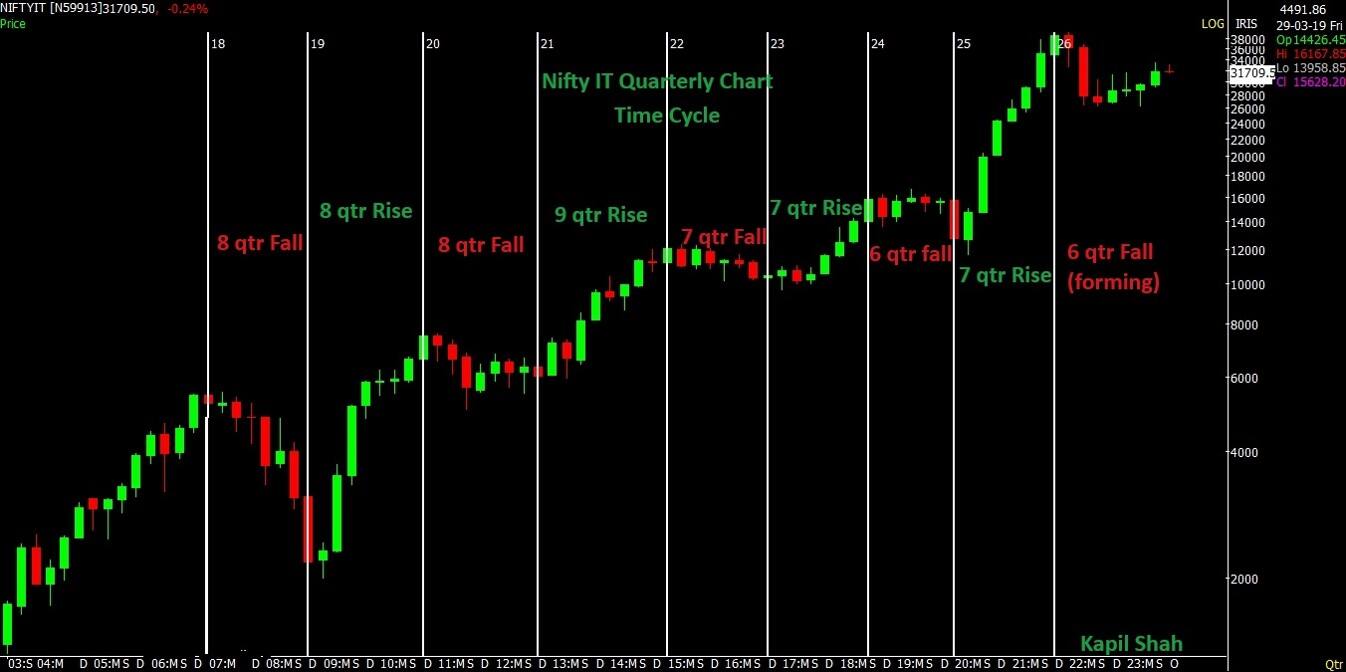
Examining the Nifty IT quarterly chart, it becomes evident that the sector has followed a discernible cycle since 2007. Typically, the up and down swings occurred over 7 to 9 quarters. However, Shah notes that the recent quarter has witnessed a 6-quarter decline so far. Drawing from past occurrences, this suggests an imminent end to the downward cycle.
 Nifty IT index seasonal performance data | Source: Emkay Global
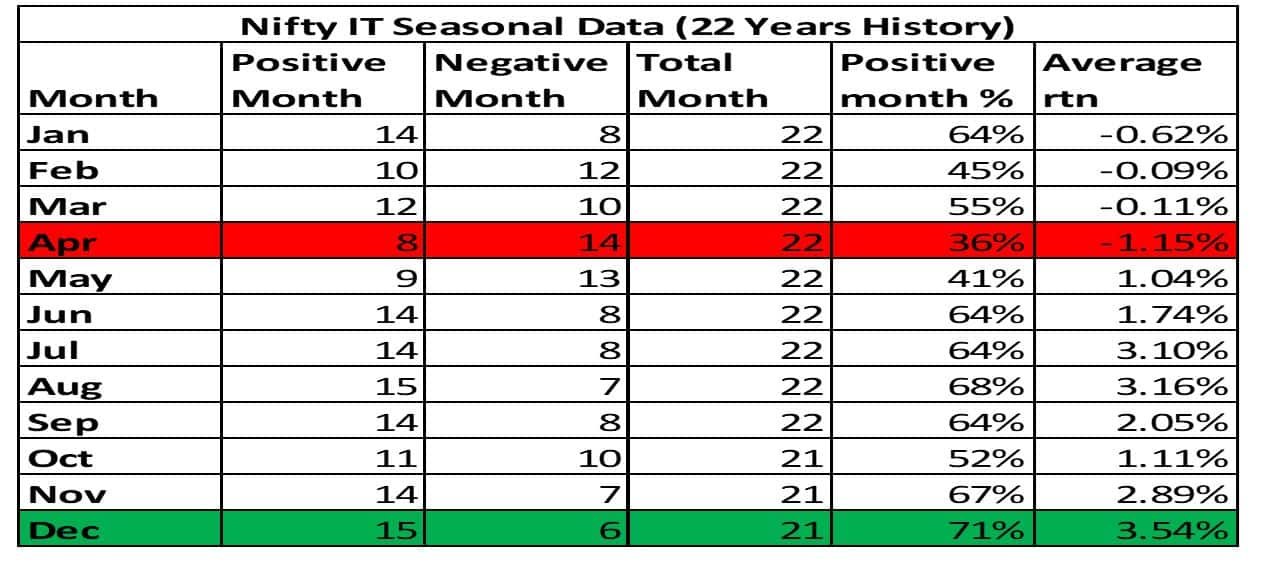
As per Emkay Global's Nifty IT seasonal performance data comparing historical monthly average performance, November month is good month and December is even better month. Shah suggests that IT index can be accumulated in recent weakness to ride upcoming seasonal positive months.
 Nifty IT monthly chart | Source: Emkay Global
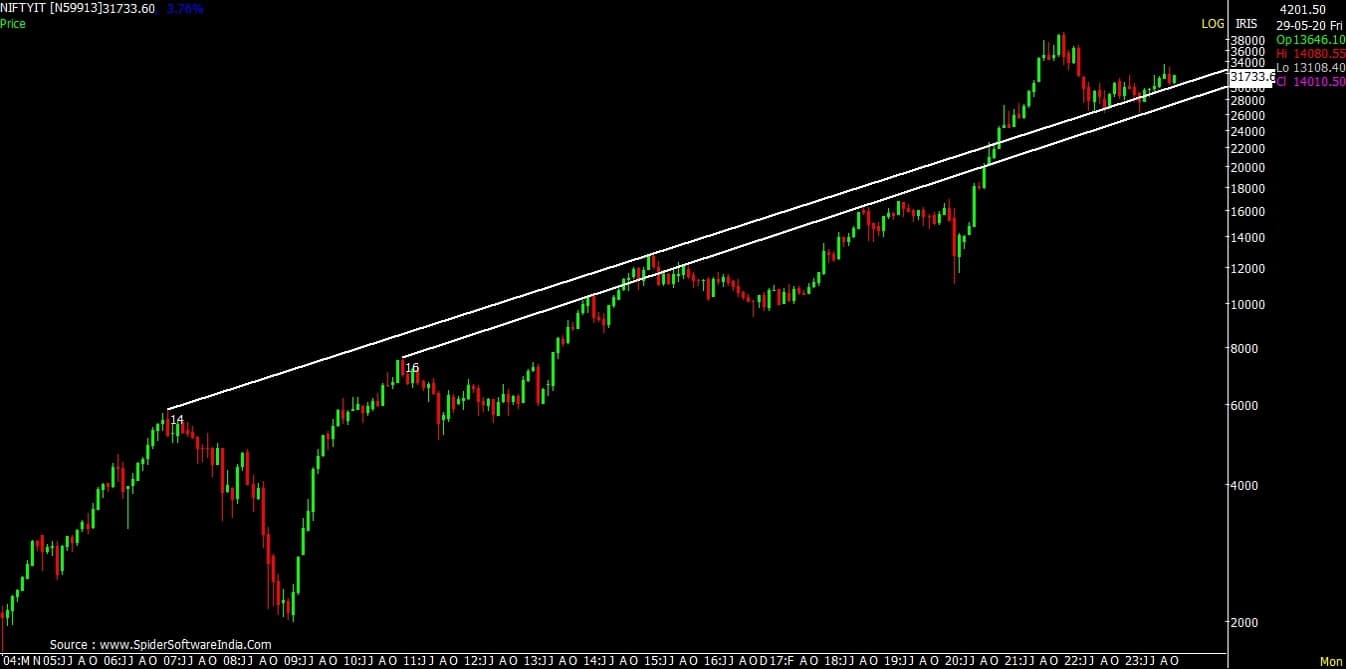
The Nifty IT Monthly Chart indicates that the recent decline found support at the long-term rising trendline. Kapil Shah has noted that this is a significant long-term bullish development.
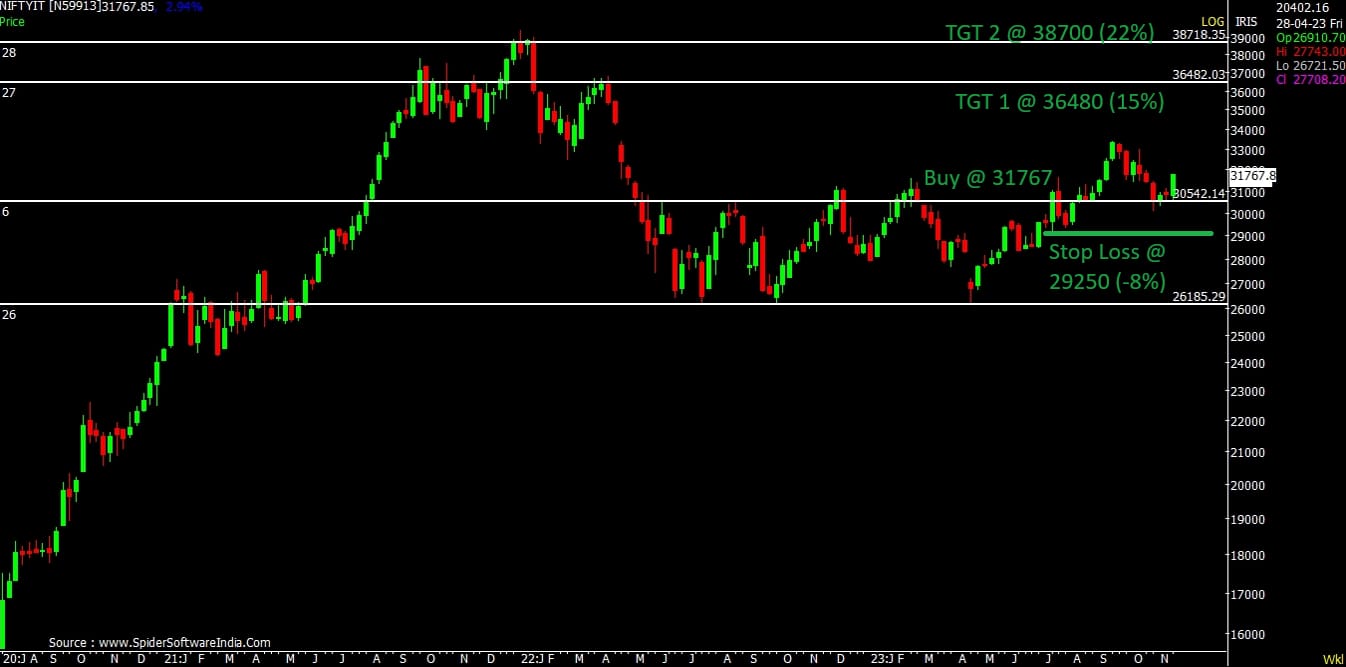 Nifty IT index weekly chart | Source: Emkay Global
Analyzing the Nifty Weekly chart, Shah remarks, "The index has broken out of an 80-week consolidation patch, resembling an accumulation zone. From a pattern perspective, it indicates a double bottom breakout. The index is retracing to the earlier breakout, a healthy sign. It is advisable to buy the index through ETF in the accumulation zone, with a range of CMP 31700 to 30500. The stop loss can be set at 29250, with an upside potential at 36500 and 38700. Holding the index for a 2-year period could yield better returns."
Stock perspectiveFrom a stock perspective, Kapil Shah's preferred bets are large-cap stocks, with INFY, HCLTECH, TECHM, and TCS being his top choices.
Disclaimer: The views and investment tips expressed by investment experts on Moneycontrol are their own and not those of the website or its management. Moneycontrol advises users to check with certified experts before taking any investment decisions.
Discover the latest Business News, Sensex, and Nifty updates. Obtain Personal Finance insights, tax queries, and expert opinions on Moneycontrol or download the Moneycontrol App to stay updated!
Find the best of Al News in one place, specially curated for you every weekend.
Stay on top of the latest tech trends and biggest startup news.


