


Since the election results, Nifty has been forming a high wave candle pattern of the range of about 430 points. Bank Nifty has followed suit with a wide range of about 1,500 points. Through RSI, the momentum indicator has moved above 60 levels, there are divergences visible on weekly and monthly charts on both indices. This could be a sign of impending weakness, especially considering that the price has formed indecisive candle patterns on weekly charts.
An analysis of price movement post election results for the last three instances reveals an interesting structure. Whenever the price has moved in a big range on the results day forming a high wave candle pattern, the subsequent price action for almost over the next three months has been restricted within this range. One can thus expect a range movement in both the indices in the ensuing quarter, with the respective highs of 12,070 and 31,780 holding good for some time now.
Also, ADX, the trend strength indicator, is sloping up at present. Once its slope begins to turn down from its current levels, that would signal an end to the current uptrend for the time being.
While a majority of the sectoral indices formed bearish price patterns last week, the stocks in the IT sector told a different story. A few stocks such as Infosys, Wipro and HCL Technologies are poised for an upmove in the coming days.
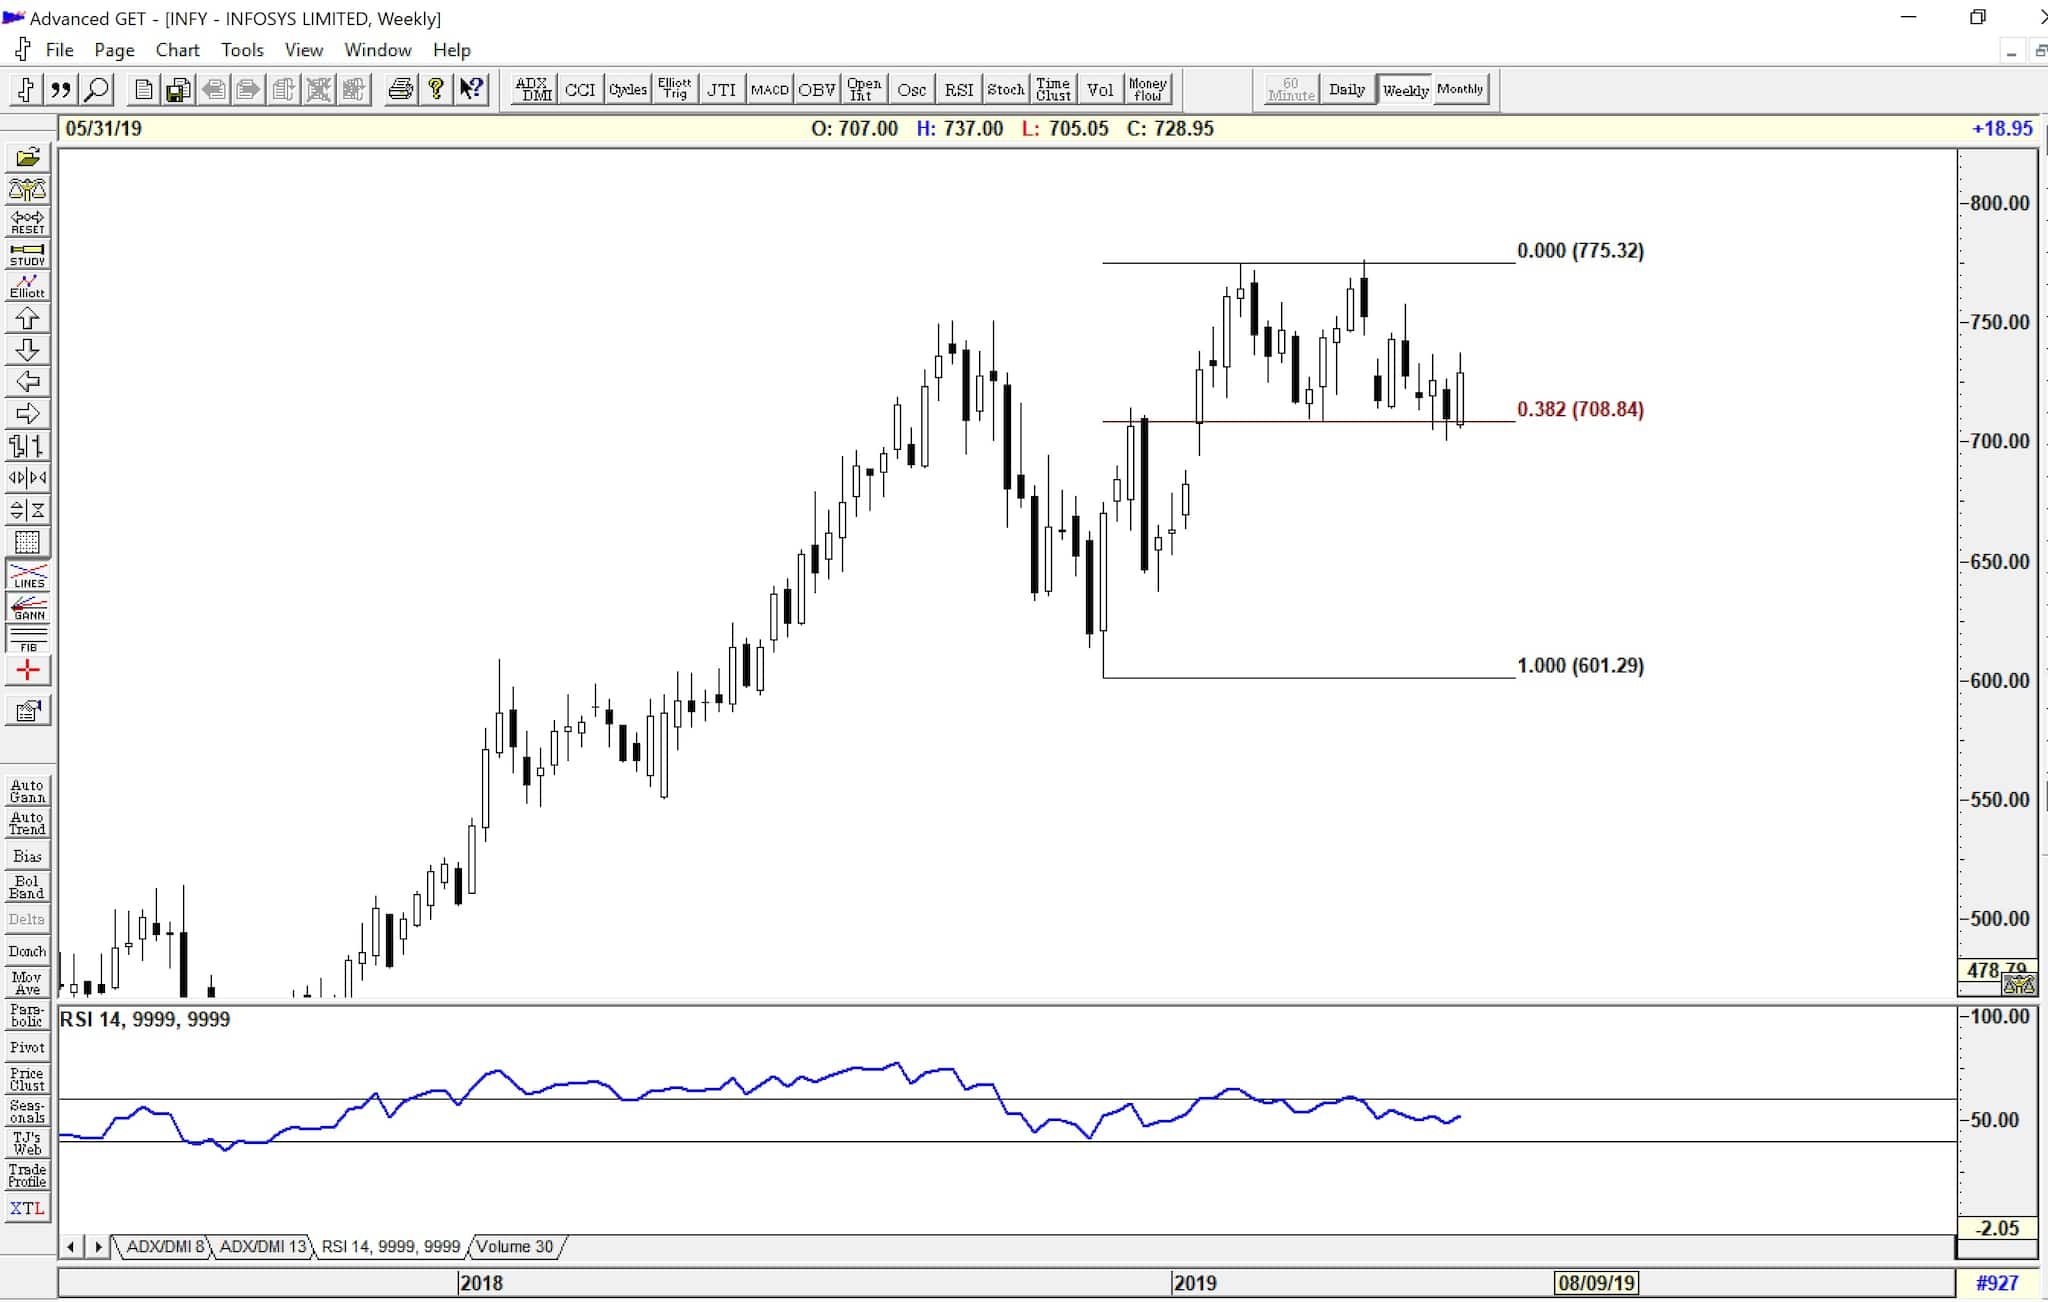
Infosys – Weekly ChartWe notice a bullish engulfing pattern formed in the weekly chart of Infosys after taking support at 38.2 percent retracement of the short downtrend. One could consider going long at current levels with a stop loss below Rs 700 for a target of Rs 802.
Wipro formed a bullish candle pattern while RSI took support at 60 levels – the lower support zone for a bullish market. This could be a low-risk opportunity for a long trade with a stop loss below Rs 279 for a target of Rs 306.

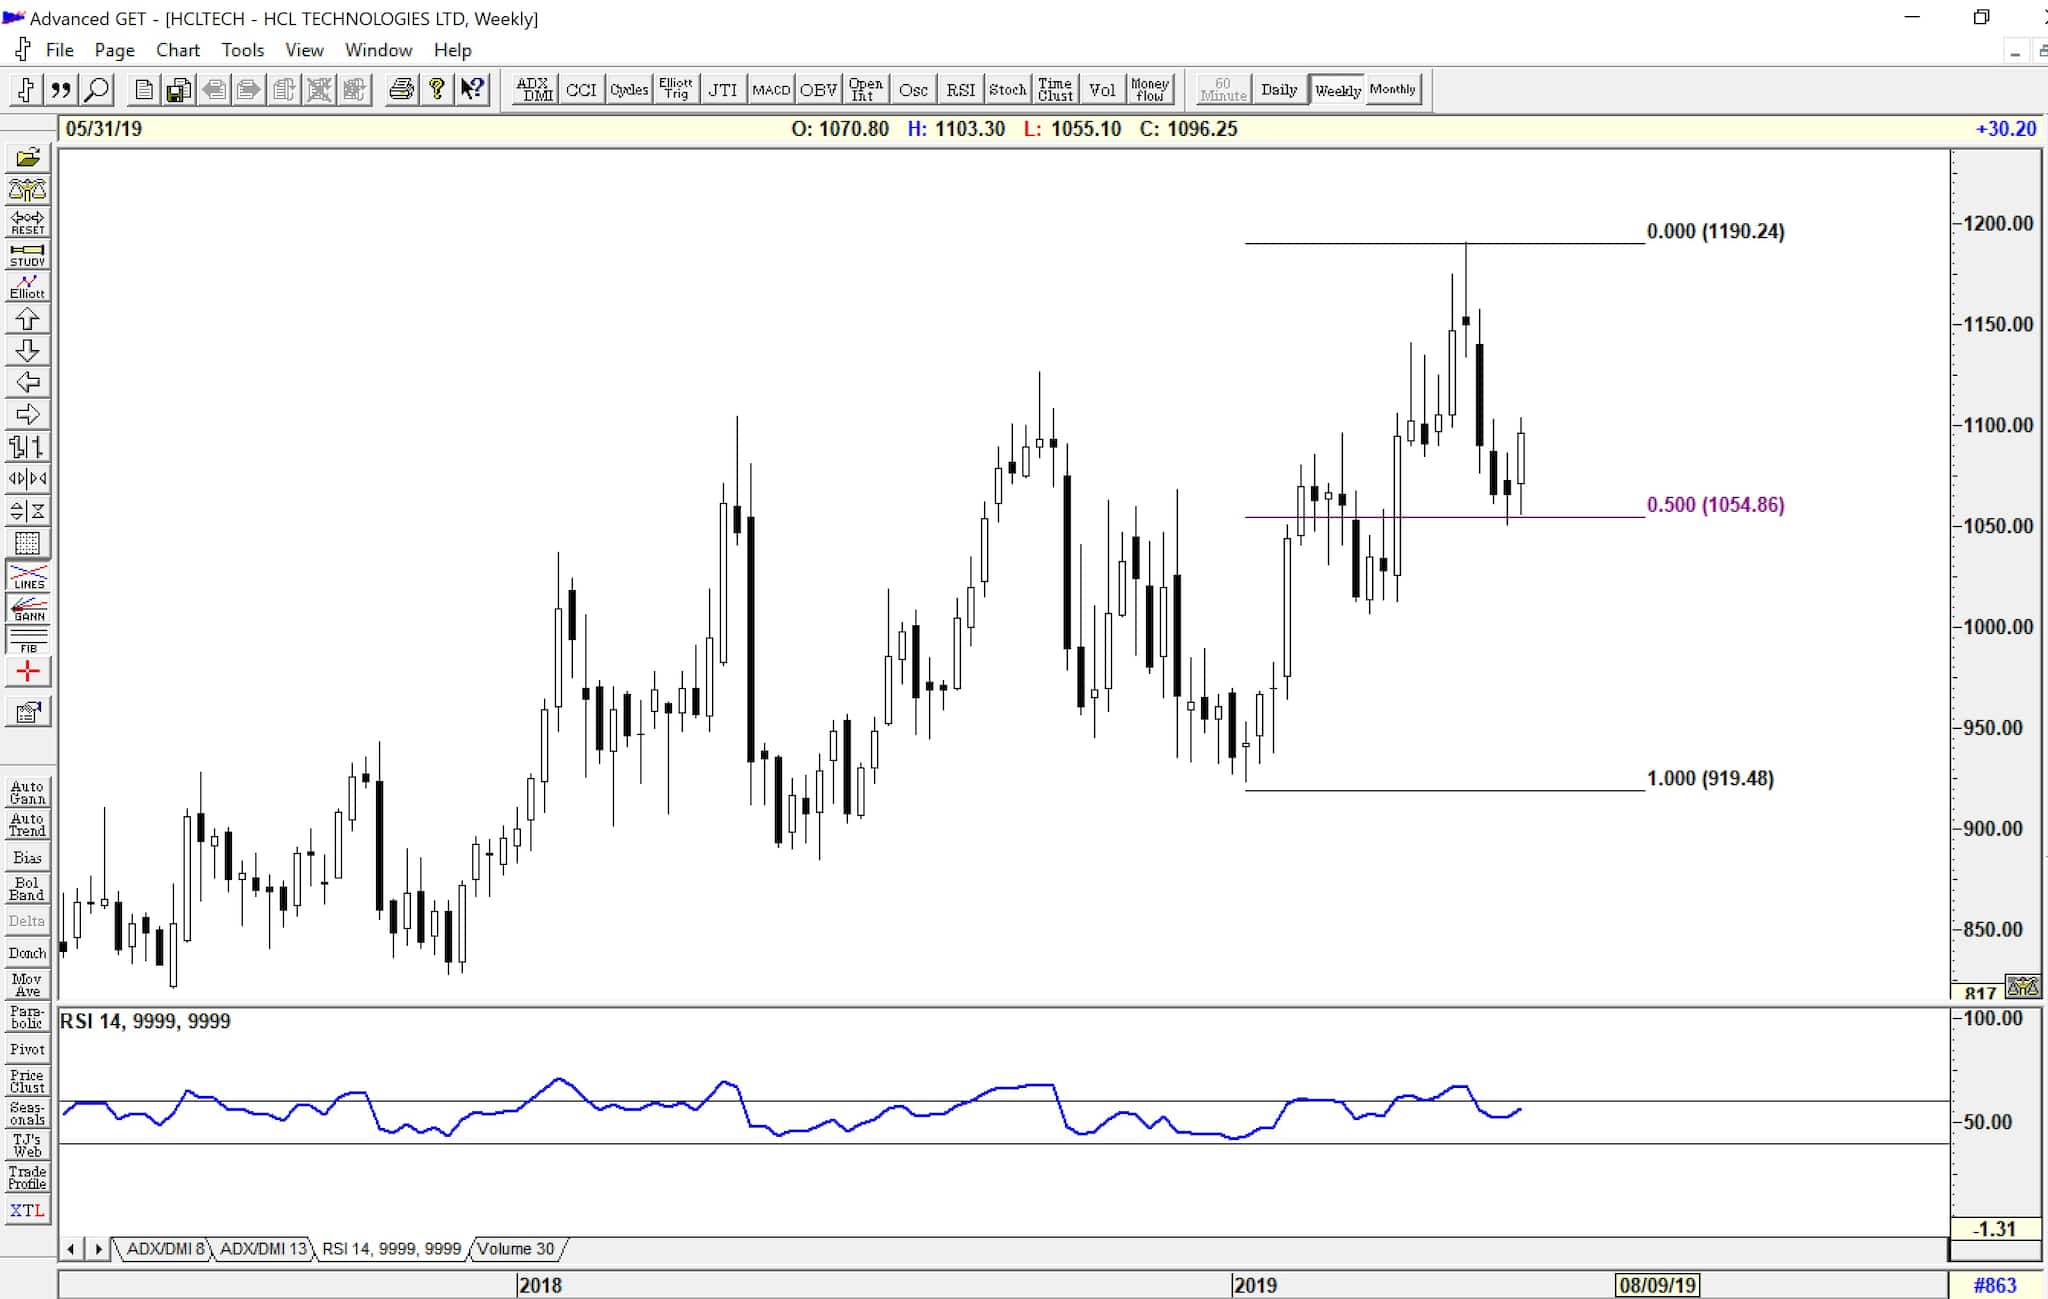
HCL Tech too has formed a bullish candle pattern at Fibonacci support zone of 50 percent retracement of the last downswing. Here too, one could go long with a stoploss below Rs 1,050 for a target of Rs 1,220 on the upside.
Disclaimer: The views and investment tips expressed by investment expert on Moneycontrol.com are his own and not that of the website or its management. Moneycontrol.com advises users to check with certified experts before taking any investment decisions.
Discover the latest Business News, Sensex, and Nifty updates. Obtain Personal Finance insights, tax queries, and expert opinions on Moneycontrol or download the Moneycontrol App to stay updated!
Find the best of Al News in one place, specially curated for you every weekend.
Stay on top of the latest tech trends and biggest startup news.


