


The Nifty index opened on a positive note on June 1 but saw strong resistance at 18,600 levels and fell below 18,500 mark in the 2nd half of the session. The Nifty broke the previous day’s low and ended at 18,488, down 0.25 percent.
On the daily time frame, the index formed a bearish candle and closed at a 4-day low after filling the rising gap which shows profit booking has happened at higher levels.
The momentum indicator RSI (relative strength index) is in sync with the price and formed a bearish hinge at the overbought region indicating a slowdown of the positive momentum.
The Nifty has its crucial resistance at 18,580 (day high), followed by 18,662 (3-day high). While support on the downside is placed at 18,333 (5-day low) followed by 18,200 (swing low). Traders should expect the index to move lower to 18,333, followed by 18,200.
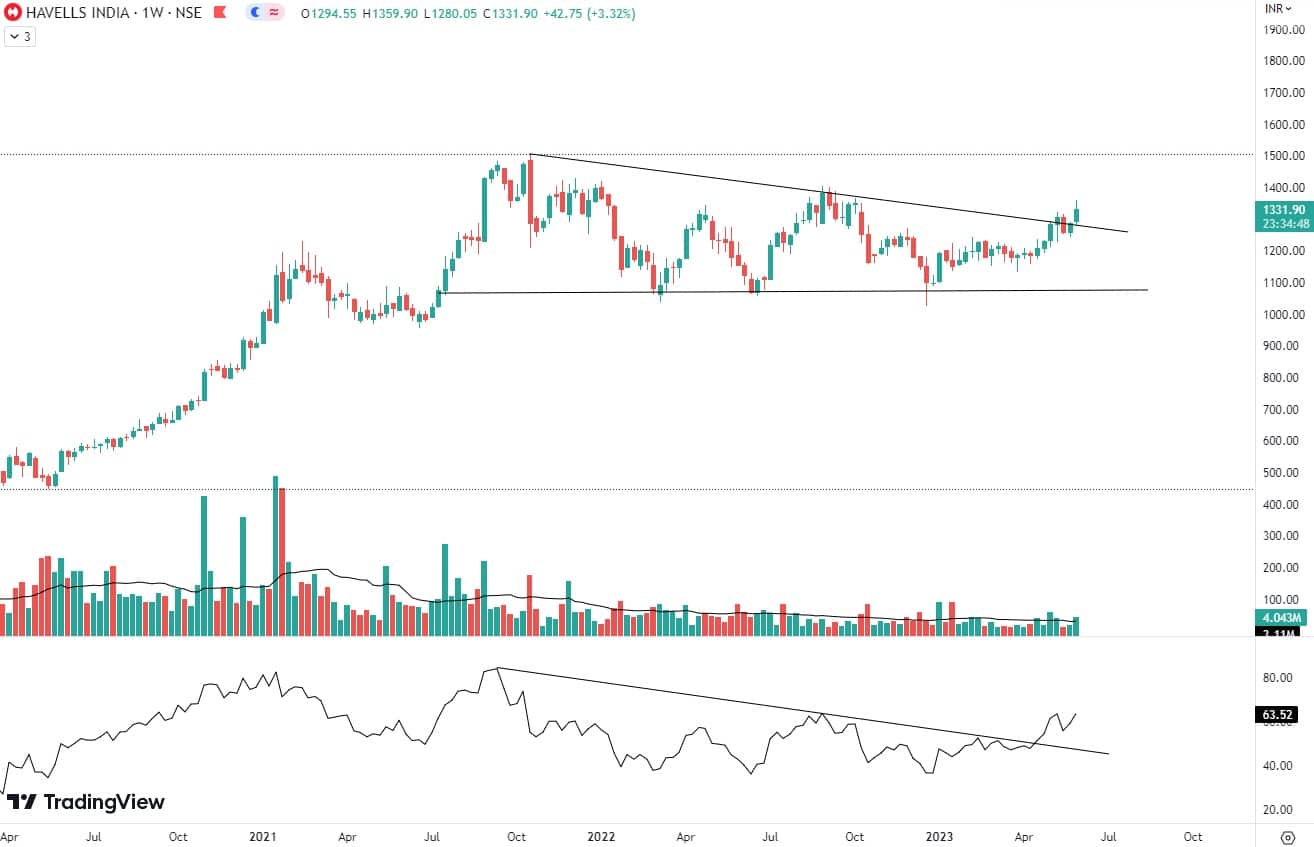
Here are three buy calls for the next 2-3 weeks:Havells India: Buy | LTP: Rs 1,331.90 | Stop-Loss: Rs 1,250 | Target: Rs 1,500 | Return: 12.6 percent
The stock can be found trading above key support of Rs 1,075 level very prudently and has made a solid base at the same level. In the latest week, the stock has given a breakout of Descending Triangle Pattern, indicating a continuation of the trend to the upside.
On the daily timeframe, the stock is above its key moving averages of 50, 100, and 200-day EMA (exponential moving average), confirming the presence of an uptrend.
The momentum indicator RSI on the weekly timeframe has shown a breakout too reflecting the presence of positive momentum. We expect the prices to move higher to Rs 1,500 level where the stop-loss must be Rs 1,250 strictly on the closing basis.
REC: Buy | LTP: Rs 140.60 | Stop-Loss: Rs 133 | Target: Rs 160 | Return: 14 percent
The stock can be found trading above multi–year levels of 2017 which tells that the stock already is in strong momentum.
The stock currently retested the Rounding Bottom pattern and has shown a bounce to the upside. The breakout was witnessed in late April 2023.
Additionally, the RSI on the weekly as well as the daily timeframe is rising and has sustained well above the 60 mark which reflects the presence of positive momentum.
Going ahead we expect the prices to move higher to the level of Rs 160, where the stop-loss must be Rs 133 on the closing basis.

Olectra Greentech: Buy | LTP: Rs 761.80 | Stop-Loss: Rs 720 | Target: Rs 890 | Return: 17 percent
The stock price has sustained well post showing a “V Shape” recovery from the lower levels of Rs 374.10 (February 2023). A fresh breakout of the Bullish Pennant pattern can be observed on the weekly charts.
The breakout can be confirmed as it is accompanied by higher volumes.
Additionally, the RSI on the weekly timeframe is rising and has sustained well above the 50 mark reflecting the presence of positive momentum.
We expect the prices to move higher to the level of Rs 890, where the stop-loss must be Rs 720 on the closing basis.


Discover the latest Business News, Sensex, and Nifty updates. Obtain Personal Finance insights, tax queries, and expert opinions on Moneycontrol or download the Moneycontrol App to stay updated!
Find the best of Al News in one place, specially curated for you every weekend.
Stay on top of the latest tech trends and biggest startup news.


