Moneycontrol PRO
Loans
HomeNewsAlcohol

TheAlcohol-o-nomicsNumber-crunching India’s high

India is the world’s third-largest market for alcoholic beverages, with an estimated value of $35 billion. The spirit segment, which includes whisky and rum, is expected to grow to $41 billion by 2022. So, how much are Indians drinking, what is their poison and what does it mean for the domestic industry?

Indians are drinking more than ever. One in seven Indians in the 10-75 age group use alcohol, a 2019 government survey found. Rapid urbanisation, rising income, easy availability and changing attitude towards alcohol and lifestyle are contributing to growing consumption in India.

But some things haven’t changed—India’s love for hard liquor, heavy drinking, men out-drinking women by a mile and preference for country liquor as well as the so-called Indian-Made Foreign Liquor (IMFL).

India’s high spirits make it the third-largest market—after China and Russia—for alcoholic beverages in the world, with an estimated value of $35 billion.

The per capita consumption of (pure) alcohol in India was reported at 5.7 litres a year in 2016, up from 4.3 litres in 2010 and 2.4 litres in 2005, a 2018 WHO report said.

Total consumption—considering only drinkers—is 14.6 litres a year, which is lower compared to the world average of 15.1 litre.

Alcoholic beverages are broadly classified as beers, wines and spirits. The spirit segment in India, which includes whisky, brandy, rum and vodka, is expected to grow by 25 percent to Rs 2.92 lakh crore ($41 billion) by 2022, according to Euromonitor International.

Per capitaAlcohol consumption

India
  • 5.7
  • 14.6
China
  • 7.2
  • 12.9
Brazil
  • 7.8
  • 19.3
Russia
  • 11.7
  • 12.9
USA
  • 9.8
  • 13.7
UK & North
Ireland
  • 11.4
  • 15.6
France
  • 12.6
  • 16.7
Germany
  • 13.4
  • 16.9
Turkey
  • 2
  • 28.5
Thailand
  • 8.3
  • 20.3
Indonesia
  • 0.8
  • 3.4
Pakistan
  • 0.3
  • 26
Sri Lanka
  • 4.3
  • 14.9
UAE
  • 3.8
  • 20.5
World
  • 6.4
  • 15.1
Alcohol per capita (15+) consumption (in litres of pure alcohol)
Total alcohol per capita (15+) consumption, drinkers only (in litres of pure alcohol), 2016
Source: WHO - Global status report on alcohol and health 2018

About14.6 percent of the population in the 10-75 age group use alcohol, a 2019 survey by the government revealed.

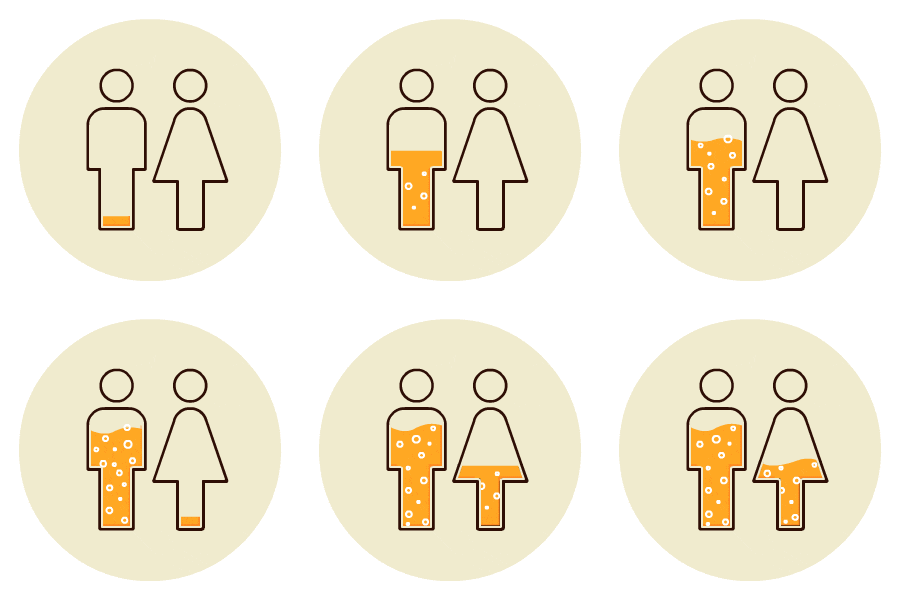
The use of alcohol is considerably higher among men at 27.3 percent compared to1.6 percent among women— for every one woman consuming alcohol, 17 men are drinking.

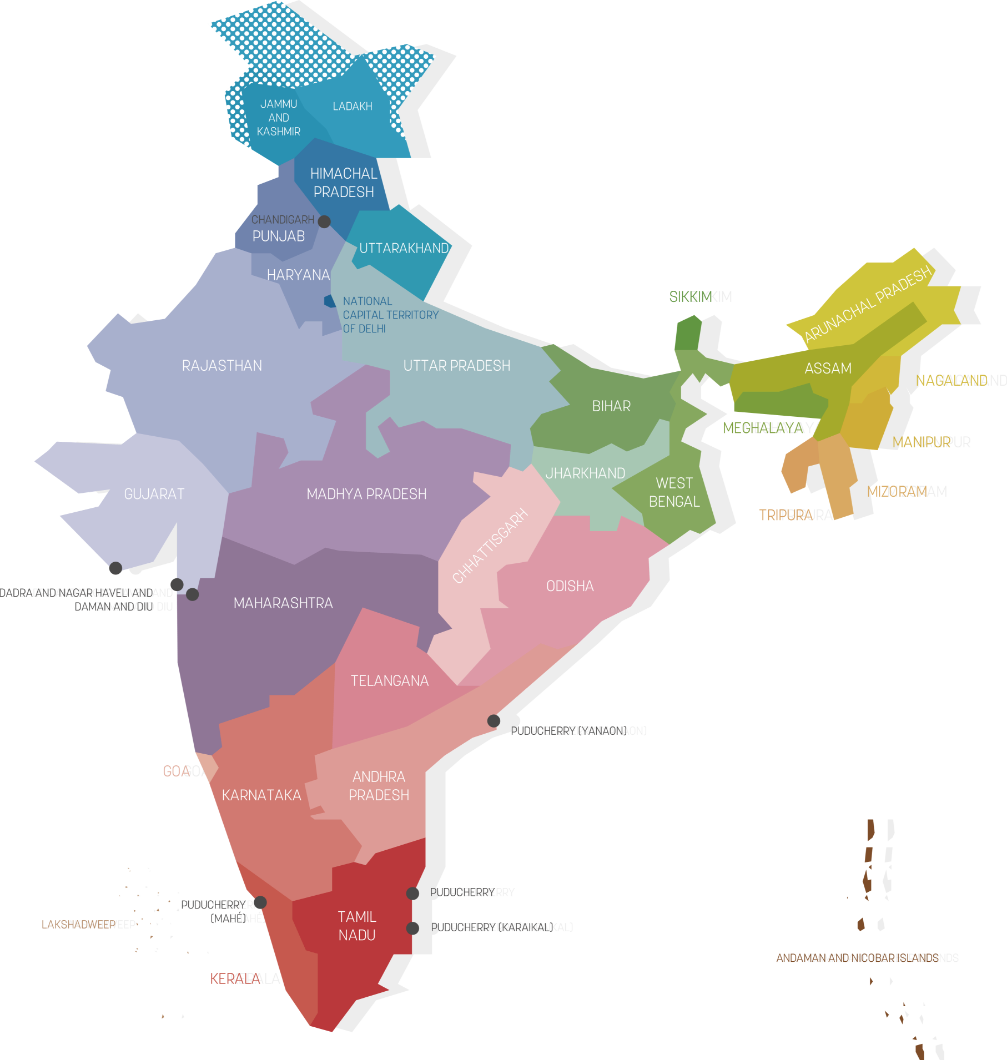
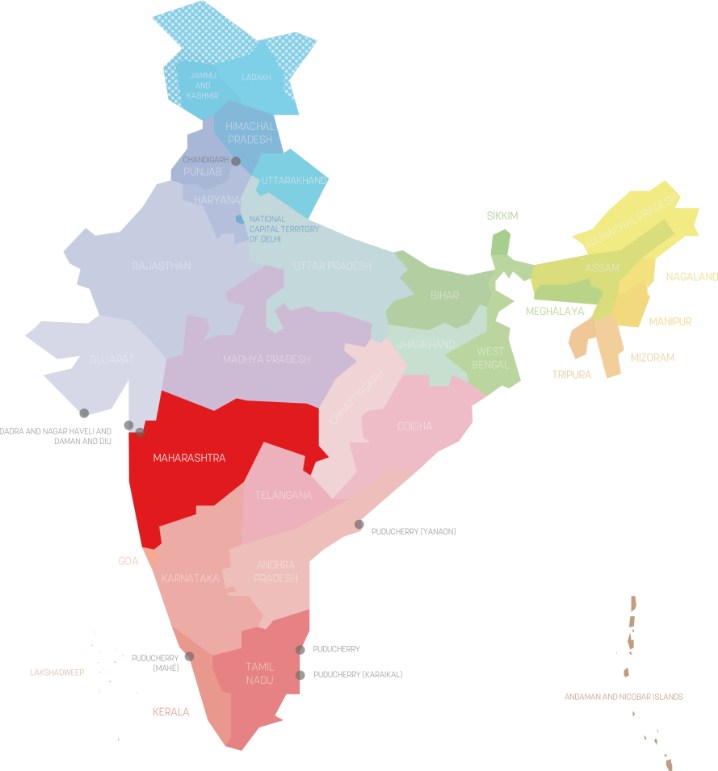
Percentage prevalence ofAlcohol use in the 10-75 age group
  • Chhattisgarh35.60
  • Tripura 34.70
  • Punjab28.50
  • Arunachal Pradesh 28.00
  • Goa26.40
  • Andaman & Nicobar Islands 25.40
  • Uttar Pradesh 23.80
  • Manipur 22.40
  • Haryana 21.60
  • Delhi21.30
  • Uttarakhand18.80
  • Daman & Diu 18.30
  • Madhya Pradesh 17.70
  • Chandigarh 17.50
  • Telangana 16.80
  • West Bengal 16.70
  • Odisha 16.40
  • Sikkim 15.70
  • India 14.60
  • Tamil Nadu 14.20
  • Andhra Pradesh 13.70
  • Kerala 12.40
  • Dadra and Nagar Haveli 11.60
  • Puducherry9.50
  • Himachal Pradesh 8.90
  • Assam 8.80
  • Nagaland8.10
  • Mizoram7.80
  • Jharkhand6.50
  • Karnataka6.40
  • Maharashtra5.70
  • Gujarat3.90
  • Jammu and Kashmir*3.50
  • Meghalaya3.40
  • Rajasthan2.10
  • Bihar0.90
  • Lakshadweep0.20

Source: Magnitude Substance Use in India 2019

Source: Magnitude Substance Use in India 2019

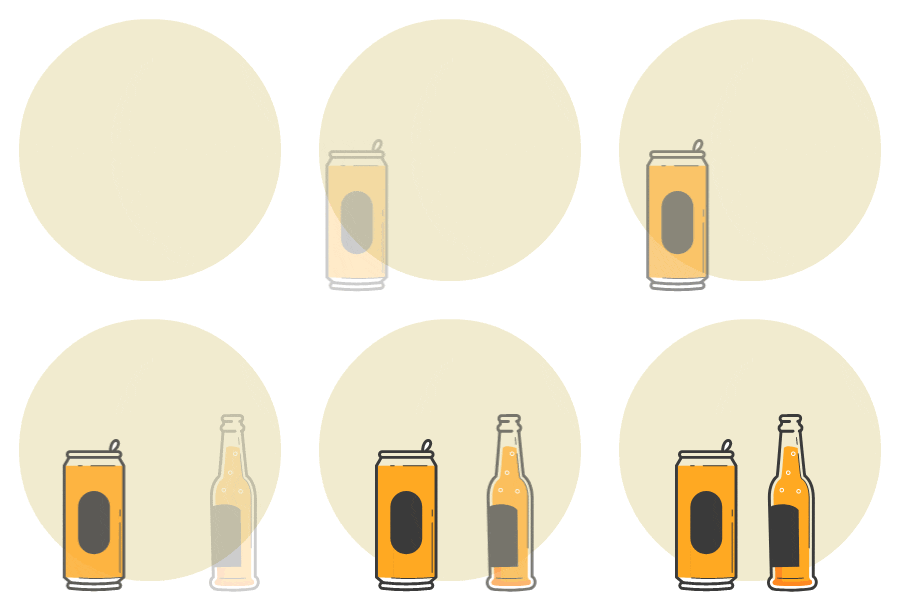
Most commonly consumedBeverages by alcohol users In India

Most commonly consumedBeverages by alcohol users In India

Note: In the household survey, 200,111 households across 36 states and UTs were visited (spread across 5808 Primary Sampling Units and 186 districts) and 473,569 individuals interviewed.

Globally, 44.8 percent of the alcohol consumed is in the form of spirits followed by beer (34.3 percent) and wine (11.7 percent).

Quick Facts

About 43 percent of alcohol users in India consume more than four drinks on a single occasion, indicating heavy episodic drinking.

One in five men suffers from alcohol dependence, while one in 16 alcohol-using women depend on it.

In the Northeast, the preference for homemade rice beer is higher than the rest of the country. The highest proportion of drinking illicitly distilled liquor (kacchi sharab)—about 30 percent)—was reported from Bihar.

Wine penetration in India is low, with an estimated 2-3 million consumers consuming 24 million litres. Wine-drinking remains largely urban, with Mumbai accounting for 32 percent of India’s consumption, Delhi 25 percent, Bangalore 20 percent , Pune 5 percent and Hyderabad 3 percent.

Productionand trade

Production and trade

In India, 12 joint venture companies have the licensed capacity to produce33,919 kilo-litres of grain-based alcoholic beverages a year. More than 50 units are making beer.

For the longest time, whisky, rum and beer were the preferred choices of Indians but with the rise in disposable income, urbanisation and low-priced domestic wines, wine consumption is rising slowly but steadily.

Maharashtra has emerged as the leading wine-producing state of the country. There are over 35 wineries in the western state, which is growing grapes on around 1,500 acres for wine. To boost production, the state government has declared wine-making a small-scale industry, offering excise concessions.

The demand for Indian beers made from malt, wine, brandy, whisky, rum, gin, etc is growing in the global market.

India exported alcoholic products worth $322.12 million (Rs 2,386.91 crore) in 2020-21, Agriexchange APEDA data shows. The United Arab Emirates, Ghana and Singapore are India’s top export destinations, while it imports majorly from US, UK and Belgium.

India’s alcoholic beverages trade over the last 5 years

YearExports (US$ million)Growth (in %)Imports (US$ million)Growth (in %)
2016-17298-351921
2017-183271060161
2018-19302-866911
2019-20231-23651-3
2020-2132239537-18

Source: Agriexchange APEDA

India’s Top 5 export destinations for alcoholic beverages (US$ Million)

Country2018-192019-202020-21
United Arab Emirates82.3773.774.84
Ghana18.5510.4235.56
Singapore31.4629.4429.53
Congo D. Rep.4.596.7316.99
Cameroon7.330.215.67

Source: Agriexchange APEDA

India’s Top 5 importing sources of alcoholic beverages (US$ Million)

Country2018-192019-202020-21
USA269.37267.28325.56
UK194.13166.98131.29
Belgium21.8947.3417.93
France22.1416.1212.67
Singapore89.3171.3112.66

Source: Agriexchange APEDA

Advisory Alert: It has come to our attention that certain individuals are representing themselves as affiliates of Moneycontrol and soliciting funds on the false promise of assured returns on their investments. We wish to reiterate that Moneycontrol does not solicit funds from investors and neither does it promise any assured returns. In case you are approached by anyone making such claims, please write to us at grievanceofficer@nw18.com or call on 02268882347