


As we all know, equity markets are characterised by the risk. Risk being integral part, it could carry good number of insights on the traders’ expectations as well. Risk can be quantified using a single figure of volatility.
Let us understand implied volatility first. So, volatility is nothing but calculation of pace of movement in a stock or an index, generally quoted in annual percentage number.
Volatility is a science in itself and goes far beyond the current discussion. Let us instead get to know what implied volatility is. As the name suggests implied volatility (IV) is a volatility figure that is implied by option premiums.
Option premium (known information from market quotes) is made up of 5 factors.
Stock Price = Known Information
Strike Price = Known Information
Interest Rate = More or Less Known Information
Time to Expiry = Known Information
Volatility = Calculated Figure (The Unknown).
Volatility input can be anything but we can try to back calculate the Volatility figure with rest of the 4 known information and Premium, the Volatility thus back calculated can be called Implied Volatility (Implied by Option Premium). Knowing IV saves us trouble of finding the right Volatility calculation.
Now, understand the Relationship.
Fall in any stock or index is destructive while the rise is constructive. The law of nature holds that destruction is faster than construction. Hence, the pace of movement a.k.a. Volatility during fall will be on a rise and Volatility during the rise will be falling.
Thus, Relationship between Stock/Index & Volatility is generally Negative.
Important feature of Volatility: Range Bound
A stock can go up from 10 to 100 to 1000 to even 10000, but volatility will always move in the range. The reason behind this is the very simple. Volatility is like the Speedometer (Pace of Movement) in the Car and Stock or Index Price is like the Milage. Milage can be a very big figure but Speedometer will still keep moving in the RANGE.
How to Monetize Negatively Related + Range Bound Volatility?Based on all above established characteristics, we can conclude that Top end of the range in Volatility would usually coincide with Bottoms in underlying stock or index. Now, finding volatility figure is difficult but Implied Volatility can be found on many options analytics applications.
Following mechanism has helped me identify action point close to the immediate bottom rather successfully (nearly 6-7 out of 10 times).
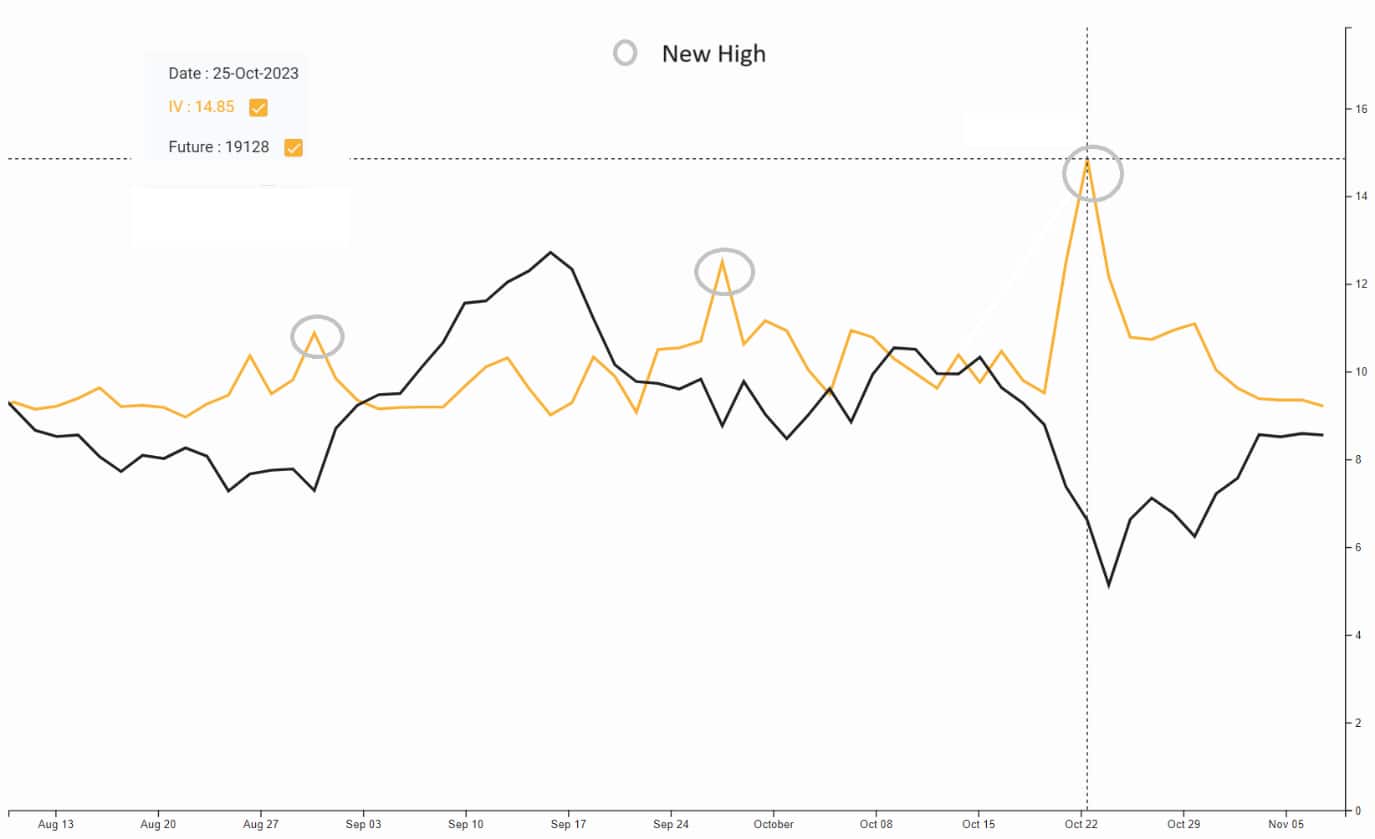
Remember there will be zigzag movement in IV (Implied Volatility). In an attempt to find a possible bottom just try and trace a new high in IV. Being range bound it will not keep rising and give a down tick. As soon as it does that is the spot. We can try and deploy a defensive bargain hunting trade.
Following chart of Nifty IV (of Option of closest expiry and strike price closest to future) and Nifty explains the point.
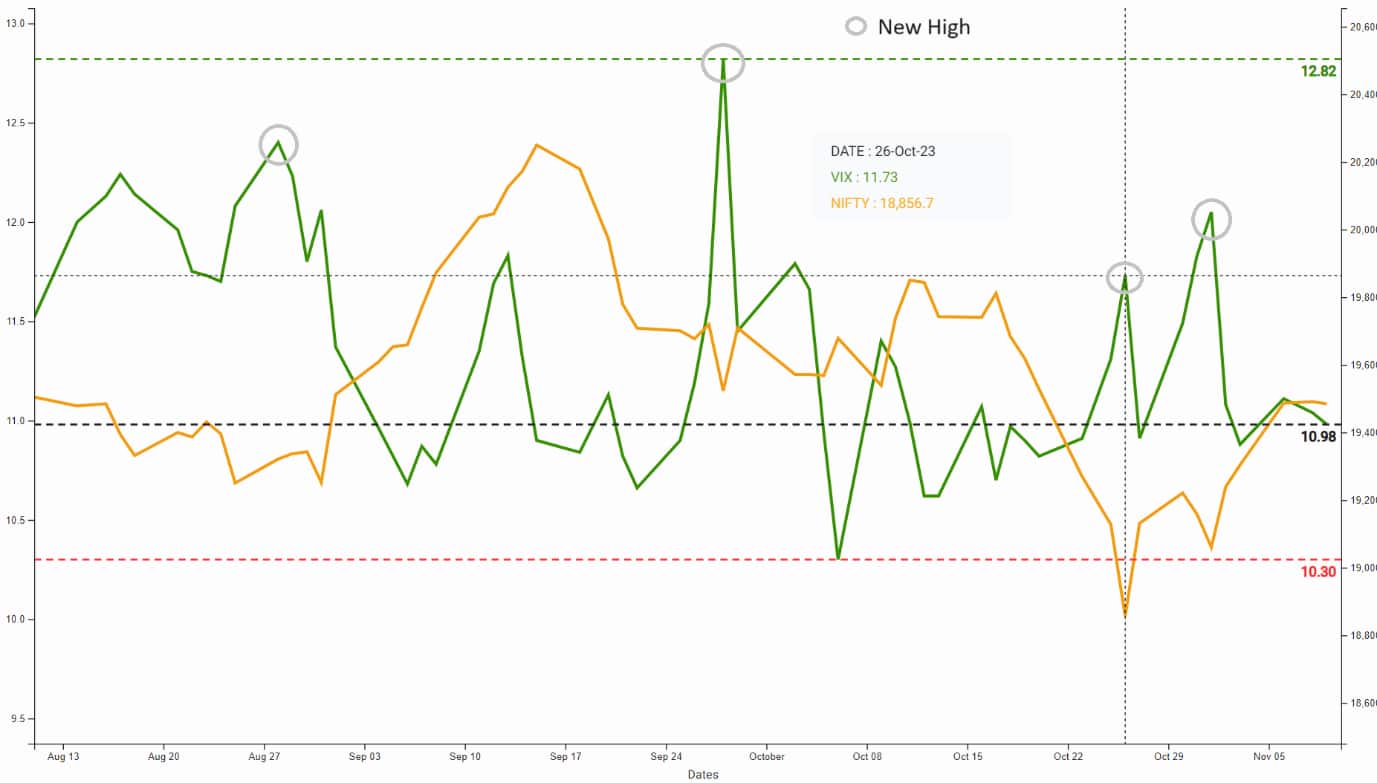
If IV is difficult to find same can be done using India VIX chart, it is publicly available and can also be used.

Discover the latest Business News, Sensex, and Nifty updates. Obtain Personal Finance insights, tax queries, and expert opinions on Moneycontrol or download the Moneycontrol App to stay updated!
Find the best of Al News in one place, specially curated for you every weekend.
Stay on top of the latest tech trends and biggest startup news.


