


Anubhav Sahu Moneycontrol Research
The US 10-year yield saw a sharp climb in the last few days, marking the third such surge since Donald Trump’s elevation to the White House.
Bond yields first rose after the US presidential election on the hope that potential tax reforms and an infrastructure push would ignite growth. The second episode to was amid strong macro data, reflationary forces and the outlook on Federal funds rate path.
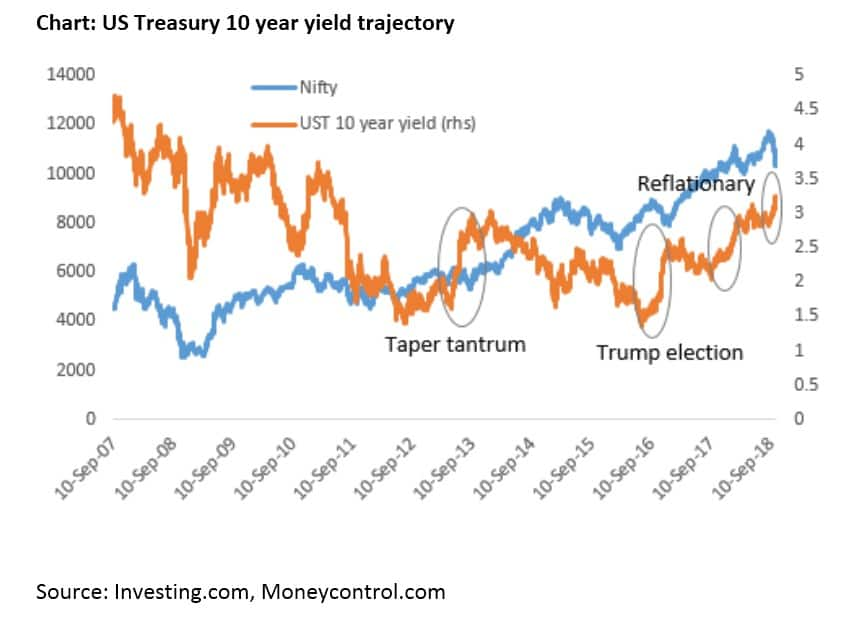
Steepening of the yield curve
Ironically, through most of 2018, market participants had anticipated flattening of the yield curve or worried about yield curve inversion.
A flat or inverted yield curve appears when yields of short-term bonds are equal to or higher than long-term maturity bonds. This typically happens when there is economic uncertainty and people want to hoard short-term money. An inverted yield curve is also seen as a predictor of an impending recession.
However, the Federal Reserve took a hawkish stance at its September 26 policy meet, rattling global asset classes. This caused a rise in the treasury yield curve.
The Federal Reserve Chairman Jerome Powell’s statement and Fed’s economic projections assume importance, hinting that the short term Fed Fund rate might exceed the neutral rate. The neutral rate can also be seen as an “equilibrium” rate, at which Fed neither stimulates nor restrains economic growth by a change in interest rate policy.
The key catalysts for the rate hike were strong non-farm payrolls, record unemployment rate (3.7 percent) and improving wage.
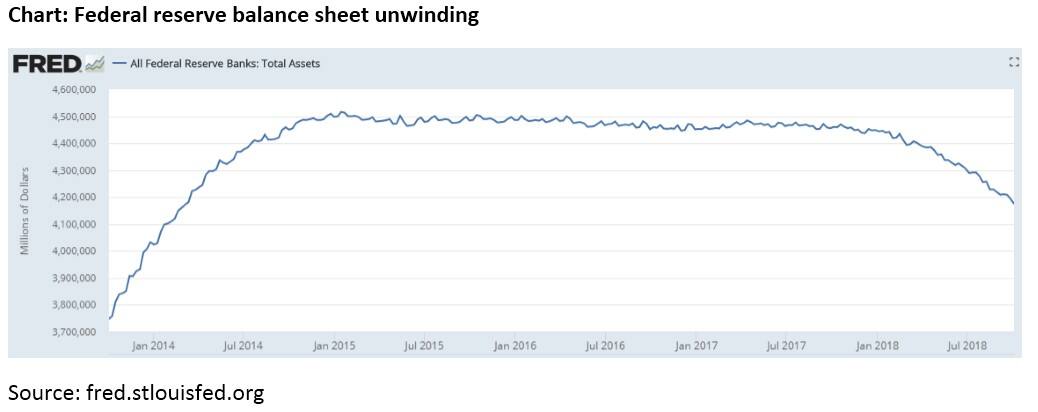
A direct factor supporting the US treasury yield remains the US balance sheet unwinding program (since October 2017). Till now, there has been a $285-billion decline in the Federal Reserve’s assets ($ 4.17 trillion). This unwinding, though slow-paced, remains an aspect to look at as the normalisation of monetary policy quickens.
This yield curve steepening has been witnessed for major European markets as well. While the European Central Bank (ECB) has already tapered its quantitative easing (QE) programme this year, it is expected to end its bond buying programme by 2018-end. In its last policy meet, the Fed highlighted broad-based recovery and improving inflation data.
In the European Union, political risk emerging out of Italy’s budget plan and its fiscal deficit forecast needs to be watched carefully as these are not in sync with EU commission’s expectations. Italy’s 10-year bond yield is near 3.7 percent – a four-and-a-half year high.
Interest rate differential is a key macro variable
Quantitative analysis on various macro variables and their relation with the Nifty show that interest rate differential is among the key differentiating variable in explaining the Indian equity divergence from its developed market counterpart. In a normal course, a world devoid of central bank liquidity programmes or systemic risk, the Nifty’s relative performance broadly tracks yield difference changes.
The Nifty’s relative performance is, among others, an inverse function of the dollar-rupee movement. The currency movement is also a good proxy for interest rate differential movement on account of interest rate parity.
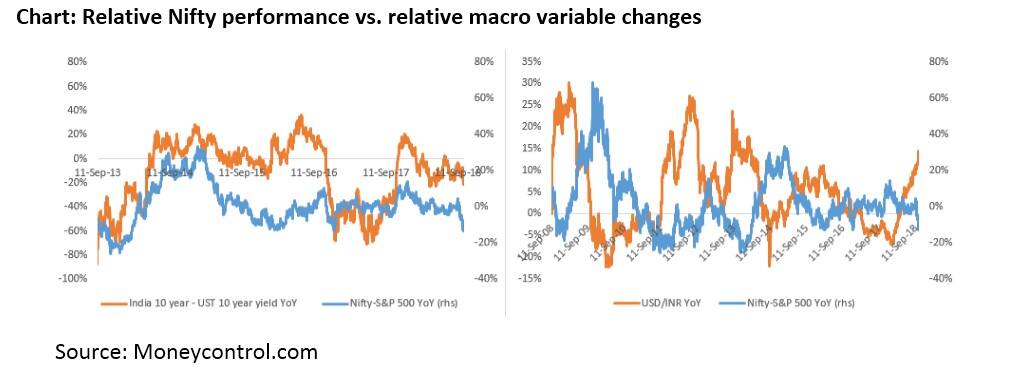
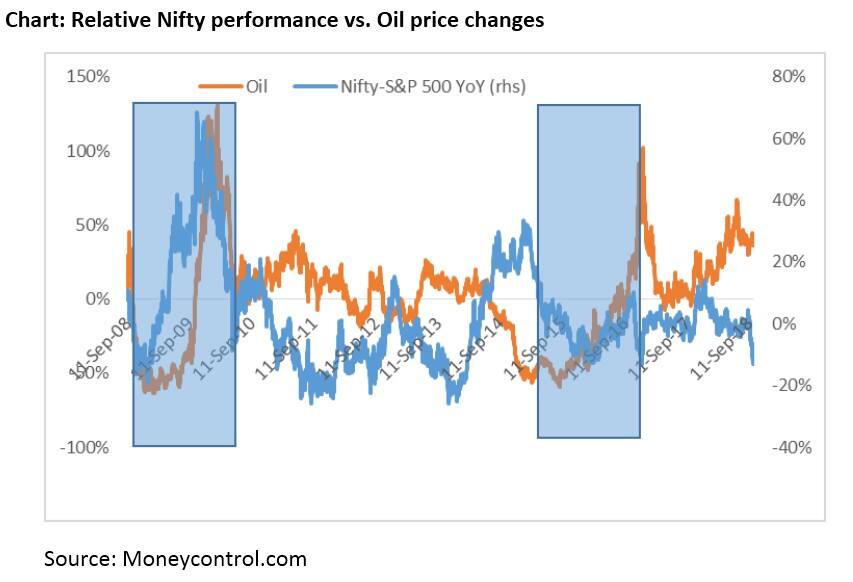
In case of oil, the relation is not so straightforward, particularly during times of deflation, as recovery from a deflationary scenario and systemic risk, and movement of oil price and relative Nifty performance goes in tandem.
Interest rate scenario: From an opportunity to a challenge
During the early years after the sub-prime crisis of 2008-09, when global central banks synchronised policy rate cuts and QE programmes, high beta and high-interest rate markets like emerging markets benefitted from fund flows.
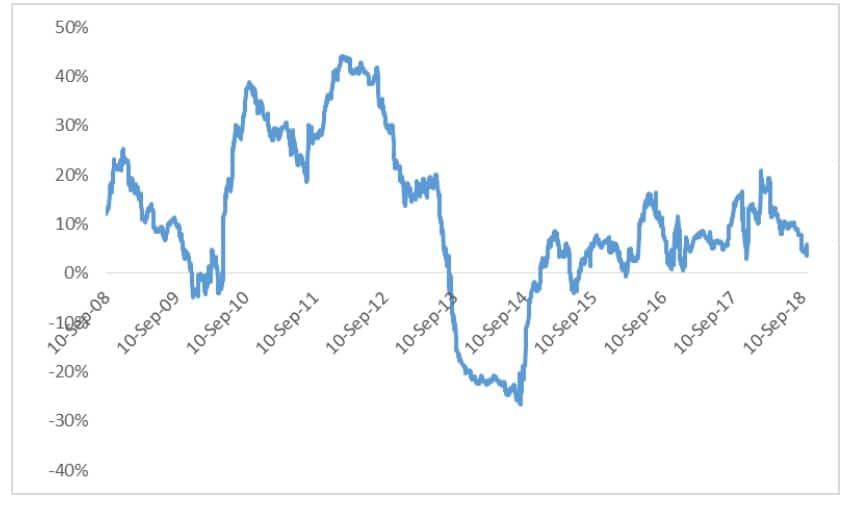
This was true for the Indian market as well. If one looks at one-year rolling correlation between Nifty outperformance (versus the S&P 500) and the change in interest rate differential (India 10-year yield minus US 10 year yield) over the years since the sub-prime crisis, one finds disproportionate investors preference for markets with high carry.
However, now with the normalisation of US monetary policy, the scenario has reversed.
Chart: One year rolling correlation between Nifty outperformance and change in Chartinterest rate differential
Growth concerns surfacing due to global trade war…
Lingering trade war concerns have weighed on the global growth outlook. Even the trade outlook has deteriorated. Latest factory order (PMI) reports underline that business optimism has declined to its lowest in two years. Not surprisingly, the International Monetary Fund (IMF) has revised down global growth outlook (October update) to 3.7 percent each for 2018 and 2019.
Chart: JP Morgan global PMI output (seasonally adjusted)
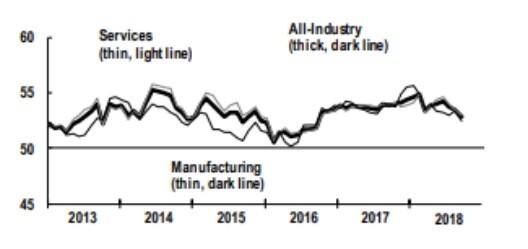
Source: www.markiteconomics.com
… and also due to idiosyncratic country risk
India is witnessing a spate of corporate governance issues, liquidity crunch in non-banking financial companies, and state intervention amid increasing current account deficit. China is grappling with economic slowdown warranting its central bank to push for policy easing measures. Argentina is facing a recession.
Many key emerging markets are facing elections-related uncertainties. Mexico and Turkey have had elections earlier this year. Mexico had a change of guard with Leftist leanings. In Turkey, re-election of Recep Tayyip Erdoğan has not gone well for the US-Turkey relations, inviting sanctions. Brazil, which continues to face economic slowdown, is heading to general elections later this month. Back home, India has recently declared multi-state election dates scheduled for later this year.
Leading to de-rating for emerging market economies
Together these deteriorating twin variables of higher interest rate and growth slowdown have led to fund outflows, currency depreciation and a de-rating in valuations. A simple check at the dividend discount model suggest that the fair value for the EM indices/India have shrunk.
On one hand, medium-term growth expectations have moderated and hence impacting the numerator part of the model. At the same time discounting factor (cost of equity) has surged on account of both an increase in the risk-free rate and expansion in risk premium (trade war uncertainty etc.) leading to lower present value or fair value.
Exhibit: Dividend discount model (DDM)
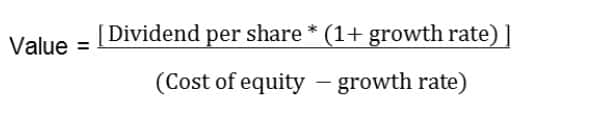
Cost of equity = risk free rate + risk premium
Implications
The growth and interest rate conundrum suggest that the great rotation from bonds to equity which started with the withdrawal of QE programmes have stalled, if not reversed. Expectation, specifically from the EM equity markets are re-drawn.
Net debt trend (indexed)
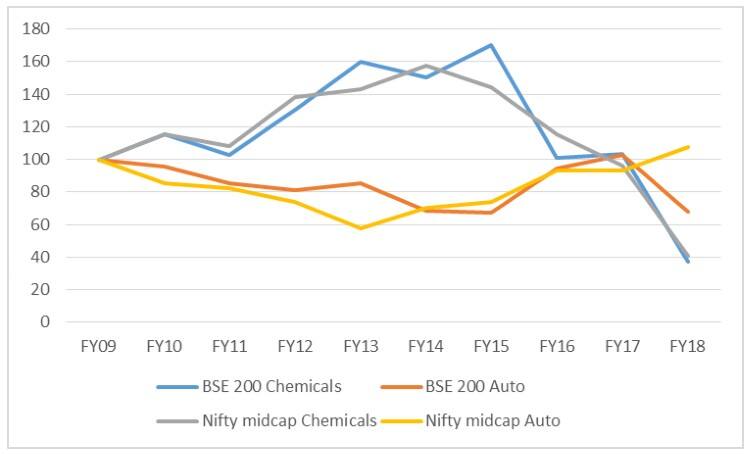
In the higher interest rate scenario, leverage may not be the only aspect to look at. There are pockets in markets which have de-leveraged in the favourable business cycle and hence are better placed in the current scenario. Having said that current scenario also impacts growth stocks which may be debt free, low dividend, and capex heavy stocks (majorly in midcaps) but at the same time earnings are backended.
That means a good chunk of earnings are available in the later years of the business cycle. In a rising interest rate regime, such stocks behave like a long duration bond and hence are more sensitive to risk premium. Since the investors seek higher risk premium for the earnings visibility in this scenario, management outlook and operational execution gains prime importance. It is these aspects which would be tested in the ongoing earnings season for the growth stocks, in our view.
For more research articles, visit our Moneycontrol Research page
Discover the latest Business News, Sensex, and Nifty updates. Obtain Personal Finance insights, tax queries, and expert opinions on Moneycontrol or download the Moneycontrol App to stay updated!
Find the best of Al News in one place, specially curated for you every weekend.
Stay on top of the latest tech trends and biggest startup news.


