


You start a new SIP feeling clever about investing during a market dip. Two months later, you open your investment app, and your return shows -71.88 percent.
Panic is the natural reaction. Did your Rs 20,000 investment really collapse to a few thousand rupees?
No. This is where many investors get tripped up. The number you are seeing is not your actual loss but a mathematical representation that can exaggerate short-term movements.
Understanding how SIP returns are calculated and when to trust which metric can prevent unnecessary anxiety and help you make better investing decisions.
Let’s understand what’s really happening.
When return numbers don’t match reality
Consider this simple scenario - after a correction in the Nifty 50, you begin a Rs 10,000 monthly SIP in January. The market dips again in February. When you check returns in early March, the SIP’s XIRR appears sharply negative at -71.88 percent.
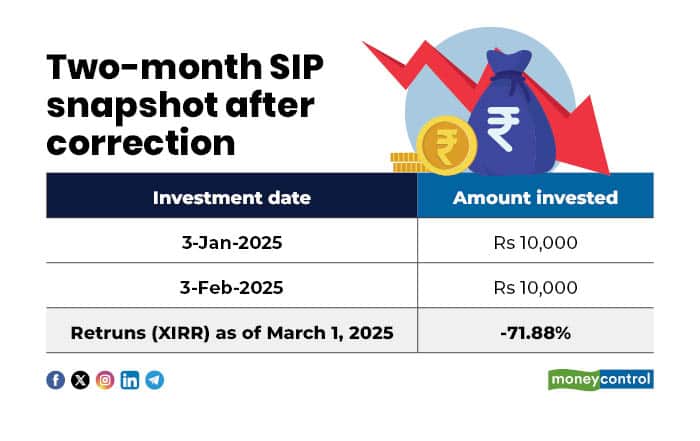
Does that mean your Rs 20,000 has shrunk to just Rs 5,624? Not really. Your portfolio has declined, but only marginally.
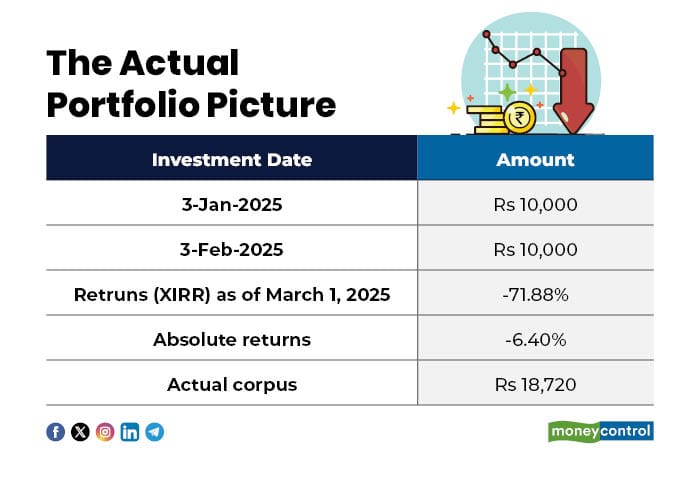
Your investment is down about 6 percent, not 72 percent.
So why does the return look so dramatic? SIP performance is calculated using XIRR, a time-adjusted method that annualises short-term returns and can exaggerate movements when the investment period is very short.
Why SIP returns are more complex than lump-sum returns
An SIP is not one investment; it is a series of investments entering the market at different points.
Each SIP instalment:
This timing difference can lead to very different outcomes across instalments, even within the same SIP.
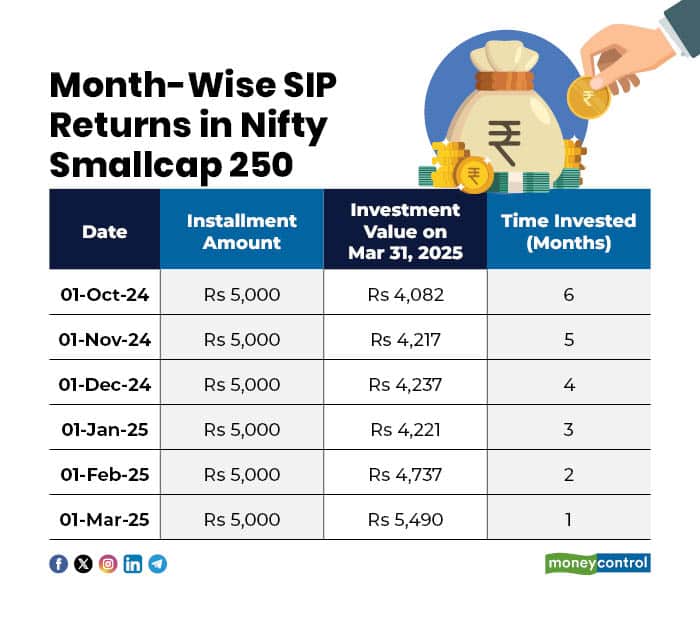
Suppose you start a six-month SIP of Rs 5,000 in a small-cap index fund from October 2024 to March 2025. Your first instalment remains invested for six months, while the last one stays invested for just a month.
Now look at how outcomes can differ purely because of timing. The October instalment of Rs 5,000, exposed to a longer correction, may fall to around Rs 4,082 by March. Meanwhile, the March instalment of the same Rs 5,000, invested closer to a recovery phase, could rise to about Rs 5,490 within a month.
Even instalments in between show varied outcomes. November’s investment may be worth roughly Rs 4,217, while February’s could be closer to Rs 4,737. The difference is not due to strategy, but simply when the money entered the market and how long it stayed invested.
So, in SIP investing, every installment behaves like an independent investment with its own holding period and return experience. When multiple such cash flows combine, calculating an overall return becomes more complex than a simple percentage gain or loss.
This complexity is exactly why a specialised return metric is needed. That metric is XIRR.
What XIRR actually measures and when it can be misleading
XIRR, or extended internal rate of return, calculates annualised performance across multiple cash flows made at different points in time. Since SIP investments are staggered, this method helps capture both the timing and duration of each instalment to arrive at a single return figure.
This approach works well when investments have been held for longer periods, as market movements tend to even out over time. However, when a SIP is only a few months old, annualising short-term performance can exaggerate the experience.
For instance, a 5 percent gain in a single month could translate into an annualised return of nearly 60 percent if the same pace is assumed to continue for a year. Similarly, a brief market decline can appear as a disproportionately large annual loss.
In such cases, the calculation is not incorrect, but the limited time frame makes the annualised number appear more dramatic than the underlying portfolio movement.
A smarter way to read short-term SIP performance
For SIPs that are less than a year old, the most useful metric is absolute return. Absolute return simply compares how much you invested with what the portfolio is worth today, without annualisation or assumptions about future performance.
For example, if you have invested Rs 30,000 and the portfolio value is Rs 27,000, your absolute return is minus 10 percent. If the value rises to Rs 33,000, that reflects a 10 percent gain.
Practical rule of thumb:However, absolute return has its own limitations. It does not capture the time taken to achieve a return.
For instance, imagine someone says they earned a 200 percent return. The number sounds impressive, but the real question is how long it took. A 200 percent gain over five years reflects strong performance, while the same gain over twenty years is far less compelling.
Consider two investors, Rahul and Ramesh. Both invest Rs 10 lakh and eventually build a corpus of Rs 30 lakh. Rahul reaches this milestone in five years, while Ramesh takes fifteen years. Even though both investors triple their money, the speed of wealth creation is very different. When time is considered, Rahul’s annual return is close to 25 percent, whereas Ramesh earns only about 7.5 percent.
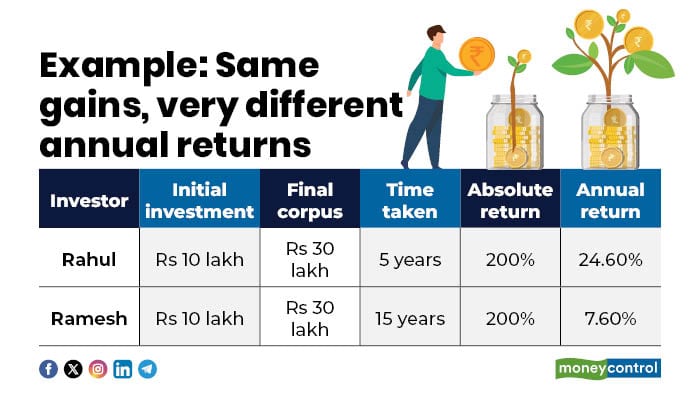
This illustrates why absolute returns become less meaningful over longer periods and why annualized metrics are necessary once investments exceed the one-year mark.
Conclusion: don’t let math scare you
Early in your SIP journey, return numbers can swing sharply, not because the investment is collapsing, but because annualised calculations amplify short-term movements. Understanding which metric to focus on, and when, can help investors interpret performance more calmly.
Markets will fluctuate and returns will change frequently. But informed investors look beyond headline numbers and focus on what the data truly represents. Reading returns in the right context can reduce unnecessary anxiety and encourage a more patient, long-term approach to investing.
Discover the latest Business News, Sensex, and Nifty updates. Obtain Personal Finance insights, tax queries, and expert opinions on Moneycontrol or download the Moneycontrol App to stay updated!
Find the best of Al News in one place, specially curated for you every weekend.
Stay on top of the latest tech trends and biggest startup news.


