


Crude oil is exhibiting amazing Time Cycles and turning areas right from daily to hourly time frame. In this article we will focus on analysing the cycle period and understanding their forecasting ability.
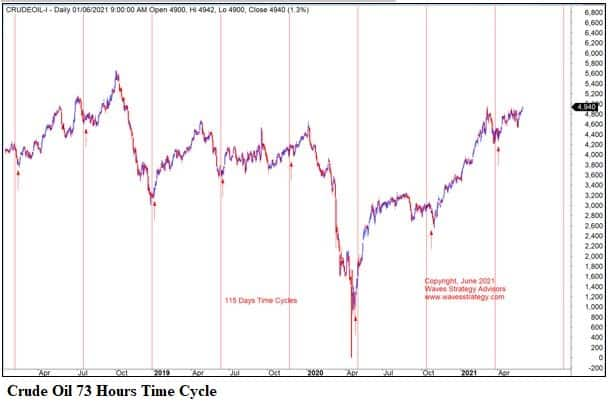
MCX Crude (INR) Futures Chart – 115 Days Time Cycle
We used the concepts of Hurst’s Time Cycles and found actual cycles working on crude oil.
Crude oil 115 days cycleWe can see that all the major lows formed on crude oil are near 115 days time cycle. This includes the low formed during the crash seen in April 2020 when crude turned negative on the glut created by the coronavirus pandemic. But if one were to follow this cycle period, it clearly suggested that the upturn was imminent when the majority was focusing on news and it worked out extremely well. The recent low was also near to this cycle.
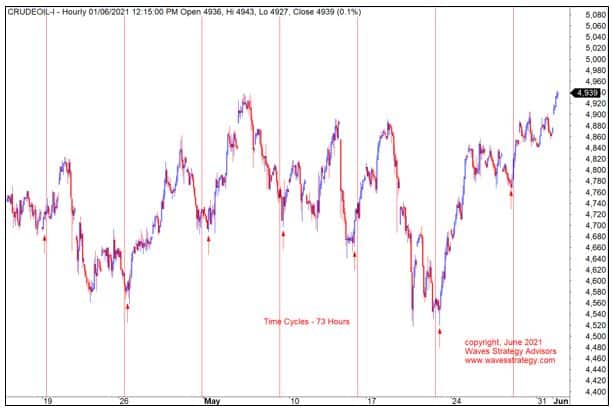
Crude oil 73 hours time cycleAfter analysing the bigger cycle, short-term cycles can be identified. The above chart clearly shows important turn areas can be identified on crude oil every 73 hours. It works extremely well and traders can use this simple cycle analysis and time their trades accordingly.
In a nutshell, crude time cycles suggest that the positive trend can continue over the next few weeks with the next hurdle near 5,200 levels as long as the support at 4,780 remains protected. Charts clearly suggest that news or events only result in volatility but cycles are an objective way of trading the commodity.

Discover the latest Business News, Sensex, and Nifty updates. Obtain Personal Finance insights, tax queries, and expert opinions on Moneycontrol or download the Moneycontrol App to stay updated!
Find the best of Al News in one place, specially curated for you every weekend.
Stay on top of the latest tech trends and biggest startup news.


