

The market is expected to remain volatile with a negative bias, experts said, adding that if the index fails to hold on to the rising support trendline, then 21,800 is the level to watch out for on the downside, but in case of holding the support trendline, the rebound can be possible and may take the Nifty 50 to 22,200-22,300 in the coming sessions.
On April 18, the BSE Sensex fell 455 points to 72,489, while the Nifty 50 was down 152 points at 21,996 and formed long bearish candlestick pattern on the daily charts. The broader markets were also under pressure, as the Nifty Midcap 100 index declined half a percent and Smallcap 100 index slipped third of a percent.
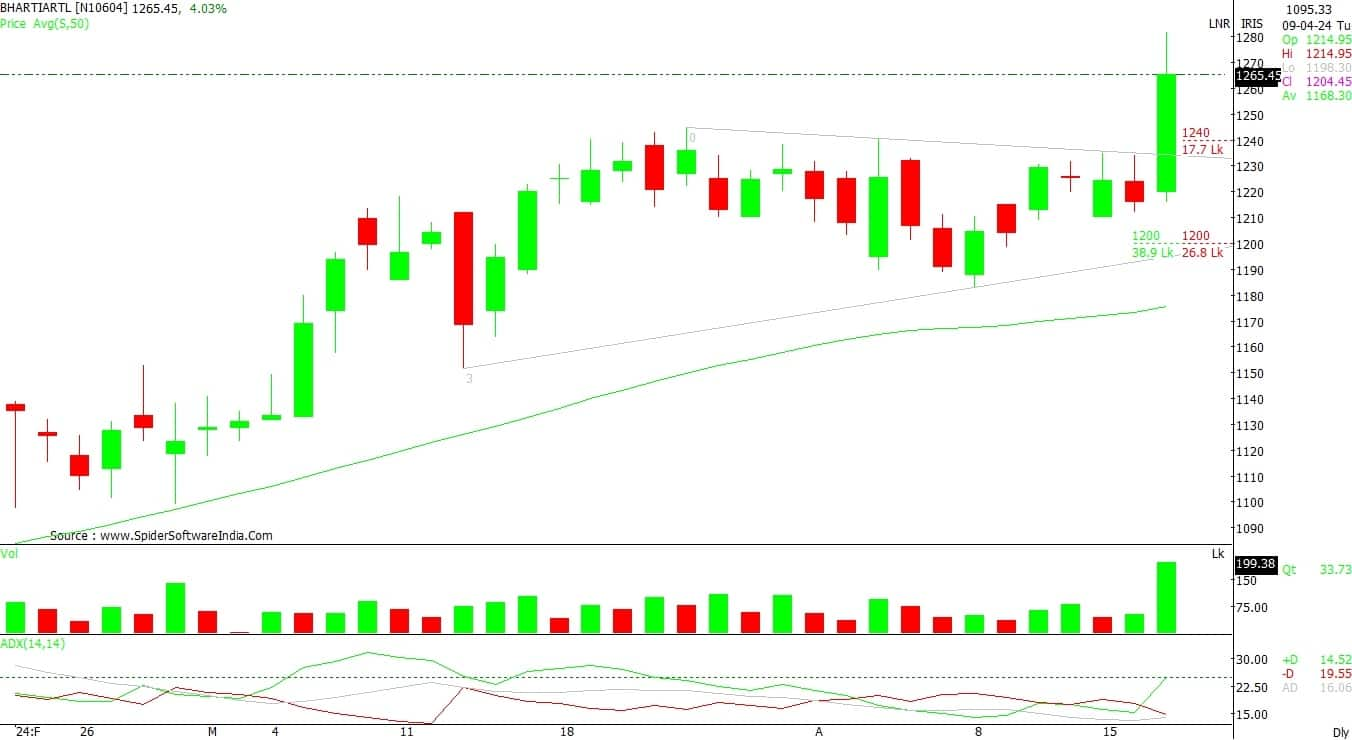
Stocks that bucked the trend included Bharti Airtel, Jio Financial Services, and Poonawalla Fincorp. Bharti Airtel was the biggest gainer in the Nifty 50, rising 4 percent to end at new closing high of Rs 1,266 with significantly higher volumes. The stock has seen decisive breakout of downward sloping resistance trendline adjoining multiple touchpoints and traded above all key moving averages.
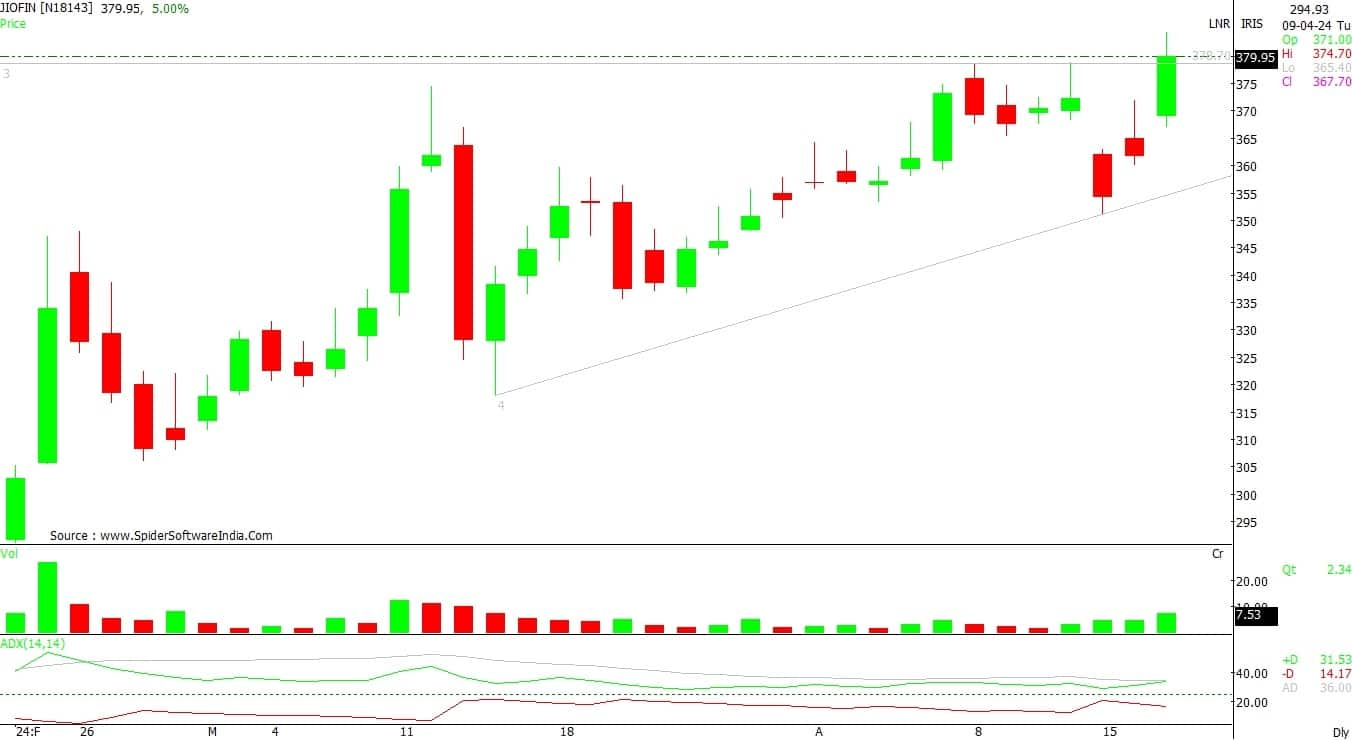
Jio Financial Services also saw record closing high of Rs 378.4, up 4.6 percent and formed bullish candlestick pattern on the daily charts with above average volumes. The 21-day EMA (exponential moving average) has been acting as a strong support for the stock since January 29 this year. Now it traded above all key moving averages .
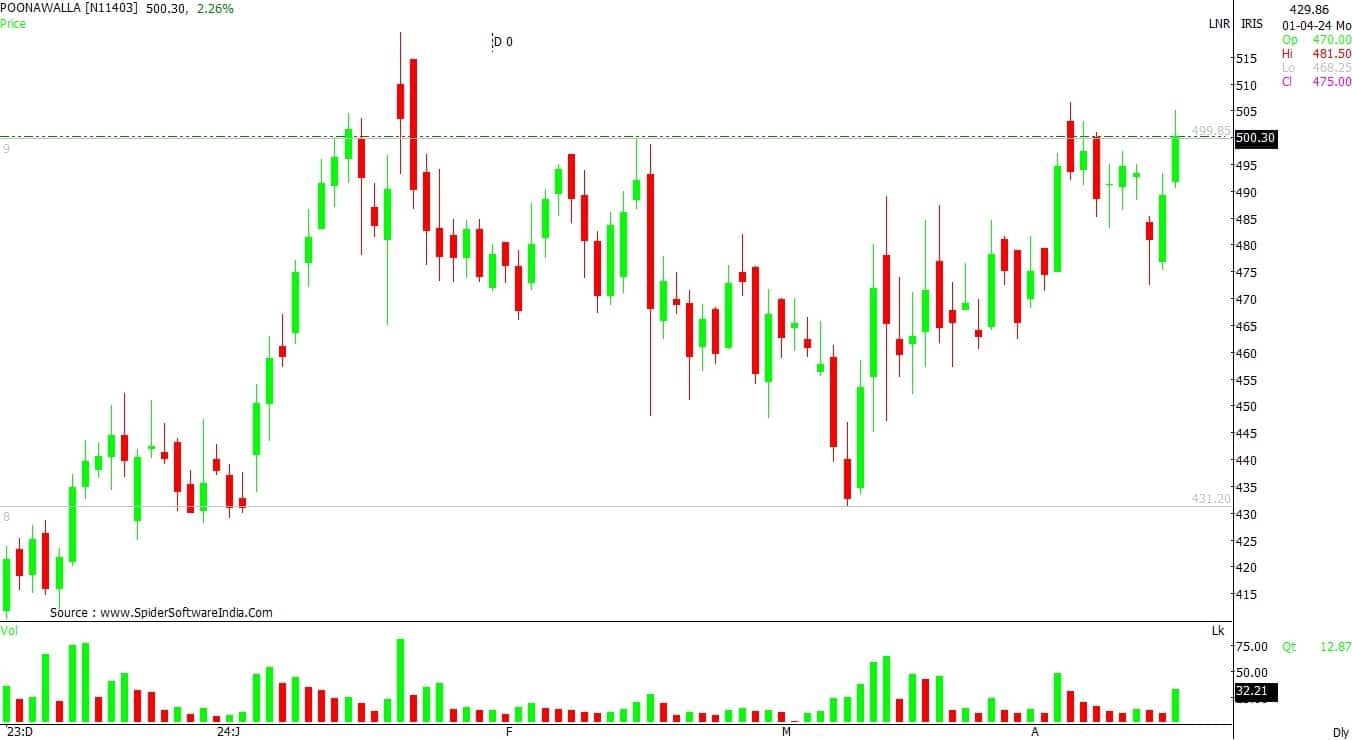
Poonawalla Fincorp has tried to give a breakout of falling resistance trendline, but could not end above the same. The stock rose 2.3 percent to Rs 500.5, continuing uptrend for yet another session and formed bullish candlestick pattern on the daily timeframe with healthy volumes. It traded above all key moving averages.
Here's what Shrikant Chouhan of Kotak Securities recommends investors should do with these stocks when the market resumes trading today:
The counter was in a consolidation mode in a triangle formation. However, it has given a breakout of its triangle chart pattern with a strong bullish candlestick pattern. Moreover, on the daily charts, it has formed a higher bottom formation, therefore the structure of the counter indicates further bullish momentum from the current levels.
Unless it is trading below Rs 1,220, positional traders can retain an optimistic stance and look for a target of Rs 1,350.

The stock has given a breakout of its Ascending Triangle chart pattern on the daily scale. Additionally, the incremental volume activity of the stock indicates the beginning of a new up move from the current levels. For positional traders, Rs 365 would be the trend decider level.
Trading above the same uptrend formation will continue till 410. However, if it closes below Rs 365, traders may prefer to exit from trading long positions.

On the daily chart, the stock has formed an Inverse Head and Shoulder chart pattern and it is trading near the neckline resistance zone. The rising volume activity and structure of the stock is indicating fresh leg of upward momentum from current levels in the coming horizon.
As long as the counter is trading above Rs 480, the uptrend formation is likely to continue. Above which, the counter could move up to Rs 535.

Disclaimer: The views and investment tips expressed by investment experts on Moneycontrol.com are their own and not those of the website or its management. Moneycontrol.com advises users to check with certified experts before taking any investment decisions.
Discover the latest Business News, Sensex, and Nifty updates. Obtain Personal Finance insights, tax queries, and expert opinions on Moneycontrol or download the Moneycontrol App to stay updated!