


The benchmark indices extended their southward journey for the fourth consecutive session, hitting a new low for the current year and falling by half a percent on February 21. The market breadth was in favour of the bears, with about 1,621 shares declining against 993 advancing shares on the NSE. Hence, further downward movement seems possible in the upcoming sessions. Below are some trading ideas for the near term:
Rajesh Palviya, Senior Vice President Research (Head Technical Derivatives) at Axis Securities
NTPC | CMP: Rs 326.25
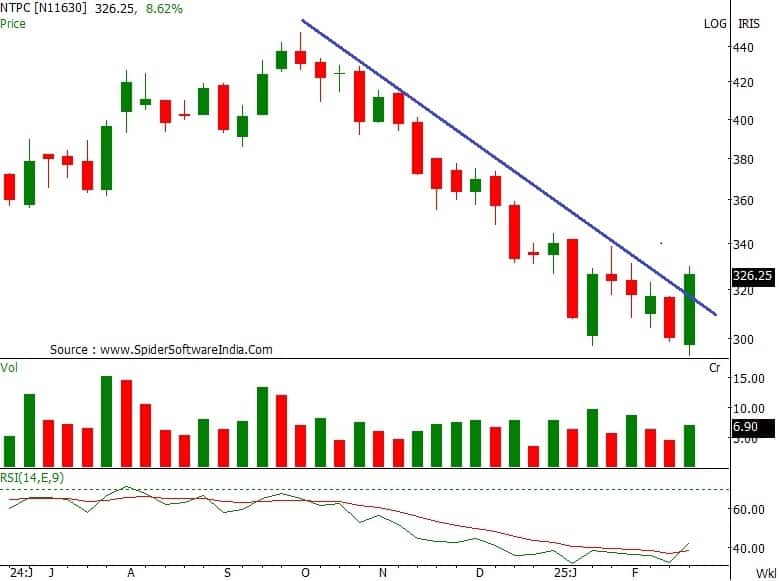
On a week-on-week basis, NTPC has registered almost a 9% gain, surpassing the past four weeks' losses. The weekly price action has formed an "engulfing bullish" pattern, a short-term trend reversal pattern indicating a positive bias. It has also broken out of the past five months' "downsloping trendline" on a weekly closing basis, signaling a trend reversal. The daily and weekly strength indicator, RSI (Relative Strength Index), is in favourable territory, showing rising strength. Investors should buy, hold, and accumulate this stock. Its downside support zone is Rs 320-310.
Strategy: Buy
Target: Rs 355, Rs 370
Stop-Loss: Rs 320
Hindalco Industries | CMP: Rs 653.55
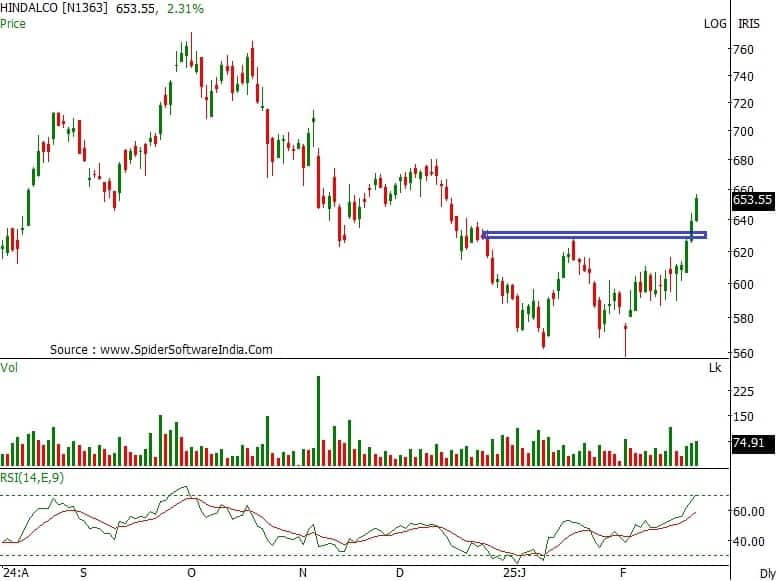
On the daily and weekly charts, Hindalco Industries has confirmed a trend reversal, forming higher tops and bottoms. The daily "Bollinger Bands" buy signals reconfirm the increased momentum. The stock is also well placed above its 20, 50, and 100-day SMAs, and these SMAs are inching up along with the price rise, confirming a bullish trend. The daily and weekly strength indicator RSI is in favourable territory, showing rising strength. Investors should buy, hold, and accumulate this stock. Its downside support zone is Rs 638-626.
Strategy: Buy
Target: Rs 685, Rs 710
Stop-Loss: Rs 638
Camlin Fine Sciences | CMP: Rs 154.88
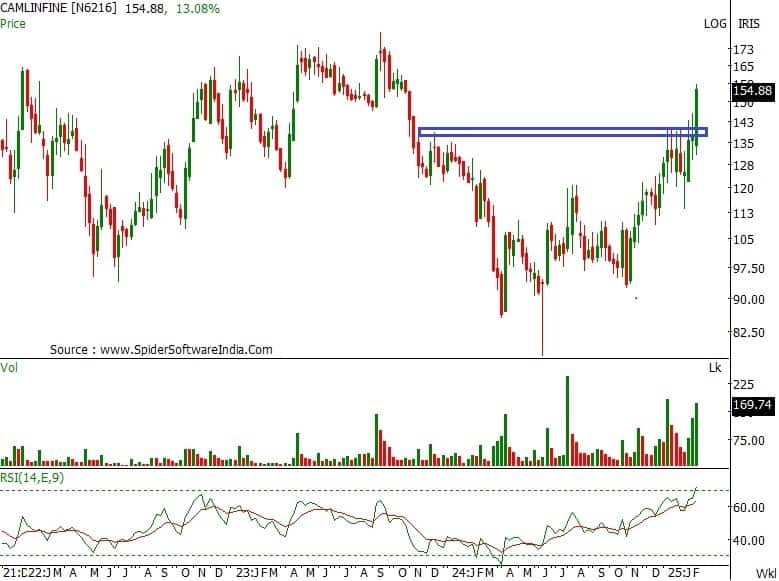
Camlin Fine Sciences is in a strong uptrend on the daily and weekly charts, forming a series of higher tops and bottoms. On the daily chart, the stock has decisively surpassed the past one-year multiple resistance zone of the Rs 140 level on a closing basis, indicating a positive bias. It is also well placed above its 20, 50, 100, and 200-day SMAs, and these SMAs are inching up along with the price rise, reconfirming a bullish trend. The daily and weekly strength indicator RSI is in favourable territory, showing rising strength. Investors should buy, hold, and accumulate this stock. Its downside support zone is Rs 145-135.
Strategy: Buy
Target: Rs 185, Rs 200
Stop-Loss: Rs 145
Osho Krishan, Senior Analyst - Technical & Derivative Research at Angel One
Shriram Finance | CMP: Rs 585.10
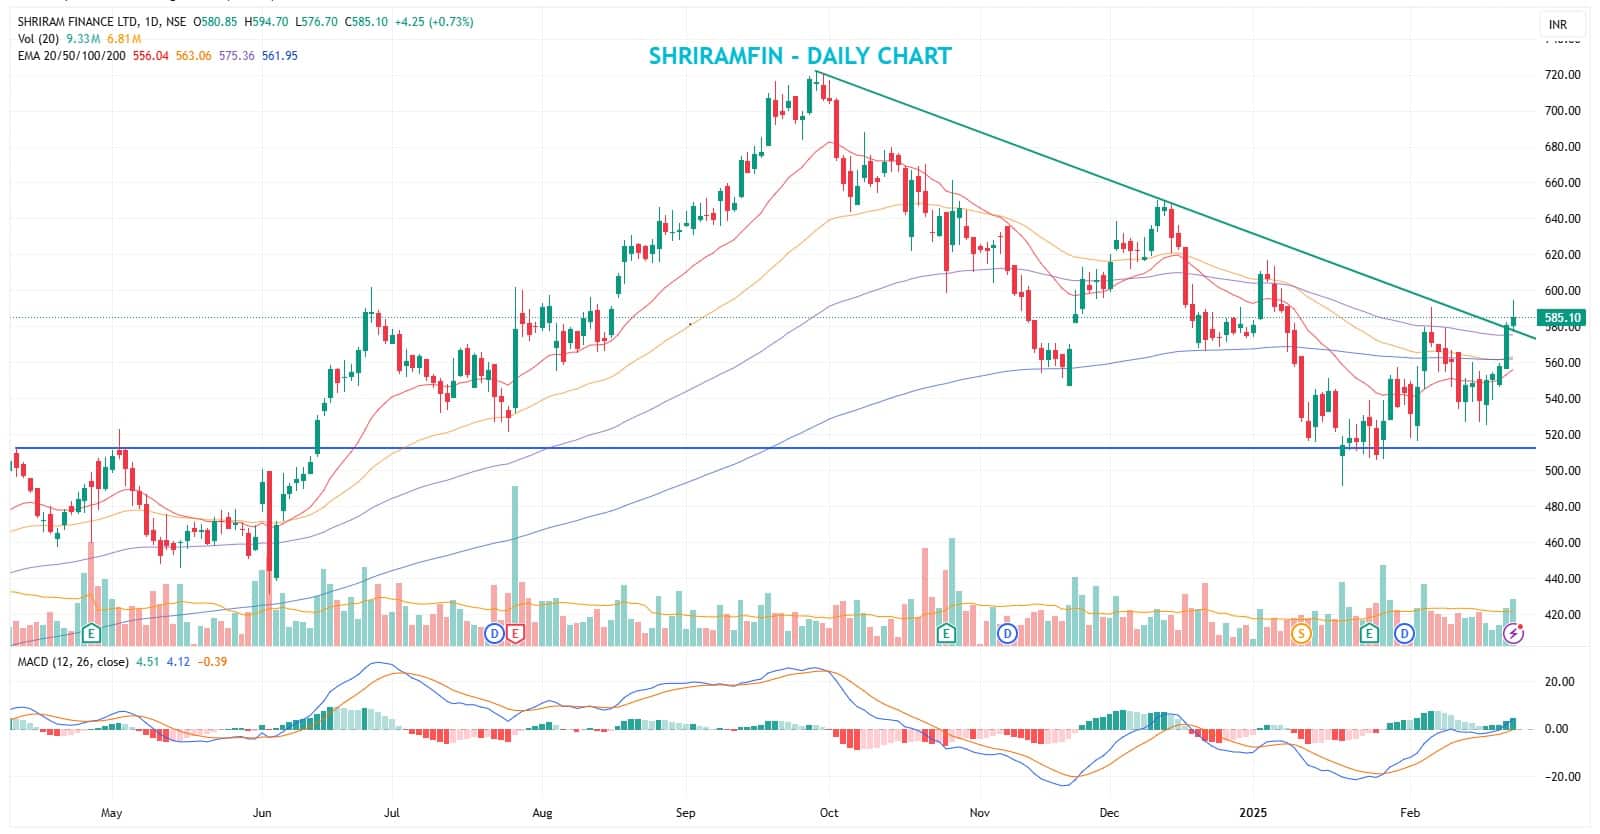
Shriram Finance has faced some decent profit booking after peaking at Rs 730 in September 2024. Currently, the stock is hovering near the cluster of its EMAs and 200 DSMA, portraying a time-wise corrective phase. Although the stock has been witnessing some buying traction in the shorter duration, it has emerged above the sloping trendline with a supportive bullish trend, as indicated by the SuperTrend indicator. Also, the 14-period RSI and MACD (Moving Average Convergence Divergence) align well with the undertone, adding a bullish quotient. Hence, we recommend buying Shriram Finance around Rs 580-570.
Strategy: Buy
Target: Rs 640
Stop-Loss: Rs 525
Himadri Speciality Chemical | CMP: Rs 457
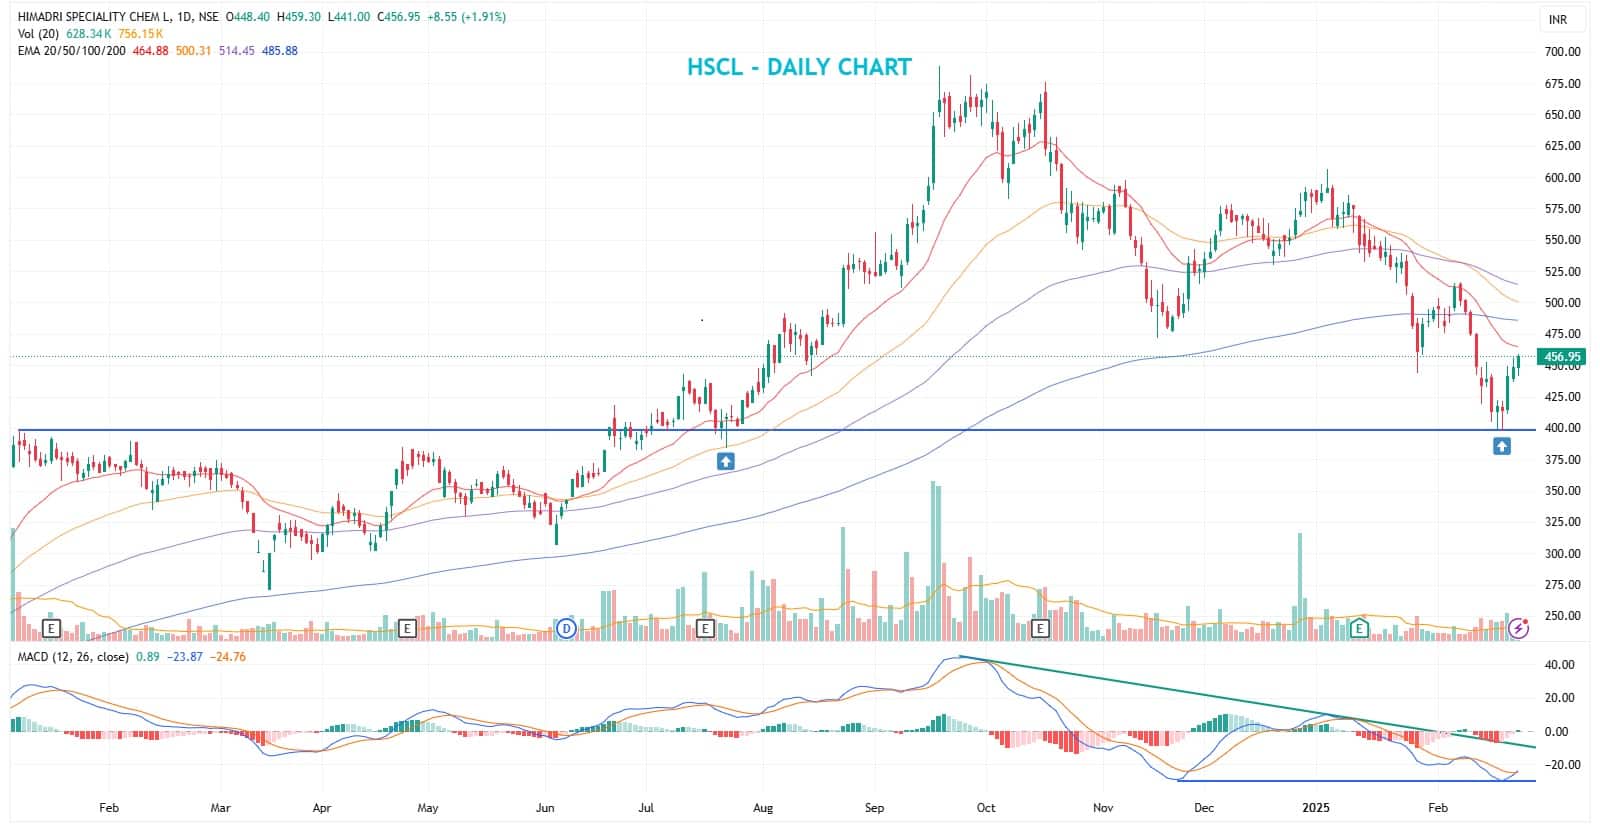
Himadri Speciality Chemical has been in a profit-booking phase for the past couple of months and is currently trading below both the exponential moving averages and the 200-day simple moving average (DSMA). The stock has retraced toward the neckline of the breakout that occurred around the Rs 400 subzone in June of last year, and since then, there have been signs of buying interest. Simultaneously, the MACD indicator has shown negative divergence, with lows occurring at similar levels, suggesting a potential countertrend in the near future. Hence, we recommend buying Himadri Speciality Chemical around Rs 450-440.
Strategy: Buy
Target: Rs 525, Rs 540
Stop-Loss: Rs 400
HEG | CMP: Rs 359.25
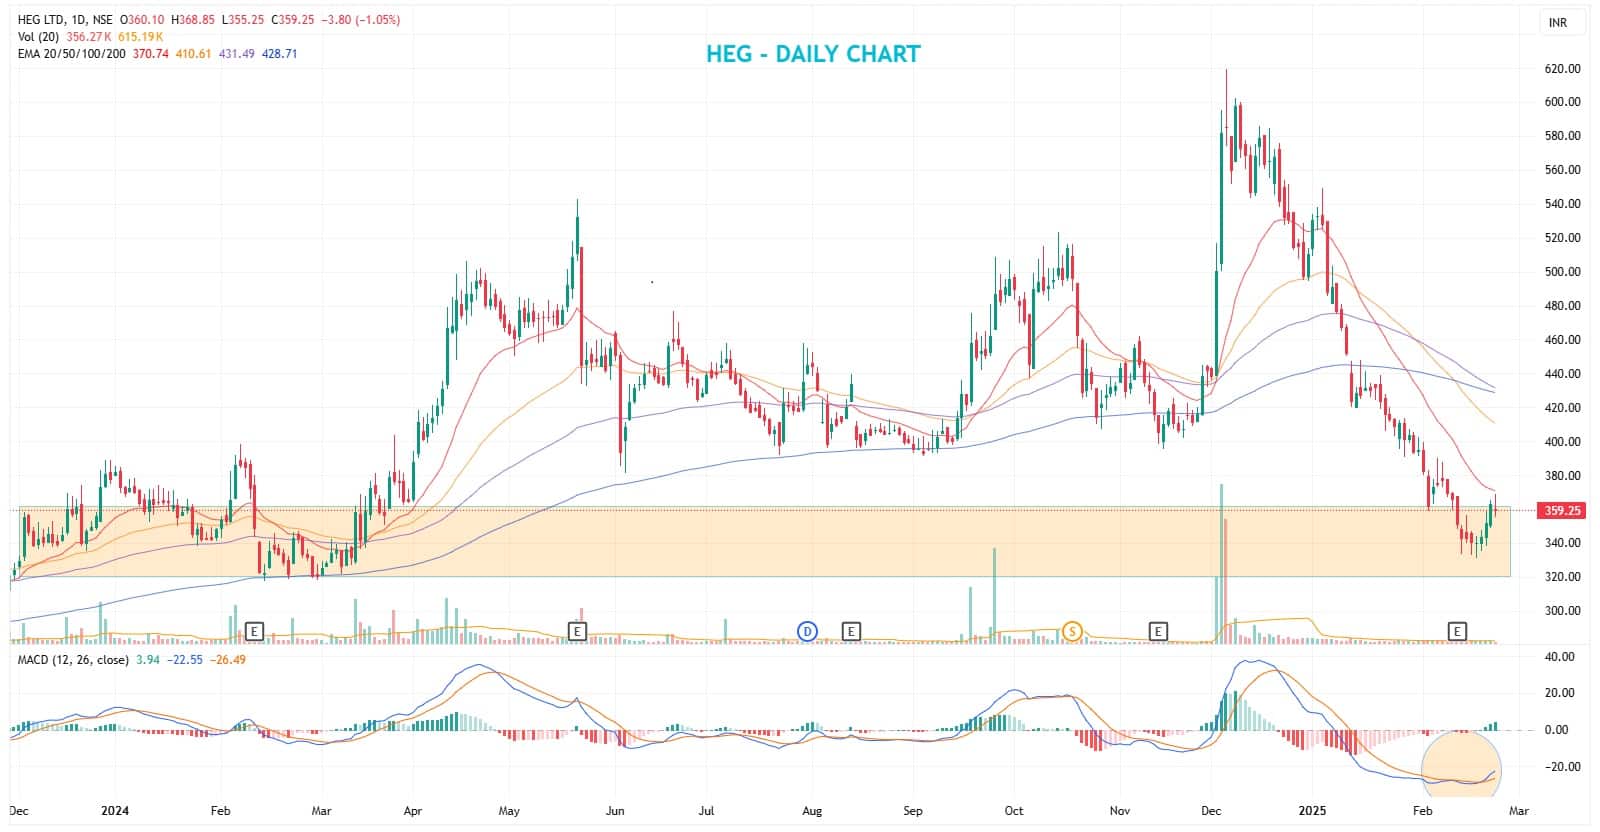
HEG has experienced a significant correction of over 45% from its recent peak of Rs 620, with no signs of respite or pullback. The stock is currently trading near historical support levels, almost at the same point it was a year ago. Additionally, the technical indicators have fallen into oversold territory. However, in the last couple of sessions, there has been some stability in the stock, along with a positive crossover in the 14-day RSI, suggesting an increase in buying interest. From a risk-reward perspective, the stock is positioned in a favourable zone and is expected to attract buying activity in the near future. Hence, we recommend buying HEG around Rs 350-345.
Strategy: Buy
Target: Rs 400
Stop-Loss: Rs 320
Ameya Ranadive, CMT, CFTe, Senior Technical Analyst at StoxBox
One 97 Communications | CMP: Rs 766.15

Paytm (One97 Communications) is showing signs of a potential trend reversal after taking strong support at Rs 700-710. The daily chart highlights a breakout attempt from the falling trendline, with improving momentum indicators. The stock is just below the crucial resistance of Rs 775. A sustained move above this level could trigger a sharp rally toward Rs 880. The RSI has bounced from oversold levels, signaling renewed buying interest, while the ADX (Average Directional Index) indicates a possible shift in trend strength.
RSI has shown a positive RSI Divergence. Additionally, the stock is attempting to reclaim the 21-day EMA near Rs 784, further confirming bullish momentum. The MACD histogram also shows a reduction in negative momentum, supporting the recovery outlook. Traders should watch for sustained price action above Rs 775 for confirmation. A breakout could fuel further upside, with Rs 850 and Rs 880 as key targets. However, a close below Rs 702 would invalidate the bullish view.
Strategy: Buy
Target: Rs 850, Rs 880
Stop-Loss: Rs 702
NMDC | CMP: Rs 67.73
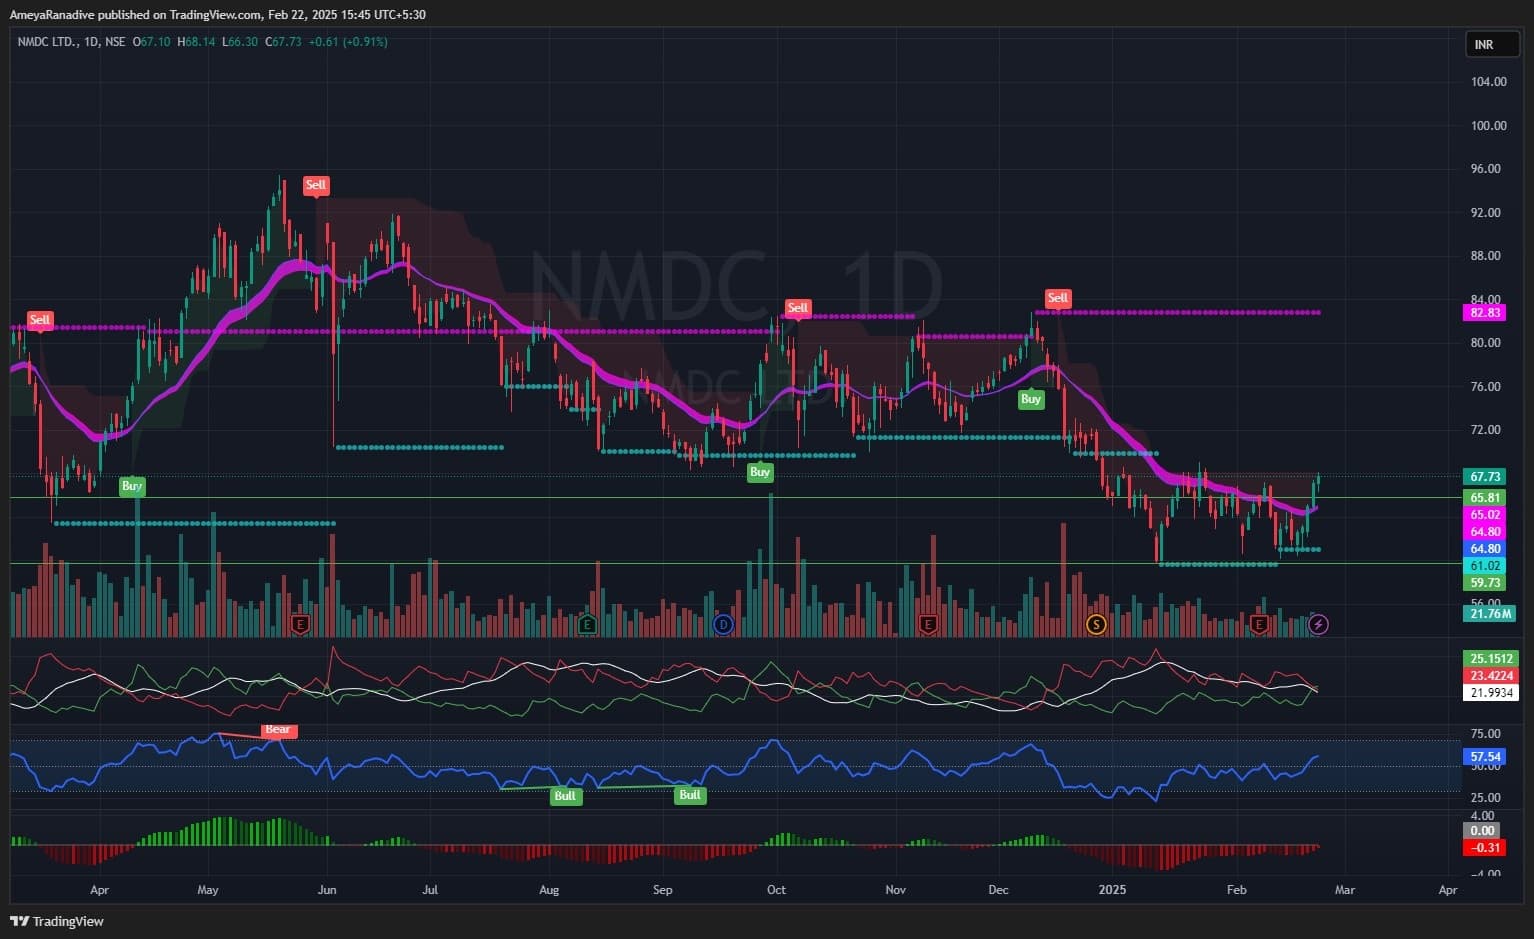
NMDC is showing a strong breakout from its recent consolidation. The stock has rebounded from the Rs 59-61 support zone, forming a higher low, indicating a shift in momentum. A sustained move above Rs 65, supported by rising volume, confirms buying interest. Technical indicators favour the bullish outlook. The RSI has crossed 57, reflecting improving strength, while the ADX suggests increasing trend momentum.
The MACD histogram is showing a reduction in bearish pressure, hinting at a potential continuation of the uptrend. Additionally, NMDC has reclaimed its short-term moving averages, reinforcing the possibility of further upside. If the stock sustains above current levels, the next targets are Rs 74 and Rs 82 in the medium term. A close below Rs 60 will negate the bullish setup.
Strategy: Buy
Target: Rs 74, Rs 82
Stop-Loss: Rs 60
Tata Steel | CMP: Rs 140.76
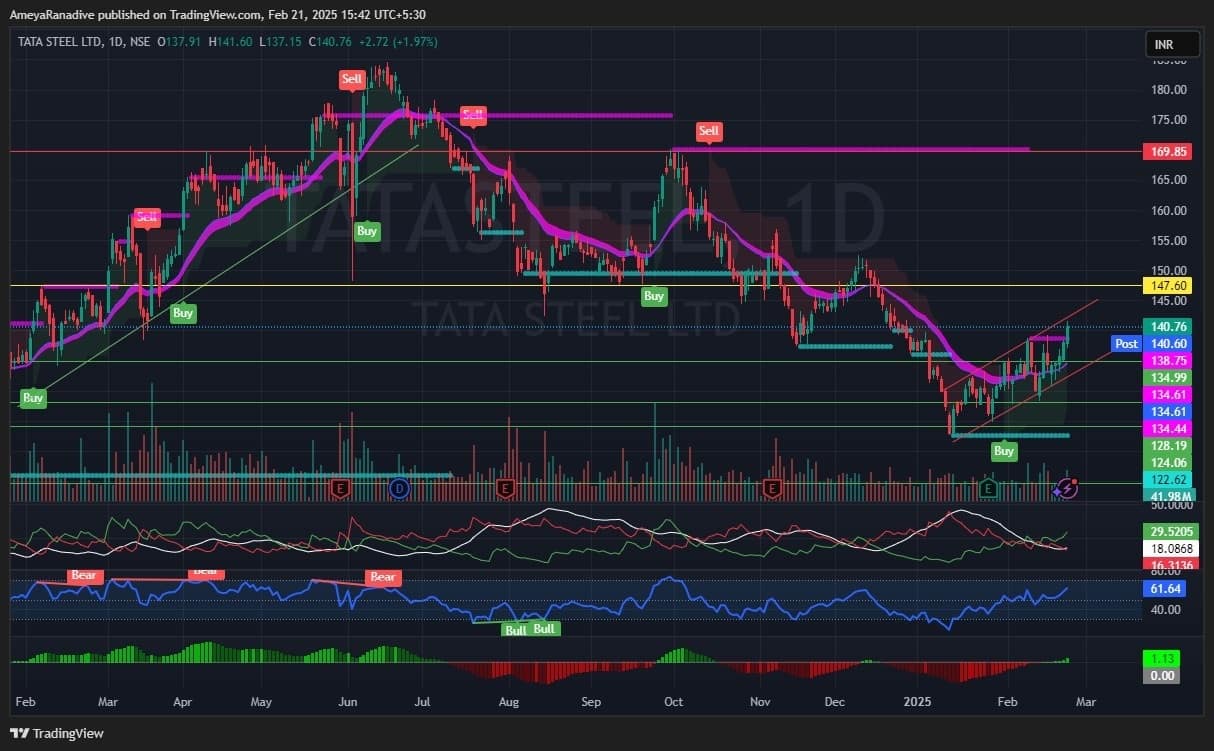
Tata Steel is maintaining a strong uptrend within a rising channel, consistently forming higher highs and higher lows. The stock remains above its 20-day and 50-day EMAs, signaling continued bullish momentum. Recent breakouts from key resistance levels further validate investor confidence, reinforcing the ongoing uptrend. Technical indicators support the bullish outlook.
The MACD has turned positive, confirming upward momentum, while the RSI's positive crossover indicates strong buying pressure. This confluence of factors suggests a potential upside toward Rs 152-156 in the near term. However, a drop below Rs 130 could weaken the trend, requiring caution. As long as Tata Steel sustains above key support levels, it remains well-positioned for further gains, making it an attractive buy for traders and investors alike.
Strategy: Buy
Target: Rs 152, Rs 156
Stop-Loss: Rs 130
Disclaimer: The views and investment tips expressed by investment experts on Moneycontrol.com are their own and not those of the website or its management. Moneycontrol.com advises users to check with certified experts before taking any investment decisions.Discover the latest Business News, Sensex, and Nifty updates. Obtain Personal Finance insights, tax queries, and expert opinions on Moneycontrol or download the Moneycontrol App to stay updated!
Find the best of Al News in one place, specially curated for you every weekend.
Stay on top of the latest tech trends and biggest startup news.


