


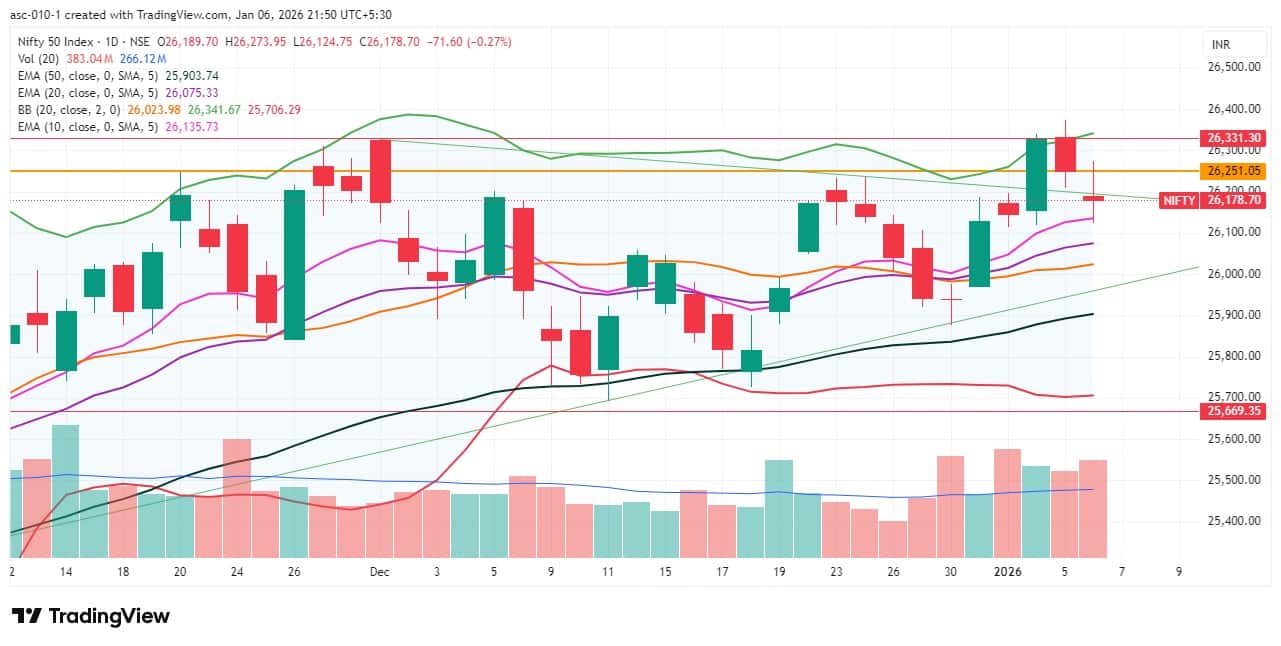
The market continued to consolidate and witnessed profit booking for the second consecutive session, especially after hitting a new high, closing one-third of a percent lower and falling below the support trendline (which previously acted as a resistance trendline at 26,200) on January 6. The index continued to trade above all key moving averages, but momentum indicators signalled some short-term caution. Hence, if the index sustains below 26,200, the consolidation may continue, with the crucial support of 26,000 likely to be tested in the next few sessions, as a decisive fall below this level could bring bears into action. However, the 26,300–26,400 zone is expected to act as a resistance area, according to experts.
Here are 15 data points we have collated to help you spot profitable trades:
1) Key Levels For The Nifty 50 (26,179)
Resistance based on pivot points: 26,249, 26,285, and 26,342
Support based on pivot points: 26,136, 26,100, and 26,043
Special Formation: The Nifty 50 formed a small red candle with long upper and lower shadows and above-average volumes, resembling a doji or high-wave-like candlestick pattern on the daily timeframe, signalling indecision and volatility. The index saw a breakdown below the support trendline but continued to hold above all key moving averages. The Stochastic RSI turned bearish, while the RSI dropped to 55.62 and moved toward the reference line. The MACD remained above the signal line, but the bullish bias faded slightly in the histogram. All these indicators suggest short-term consolidation with caution.
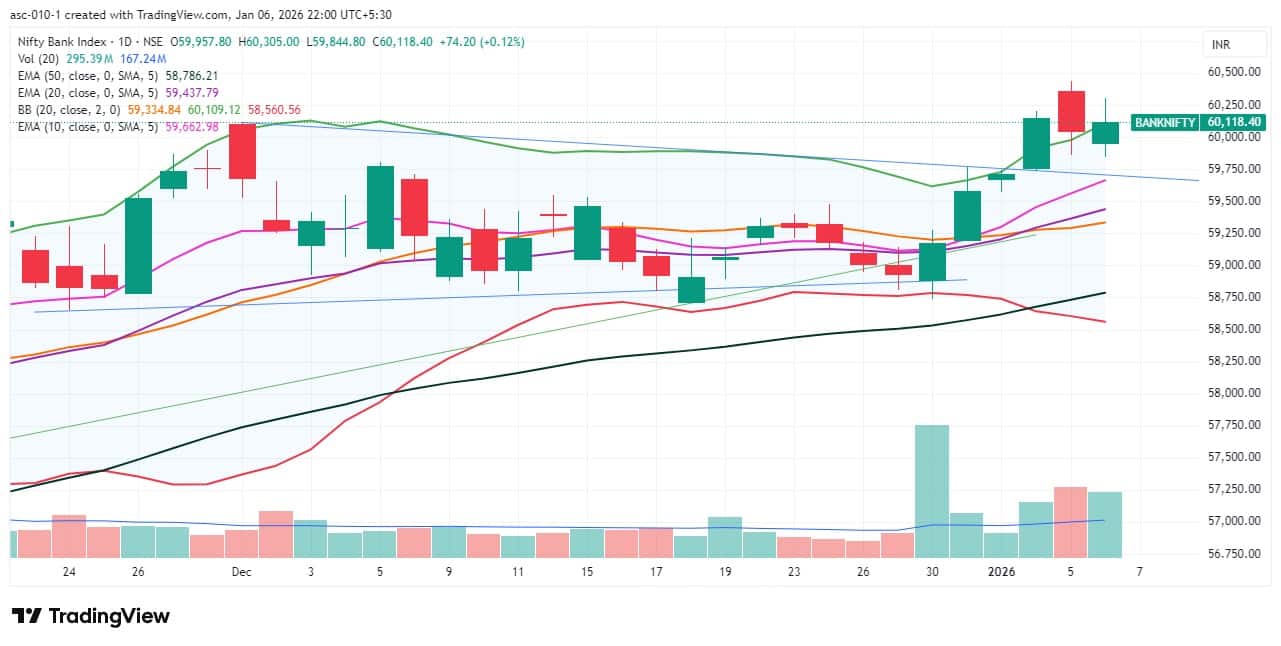
2) Key Levels For The Bank Nifty (60,118)
Resistance based on pivot points: 60,265, 60,374, and 60,550
Support based on pivot points: 59,914, 59,805, and 59,629
Resistance based on Fibonacci retracement: 60,502, 60,989
Support based on Fibonacci retracement: 59,776, 59,571
Special Formation: The Bank Nifty performed better than the Nifty 50 and nearly defended the previous day’s low, forming a bullish candle with upper and lower shadows on the daily charts with above-average volumes. The index also sustained above the upper Bollinger Band, which is in expansion mode, as well as the support trendline. The RSI at 66 held above the reference line, while the MACD also remained above the signal line with further upside in the histogram. All these indicators suggest relative strength and a positive bias compared to the benchmark.
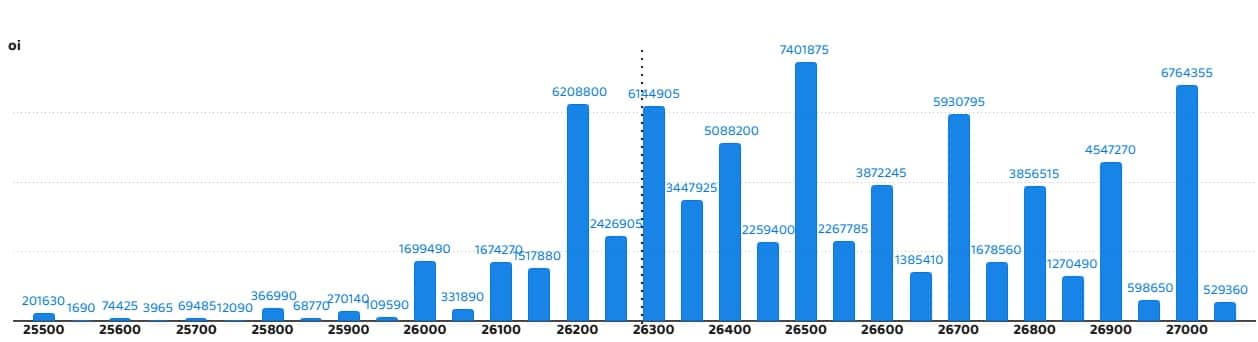
According to the weekly options data, the maximum Call open interest was seen at the 26,500 strike (with 74.01 lakh contracts). This level can act as a key resistance level for the Nifty in the short term. It was followed by the 27,000 strike (67.64 lakh contracts) and 26,200 strike (62.08 lakh contracts).
Maximum Call writing was observed at the 26,200 strike, which saw an addition of 44.9 lakh contracts, followed by the 26,500 and 26,700 strikes, which added 41.03 lakh and 40.17 lakh contracts, respectively. There was hardly any Call unwinding seen in the 25,500-27,000 strike band.
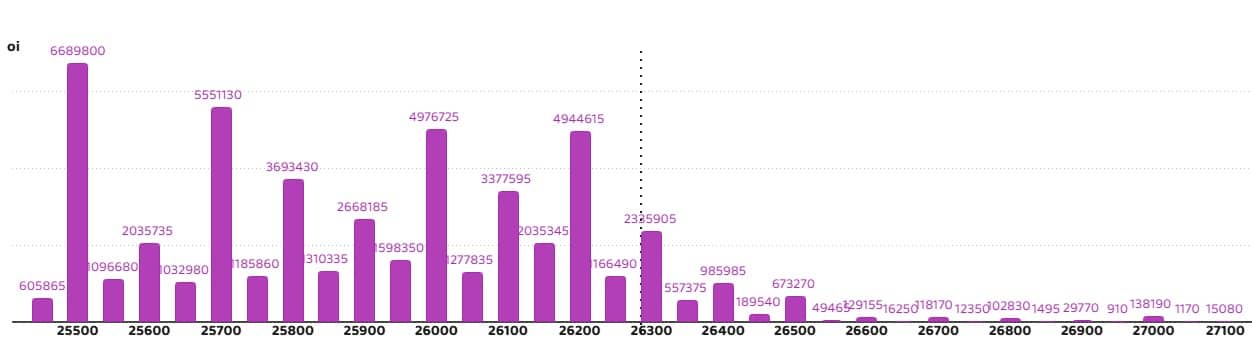
On the Put side, the 25,500 strike holds the maximum Put open interest (with 66.89 lakh contracts), which can act as a key support level for the Nifty in the short term. It was followed by the 25,700 strike (55.51 lakh contracts) and the 26,000 strike (49.76 lakh contracts).
The maximum Put writing was placed at the 25,500 strike, which saw an addition of 48.64 lakh contracts, followed by the 25,700 and 26,200 strikes, which added 42.46 lakh and 26.5 lakh contracts, respectively. The maximum Put unwinding was seen at the 26,500 strike, which shed 3.46 lakh contracts, followed by the 26,300 and 26,550 strikes, which shed 53,430 and 15,665 contracts, respectively.
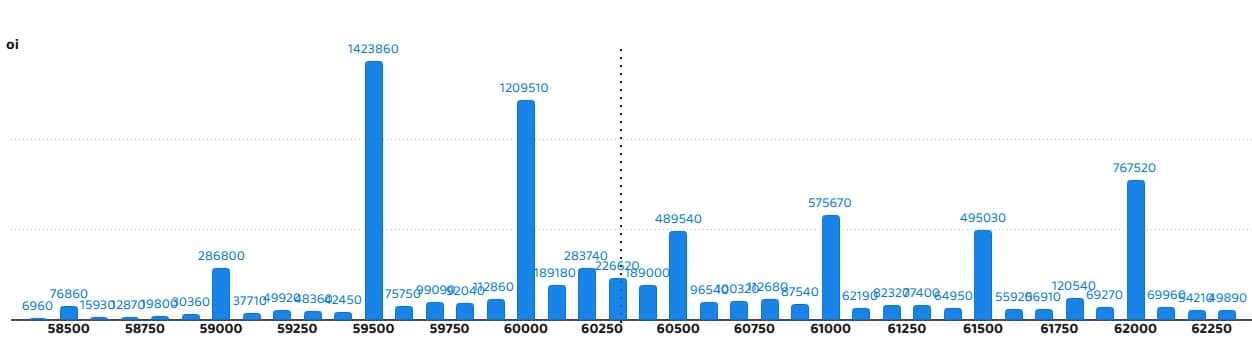
5) Bank Nifty Call Options Data
According to the monthly options data, the maximum Call open interest was seen at the 59,500 strike, with 14.23 lakh contracts. This can act as a key level for the index in the short term. It was followed by the 60,000 strike (12.09 lakh contracts) and the 62,000 strike (7.67 lakh contracts).
Maximum Call writing was observed at the 60,200 strike (with the addition of 59,520 contracts), followed by the 61,500 strike (41,820 contracts) and 60,400 strike (40,350 contracts). The maximum Call unwinding was seen at the 60,000 strike, which shed 18,660 contracts, followed by the 59,000 and 60,900 strikes which shed 17,790 and 10,590 contracts, respectively.
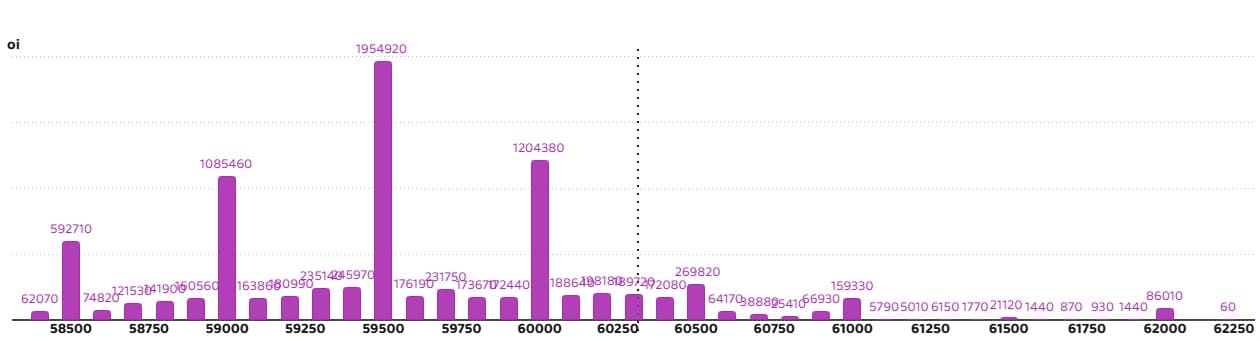
6) Bank Nifty Put Options Data
On the Put side, the 59,500 strike holds the maximum Put open interest (with 19.54 lakh contracts), which can act as a key support level for the index. This was followed by the 60,000 strike (12.04 lakh contracts) and the 59,000 strike (10.85 lakh contracts).
The maximum Put writing was placed at the 60,000 strike (which added 1.15 lakh contracts), followed by the 60,400 strike (81,930 contracts) and the 60,300 strike (77,880 contracts). The maximum Put unwinding was seen at the 59,000 strike, which shed 23,400 contracts, followed by the 58,500 and 58,600 strikes, which shed 22,560 and 10,320 contracts, respectively.
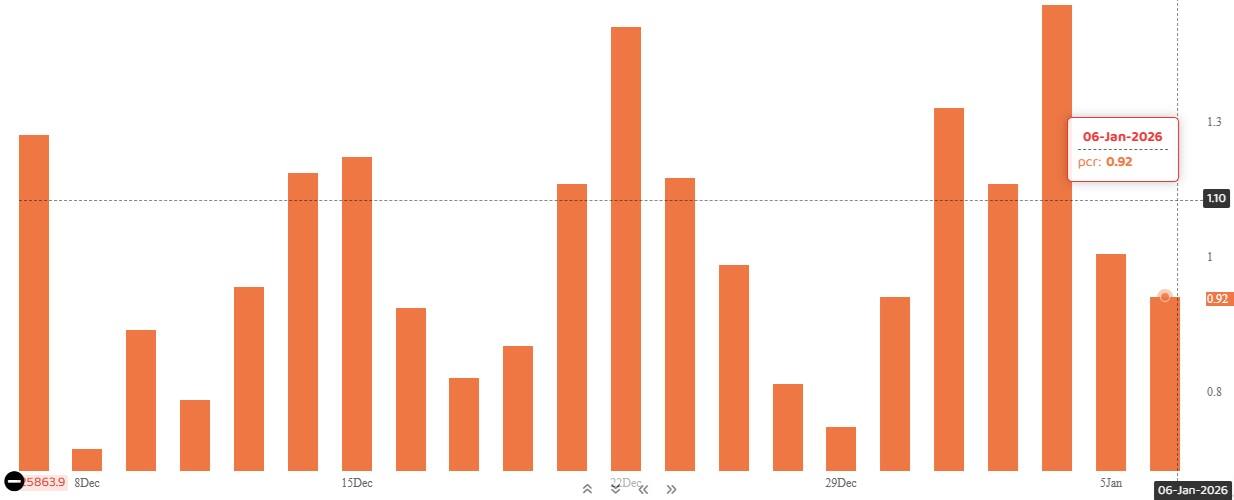
The Nifty Put-Call ratio (PCR), which indicates the mood of the market, fell further to 0.92 on January 6, compared to 1.00 in the previous session.
The increasing PCR, or being higher than 0.7 or surpassing 1, means traders are selling more Put options than Call options, which generally indicates the firming up of a bullish sentiment in the market. If the ratio falls below 0.7 or moves towards 0.5, then it indicates selling in Calls is higher than selling in Puts, reflecting a bearish mood in the market.
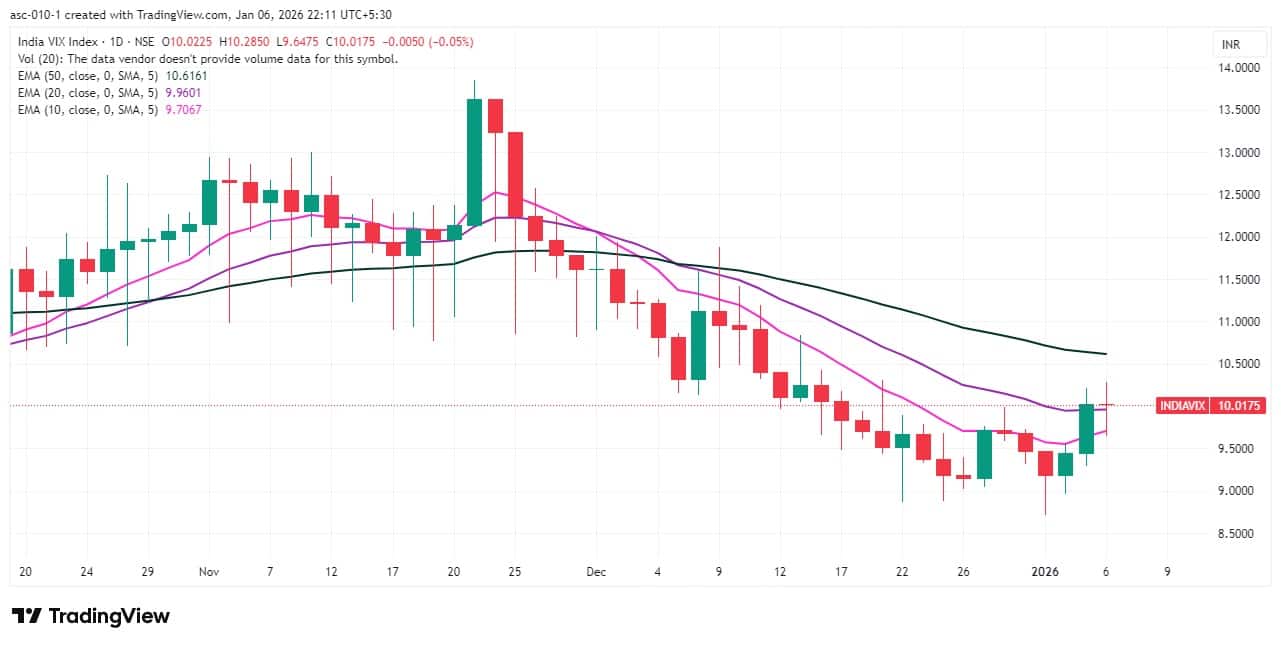
9) India VIX
India VIX, which measures expected market volatility, sustained above short-term moving averages, though it declined 0.05 percent to 10.02 after a two-day winning streak. This signals some caution but does not pose a major risk for bulls as long as the VIX remains below the 12 level.
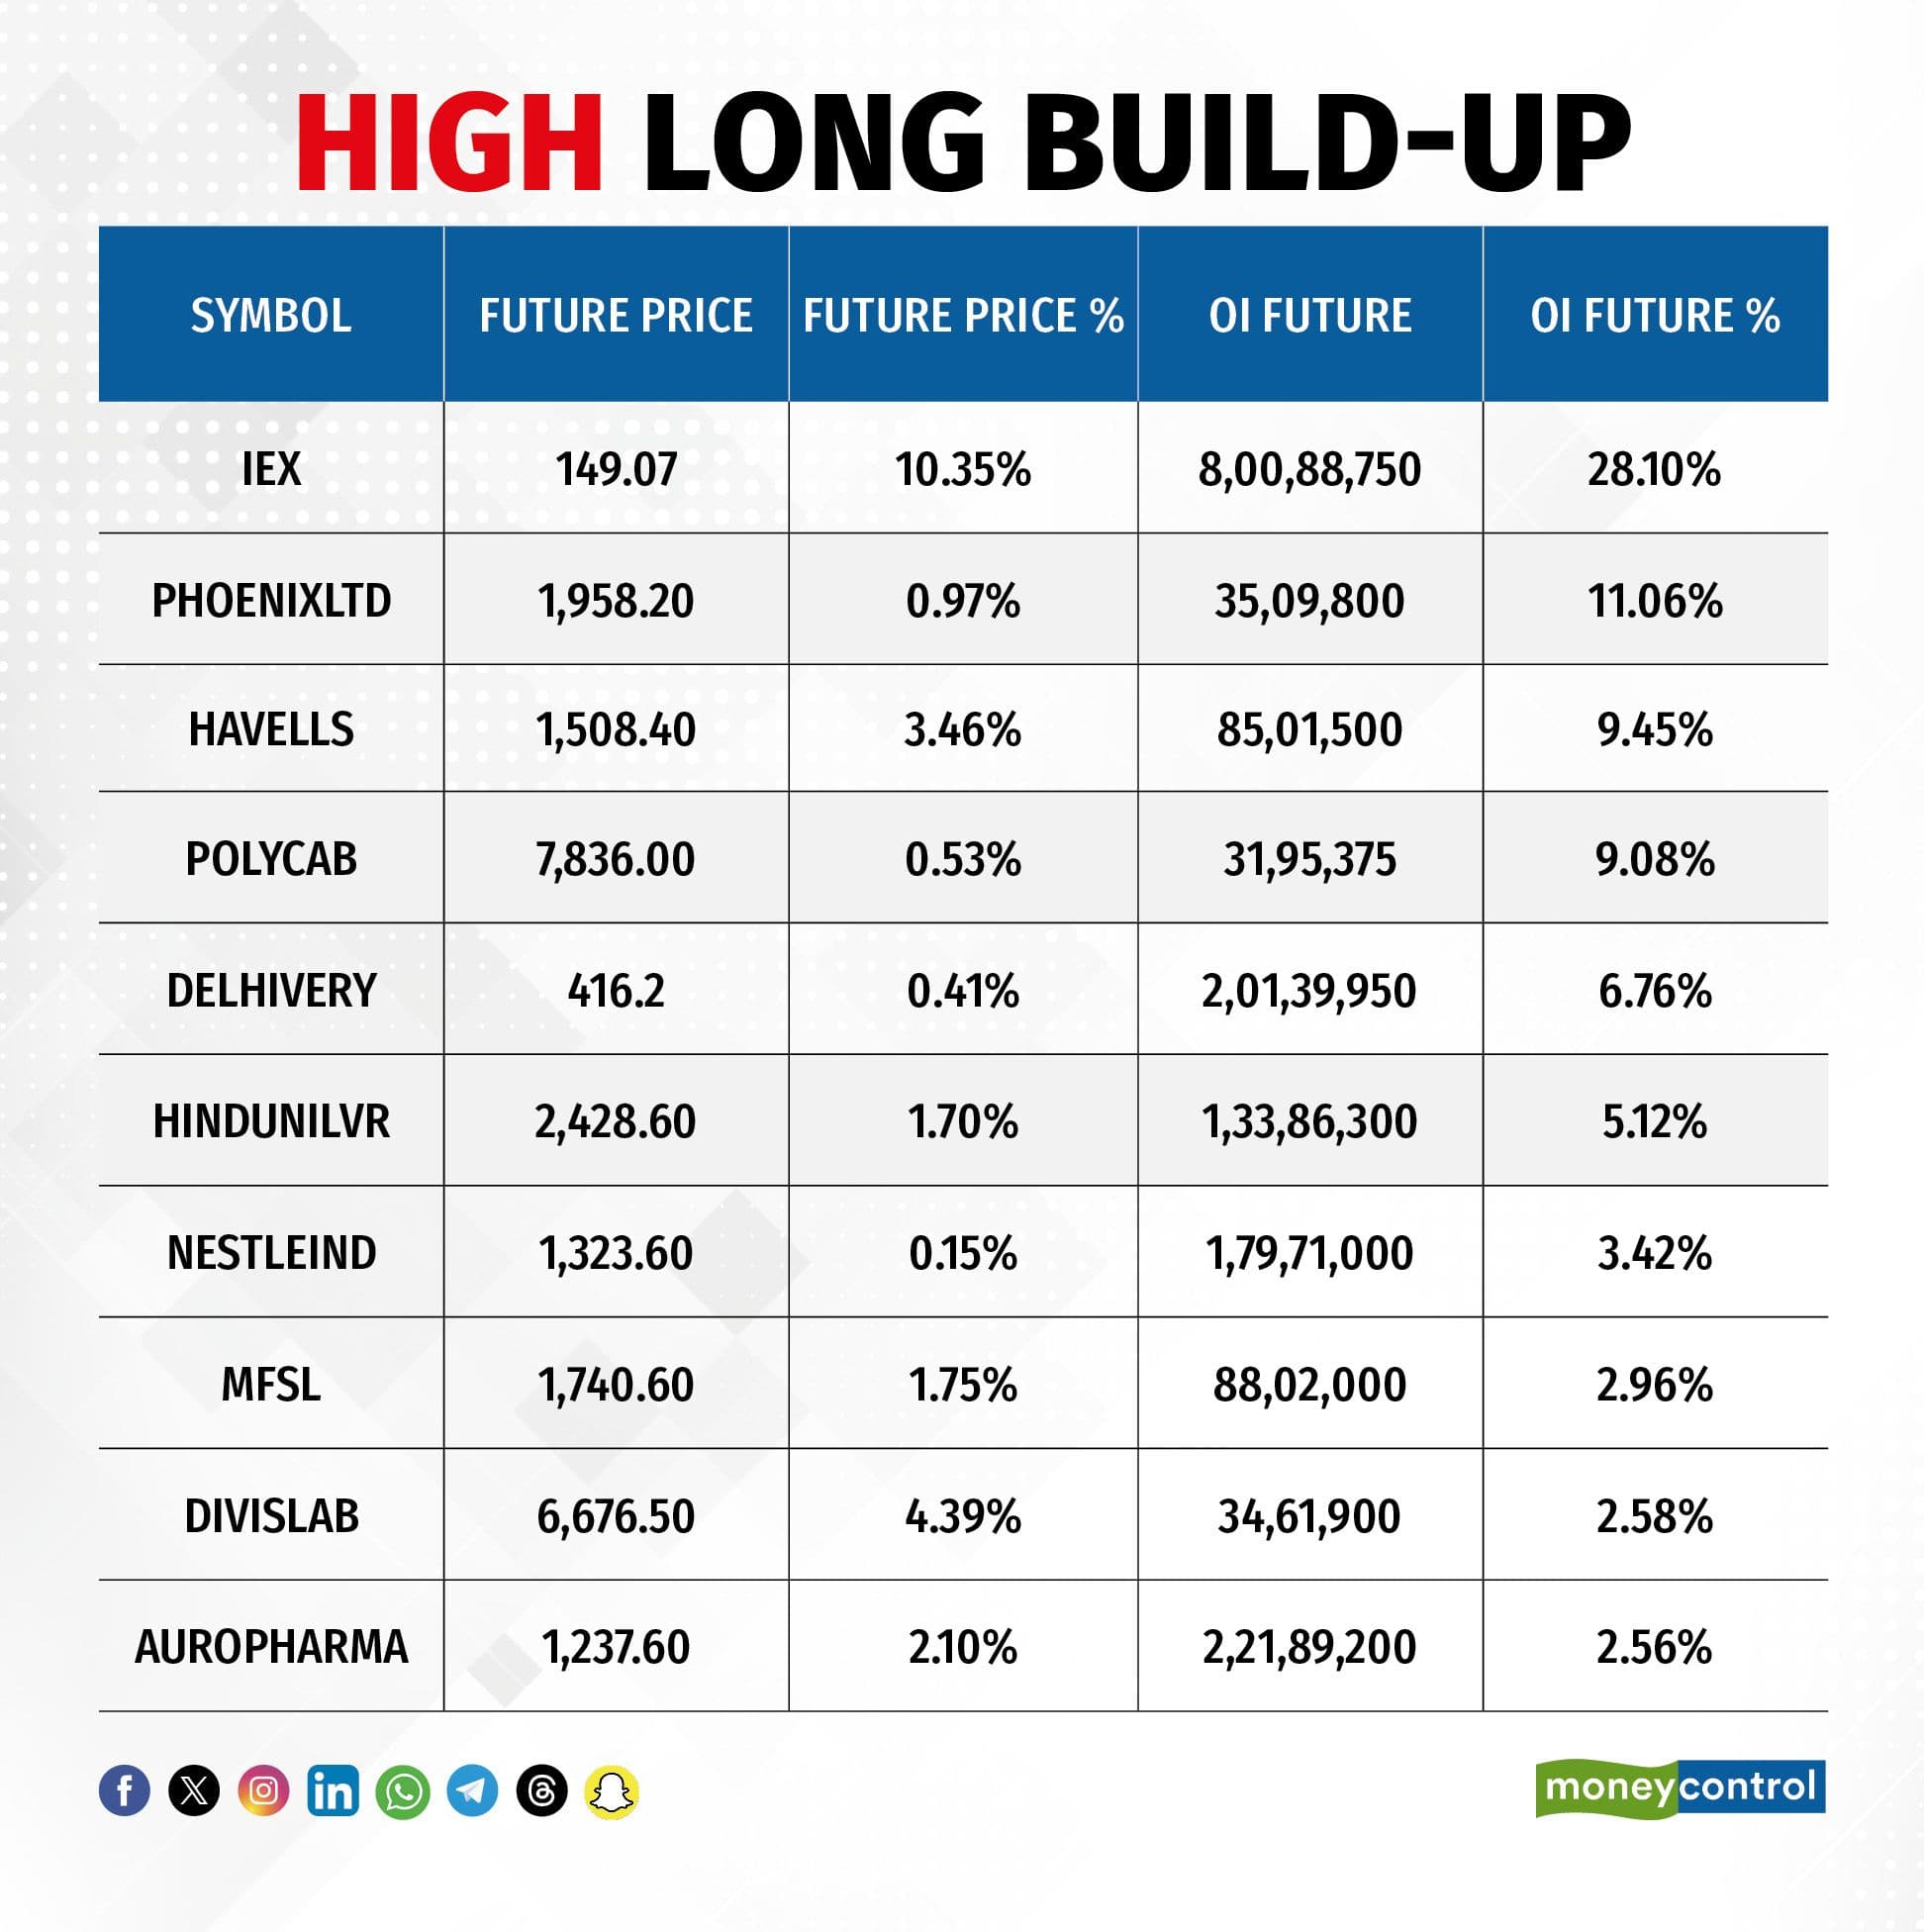
A long build-up was seen in 58 stocks. An increase in open interest (OI) and price indicates a build-up of long positions.
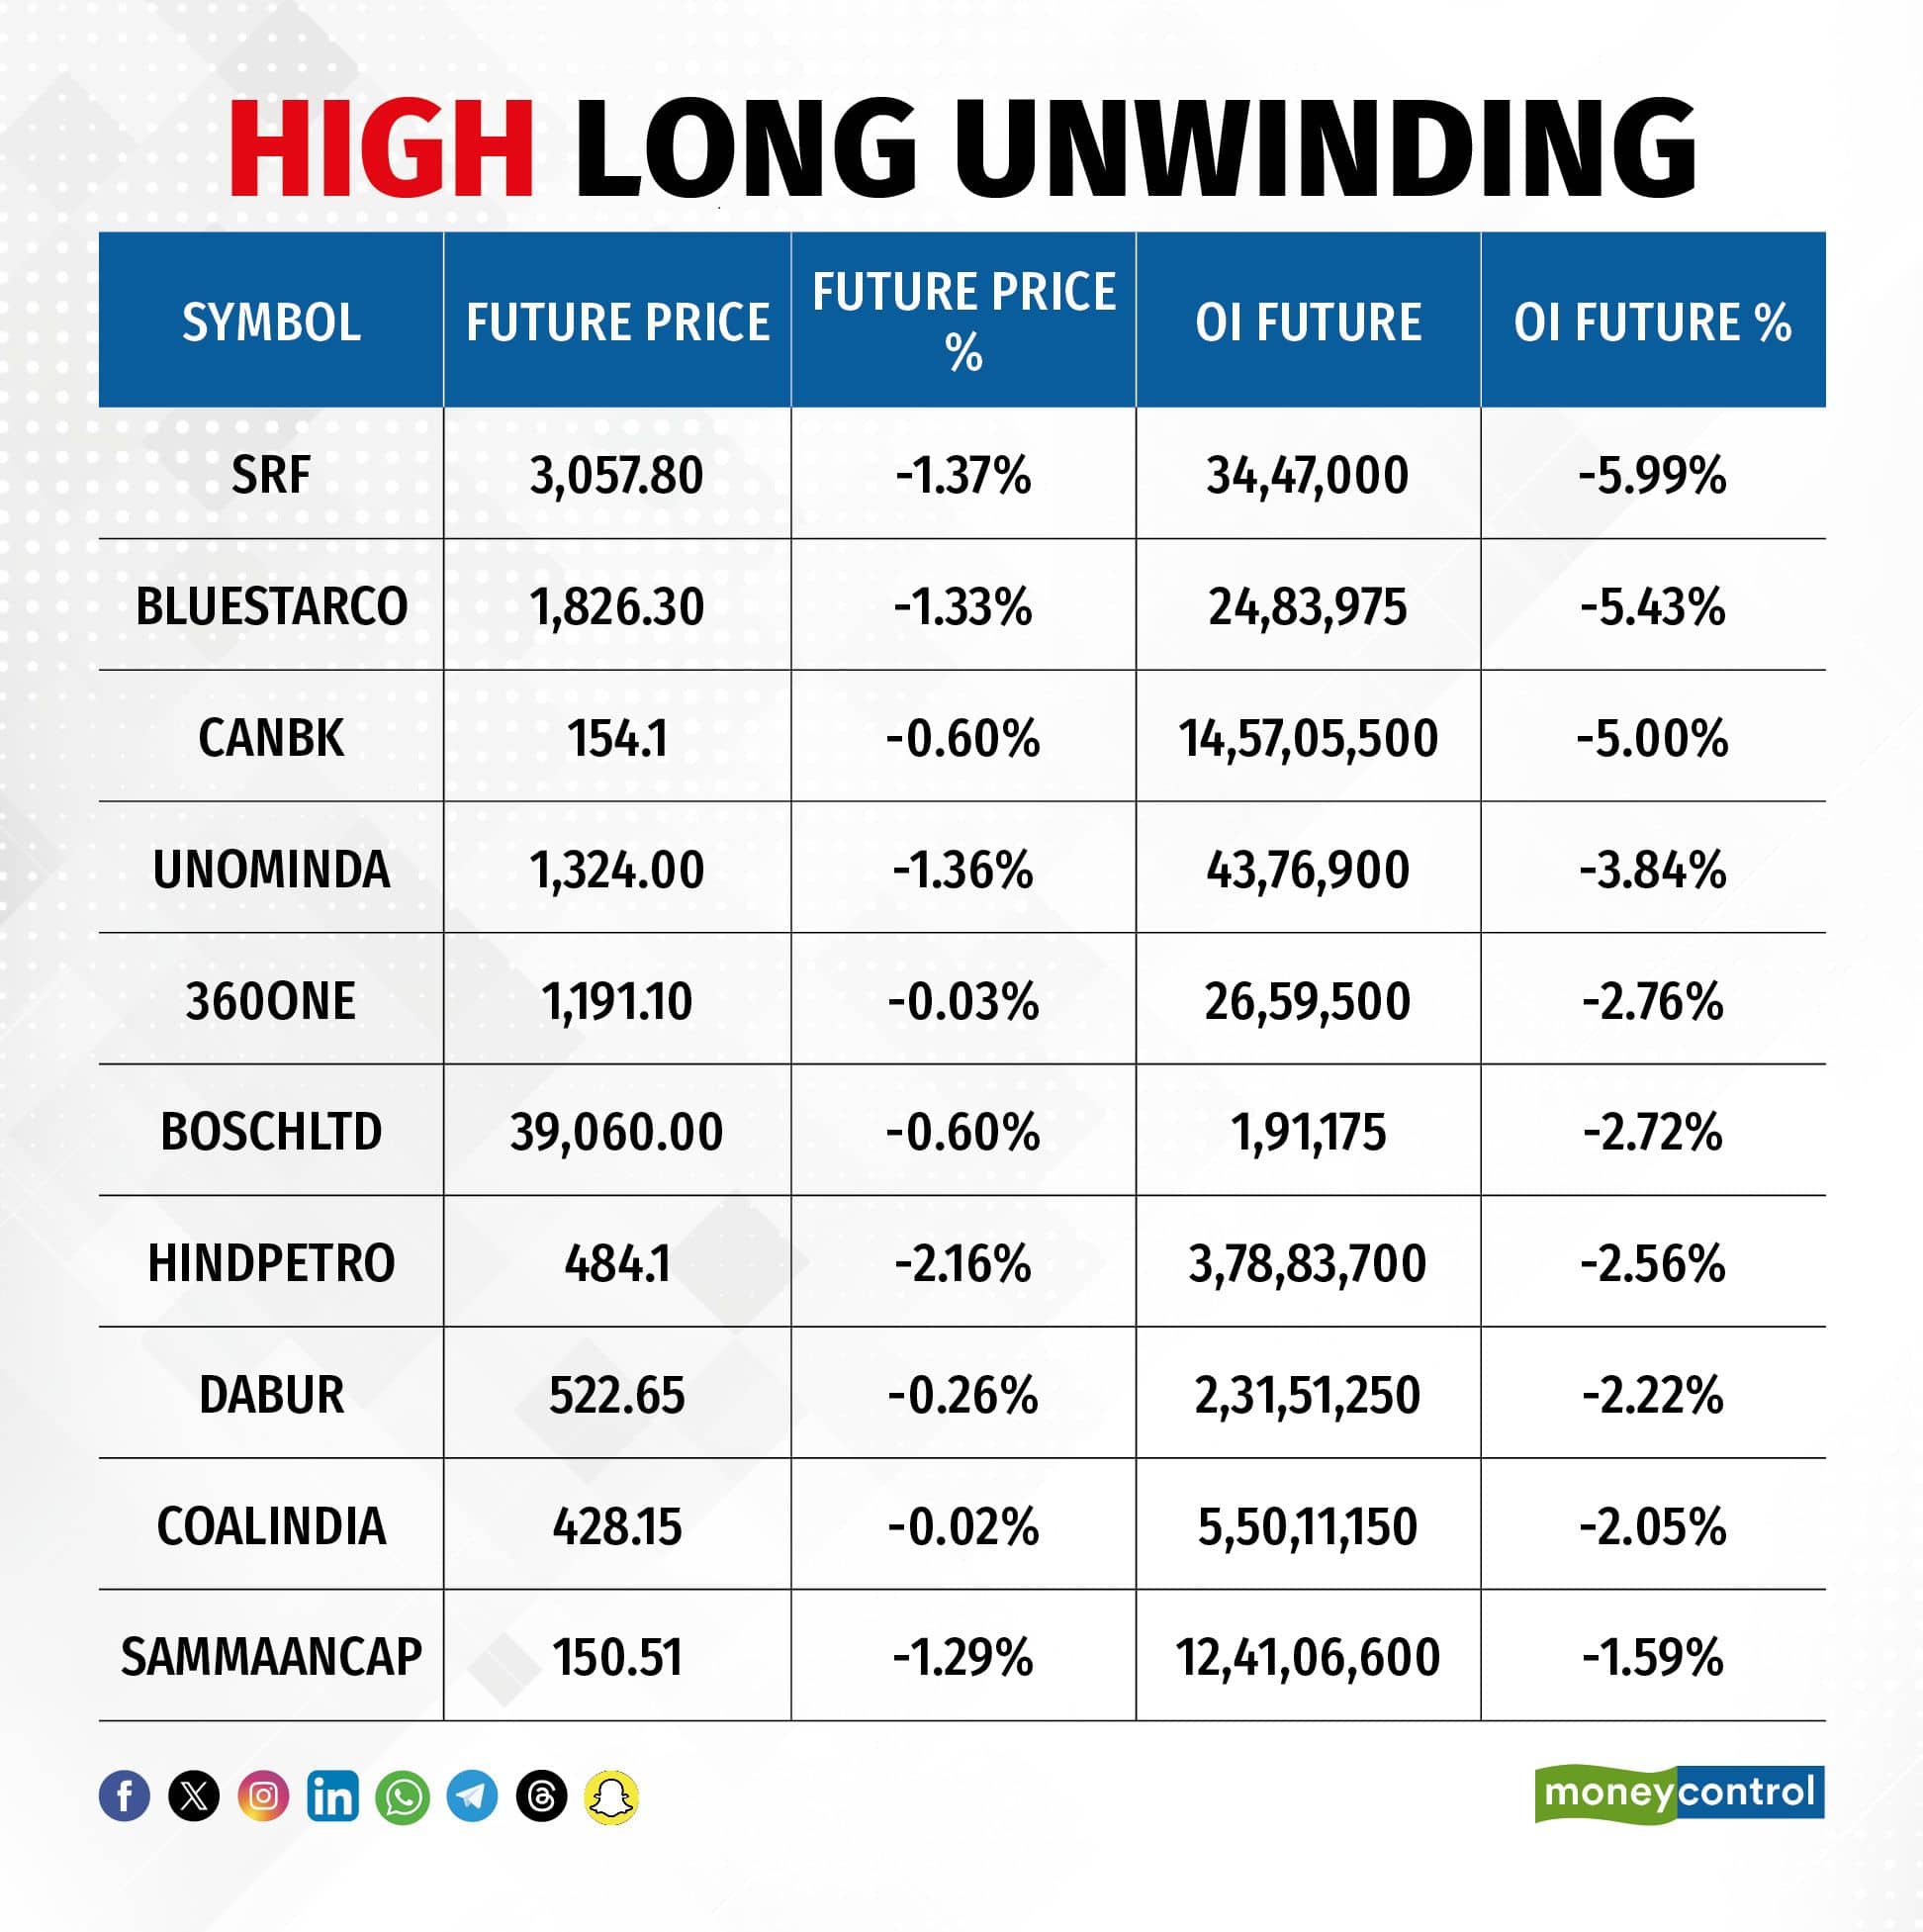
11) Long Unwinding (34 Stocks)
34 stocks saw a decline in open interest (OI) along with a fall in price, indicating long unwinding.
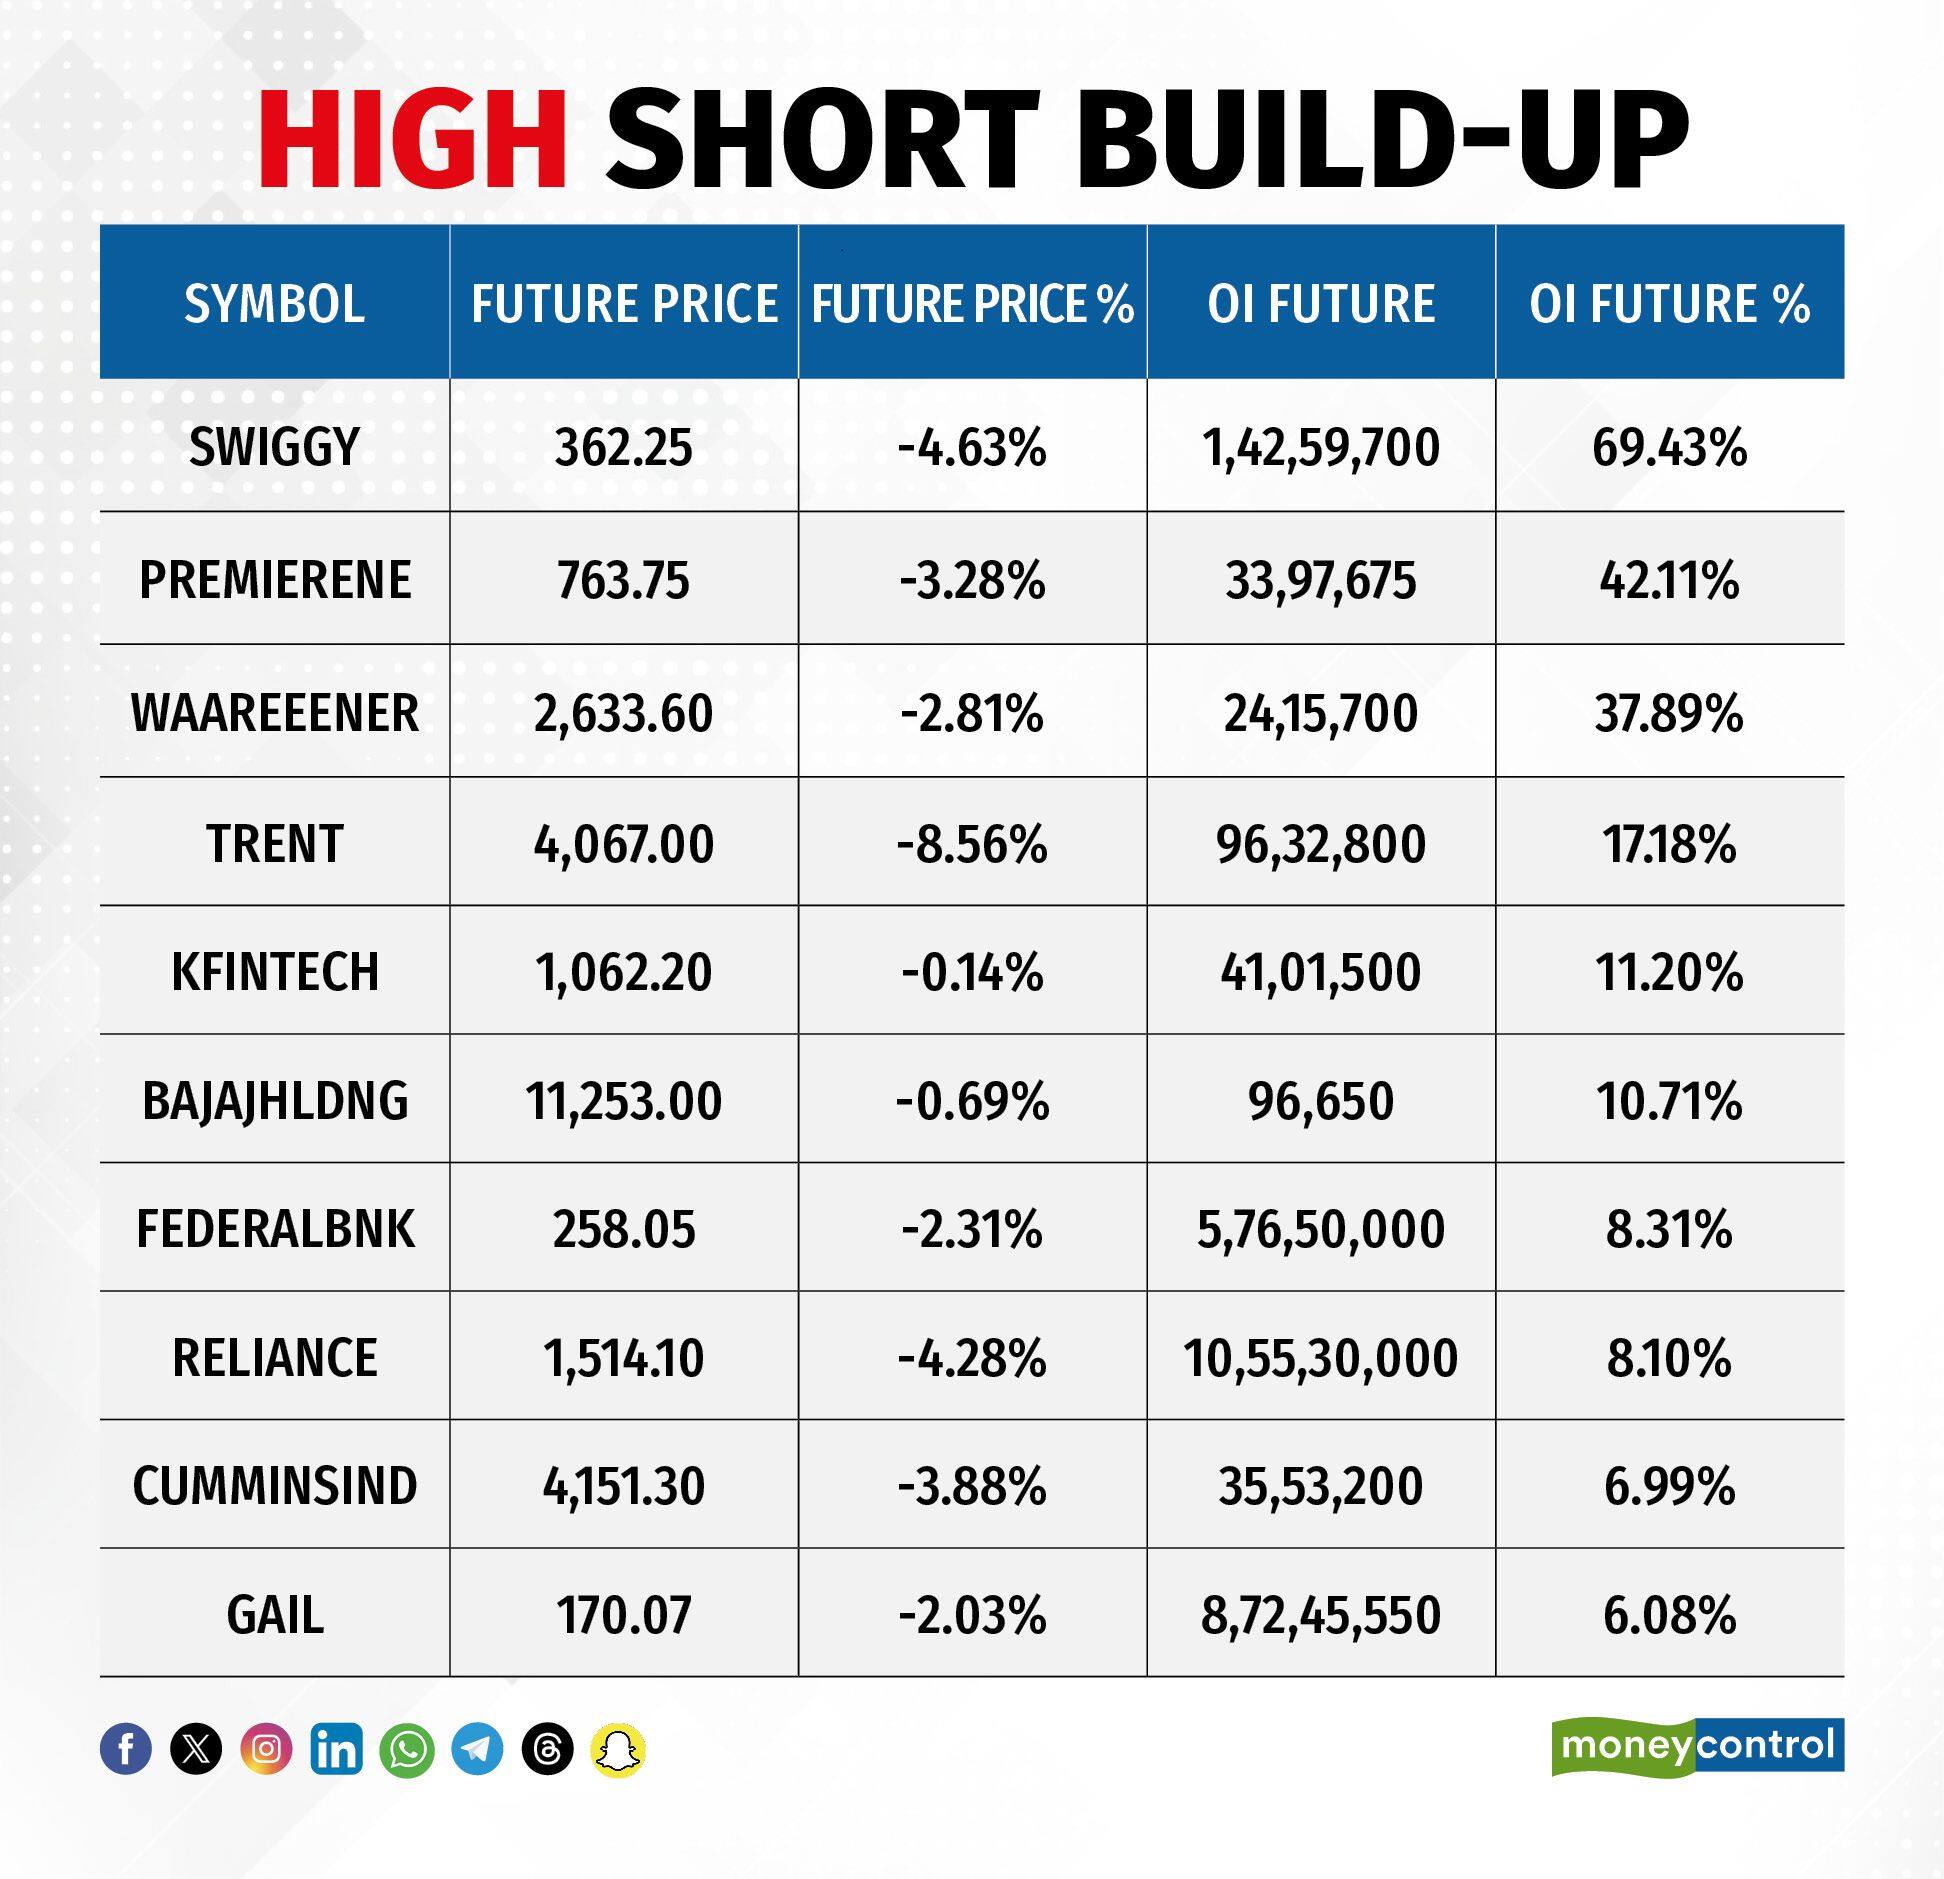
12) Short Build-up (72 Stocks)
72 stocks saw an increase in OI along with a fall in price, indicating a build-up of short positions.
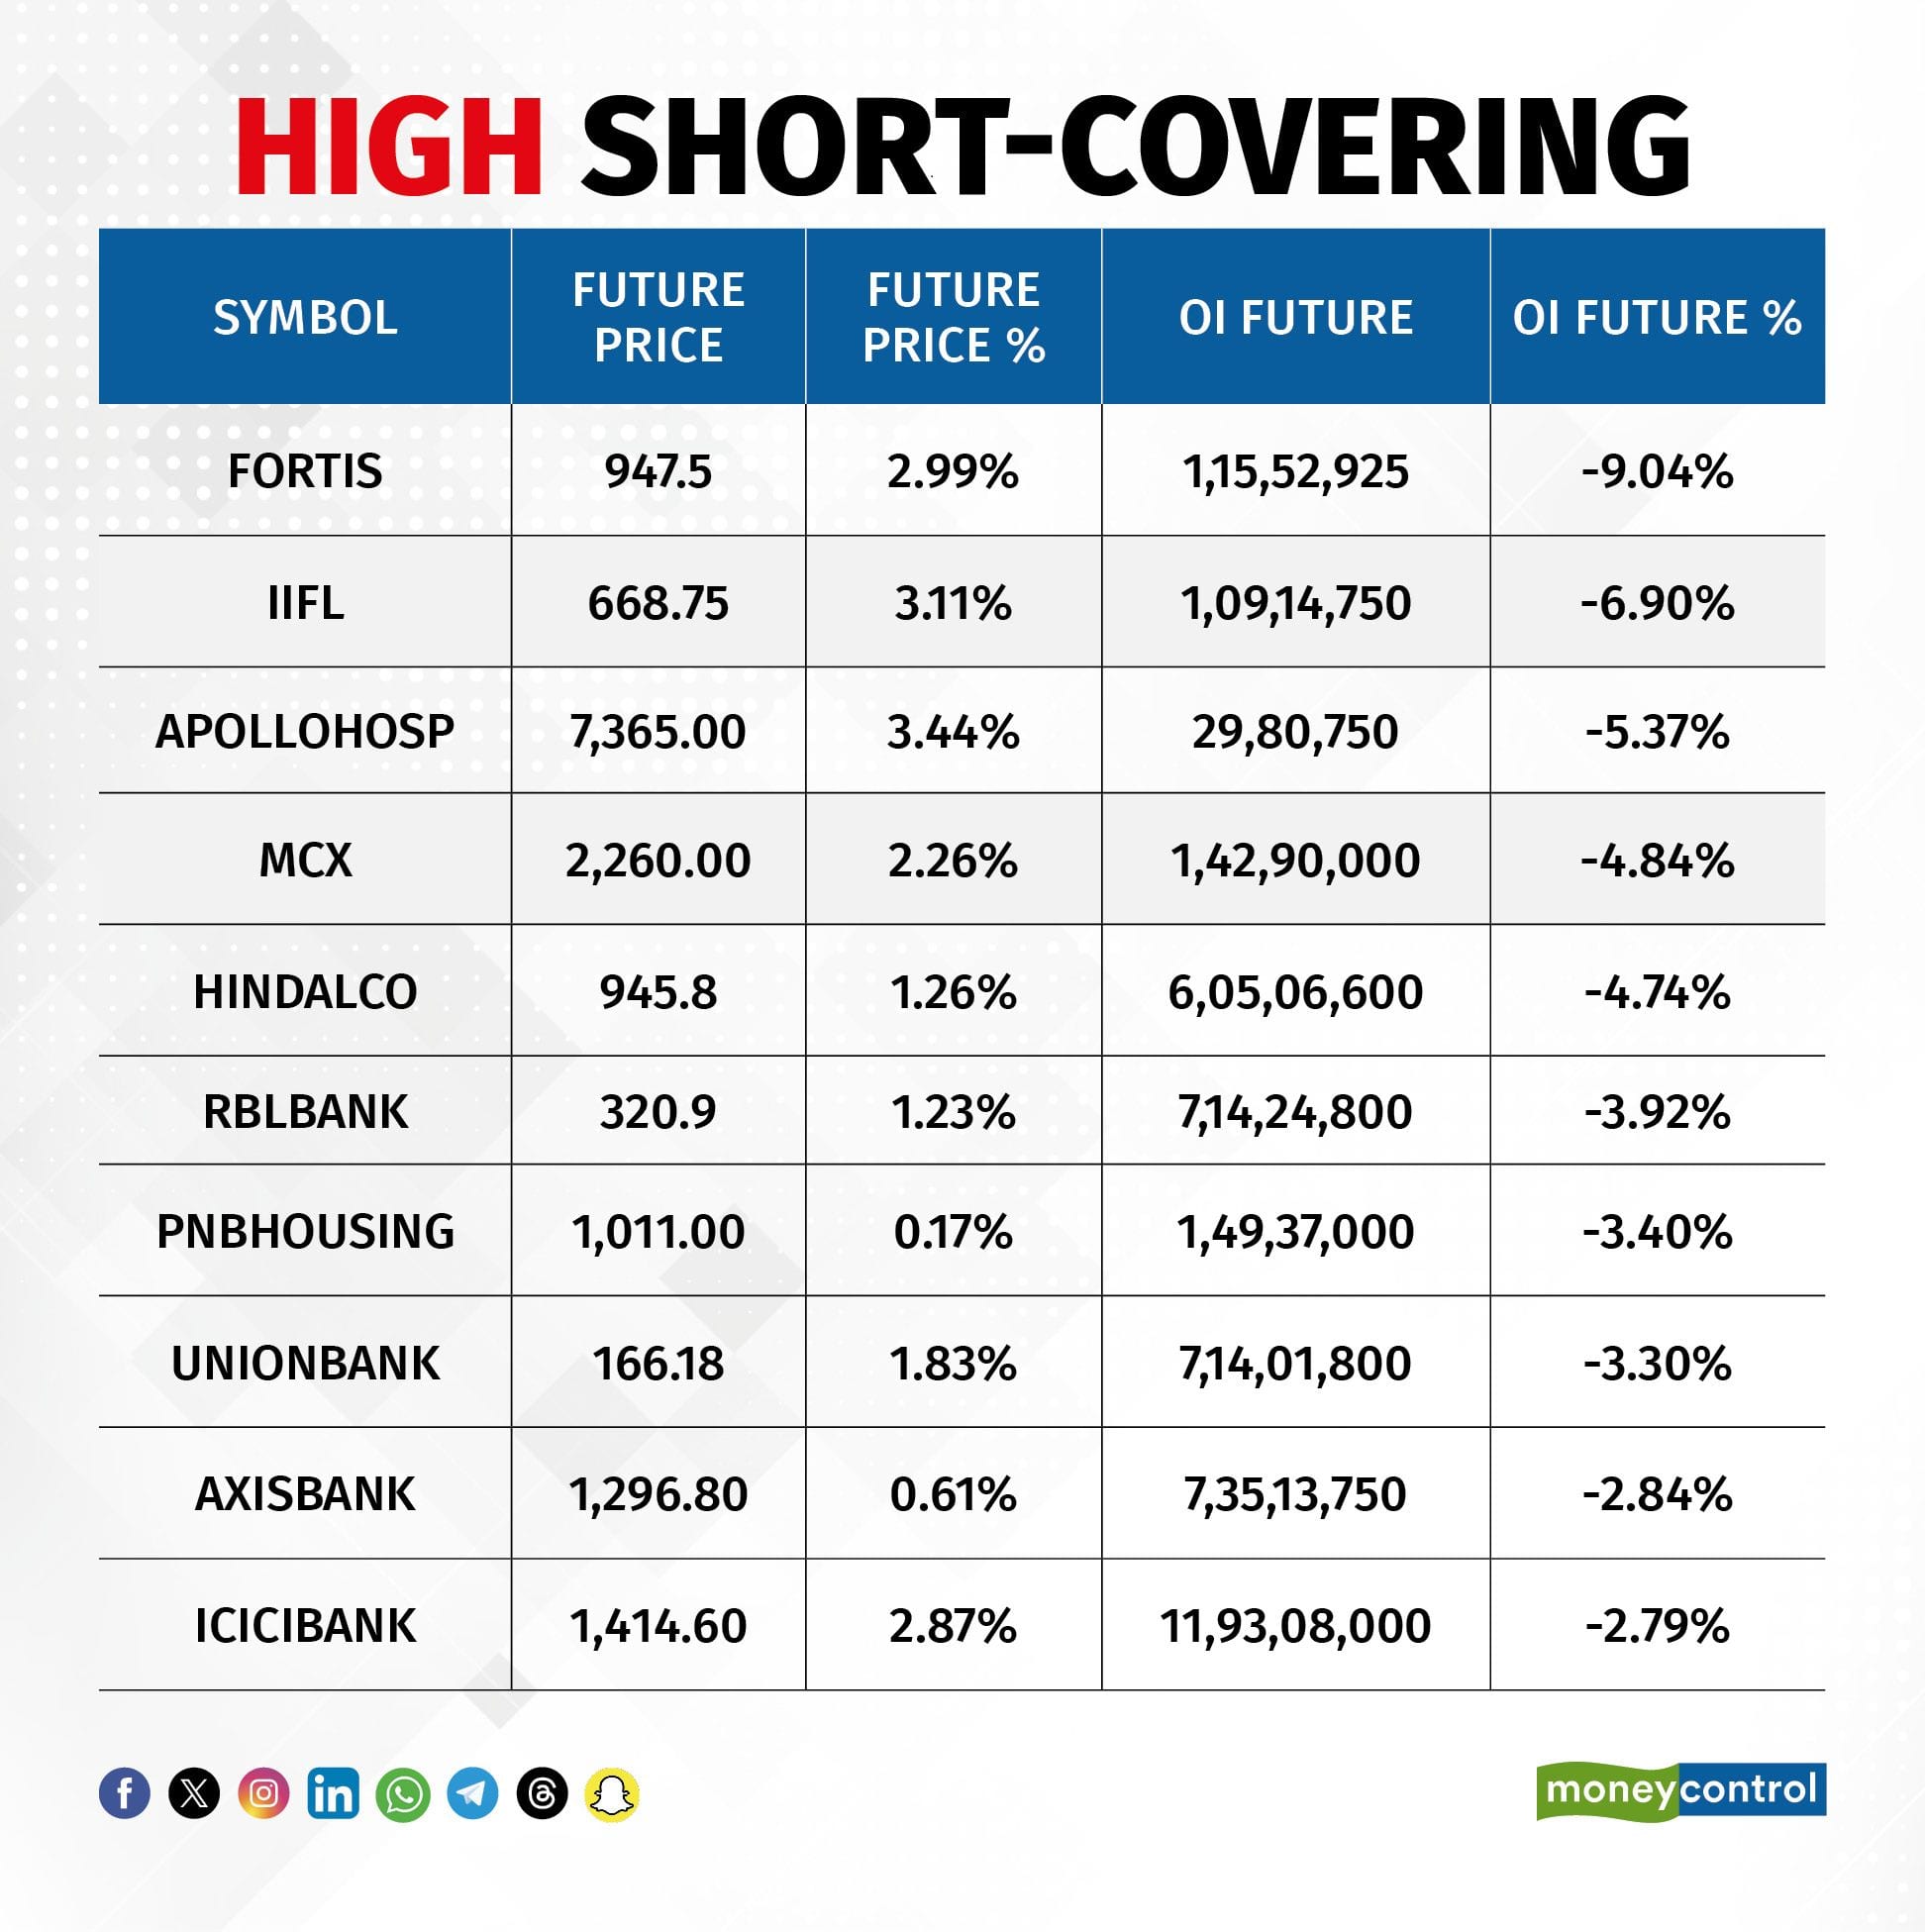
13) Short-Covering (46 Stocks)
46 stocks saw short-covering, meaning a decrease in OI, along with a price increase.
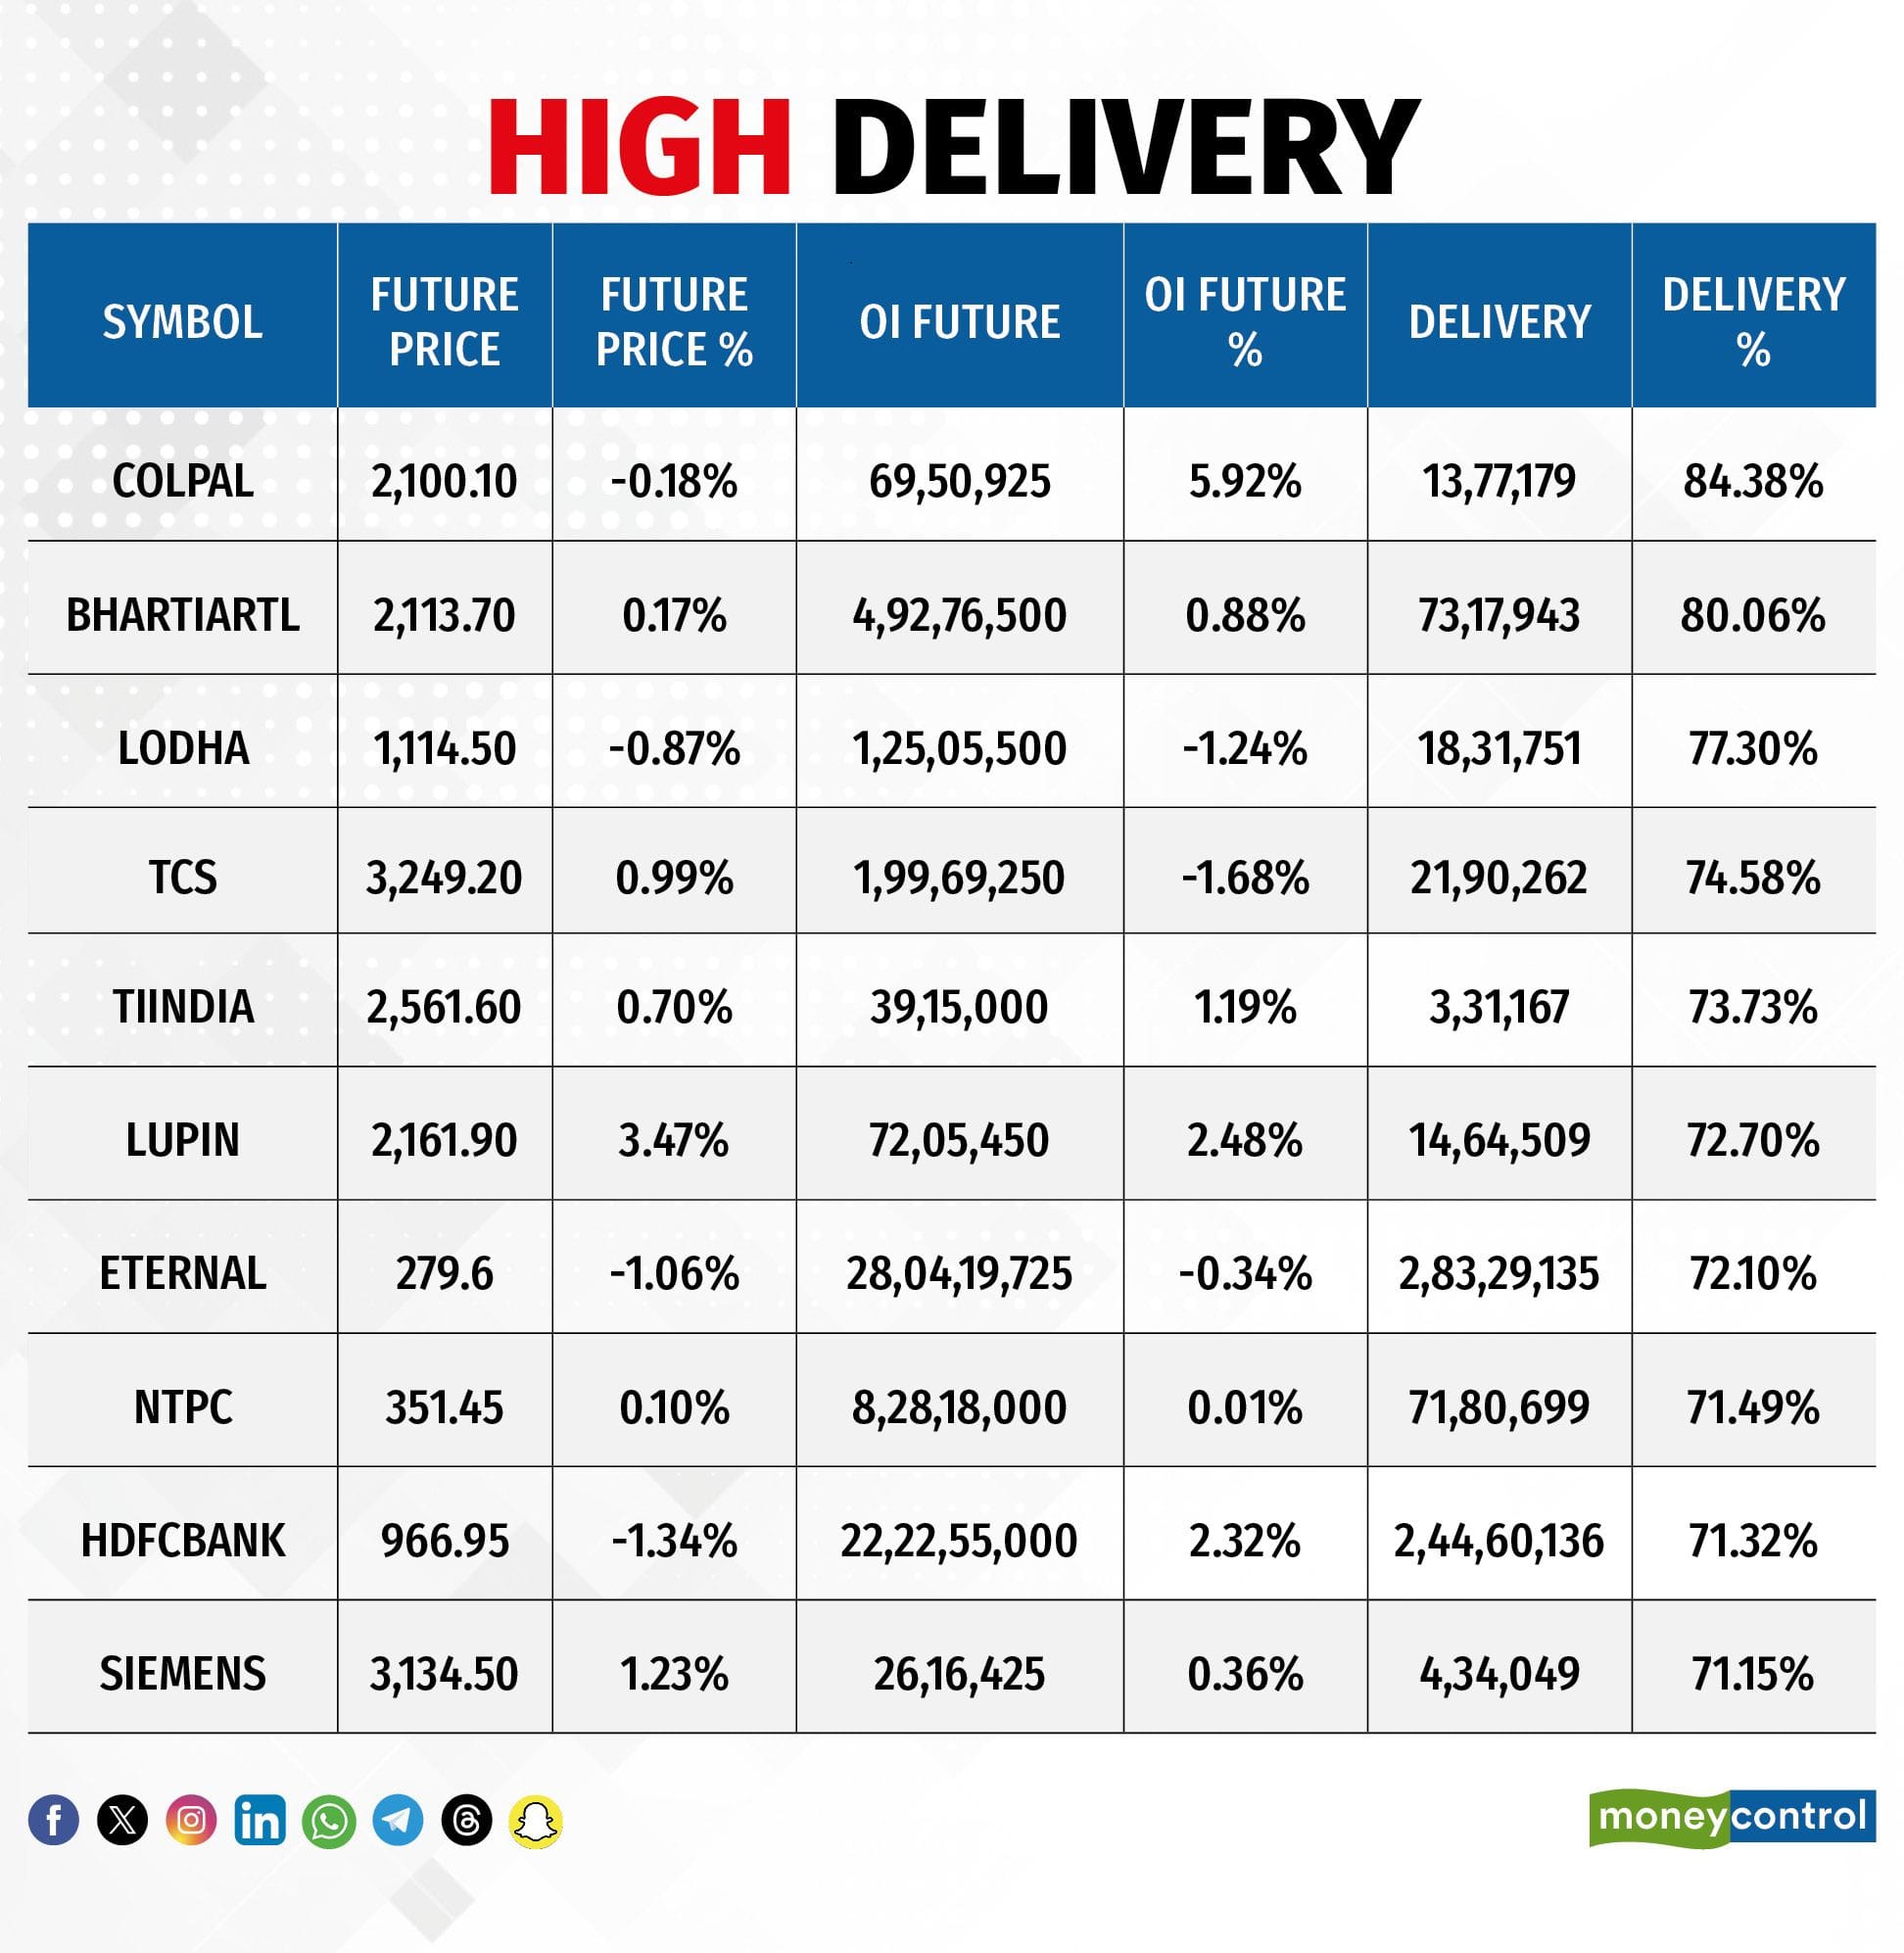
Here are the stocks that saw a high share of delivery trades. A high share of delivery reflects investing (as opposed to trading) interest in a stock.
Securities banned under the F&O segment include companies where derivative contracts cross 95 percent of the market-wide position limit.
Stocks added to F&O ban: Nil
Stocks retained in F&O ban: SAIL, Sammaan Capital
Stocks removed from F&O ban: Nil
Disclaimer: The views and investment tips expressed by experts on Moneycontrol are their own and not those of the website or its management. Moneycontrol advises users to check with certified experts before taking any investment decisions.Disclaimer: Moneycontrol is a part of the Network18 group. Network18 is controlled by Independent Media Trust, of which Reliance Industries is the sole beneficiary.Discover the latest Business News, Sensex, and Nifty updates. Obtain Personal Finance insights, tax queries, and expert opinions on Moneycontrol or download the Moneycontrol App to stay updated!
Find the best of Al News in one place, specially curated for you every weekend.
Stay on top of the latest tech trends and biggest startup news.


