


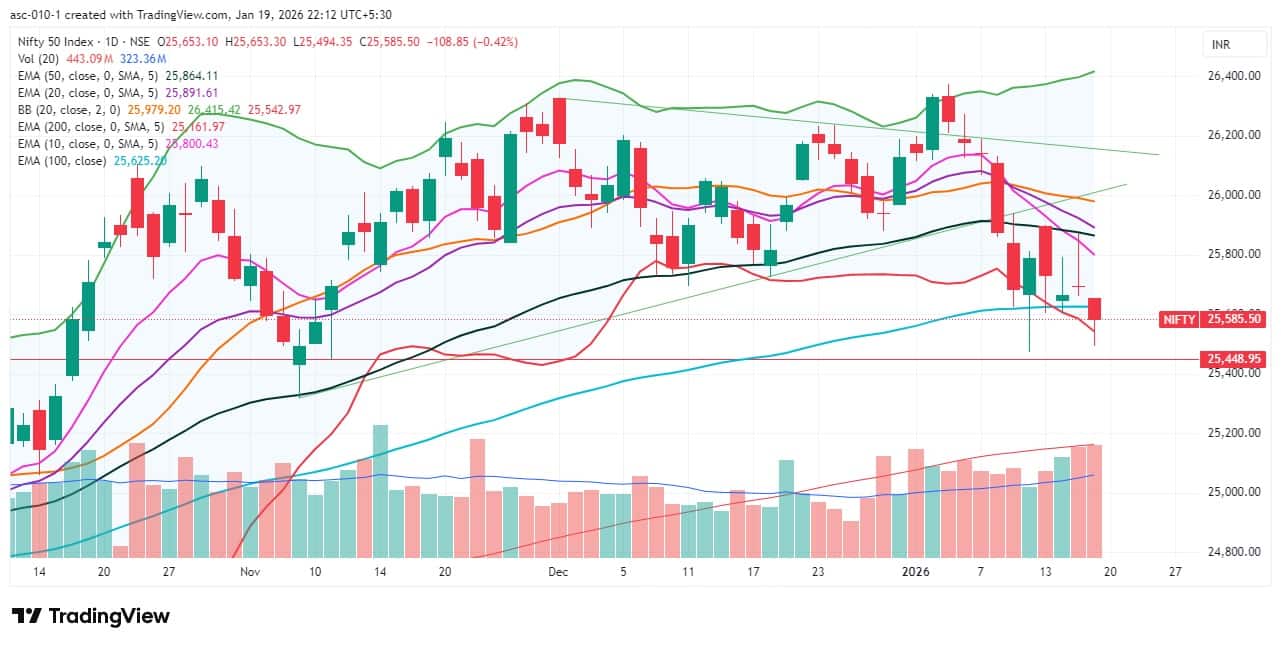
The market started the week on a disappointing note, with the Nifty 50 losing 0.4 percent on January 19 and falling below the 100-day EMA for the first time since October 2025. Given the index has slipped below all key moving averages (except the 200 DEMA) and momentum indicators are weakening, a bearish to sideways trade may be seen in the next few sessions. If the index sustains below 25,600, a fall toward 25,450 (the immediate crucial support) cannot be ruled out. However, on the higher side, the 25,700–25,800 zone can act as a resistance area, experts said.
Here are 15 data points we have collated to help you spot profitable trades:
1) Key Levels For The Nifty 50 (25,586)
Resistance based on pivot points: 25,638, 25,676, and 25,737
Support based on pivot points: 25,517, 25,479, and 25,419
Special Formation: The Nifty 50 formed a bearish candle with a long lower shadow on the daily timeframe, indicating pressure at higher levels and buying interest at lower levels. The index is near the lower Bollinger Band and is now trading below the 20-, 50-, and 100-day EMAs. The RSI dropped to 37.34, and the Stochastic RSI turned bearish, while the MACD remained below the zero line and signal line, with weakness in the histogram. All this indicates continued bearish bias in the near term.
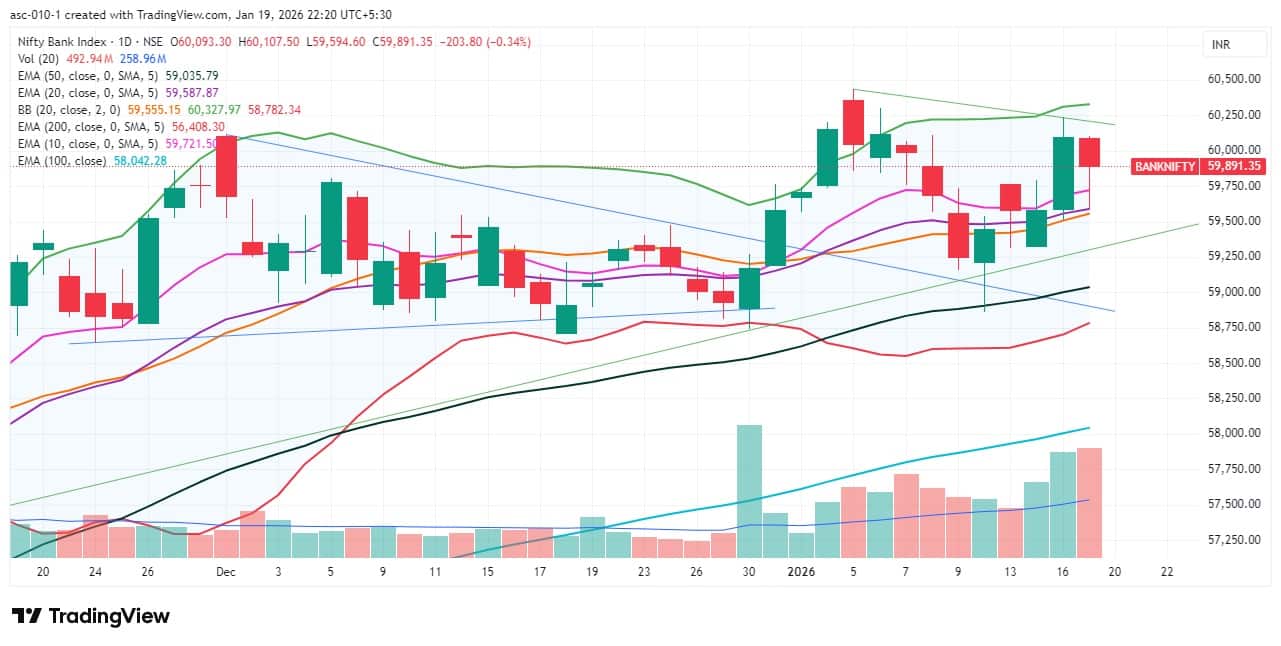
2) Key Levels For The Bank Nifty (59,891)
Resistance based on pivot points: 60,060, 60,181, and 60,377
Support based on pivot points: 59,669, 59,548, and 59,352
Resistance based on Fibonacci retracement: 60,097, 60,430
Support based on Fibonacci retracement: 59,550, 59,391
Special Formation: The Bank Nifty also reported a Nifty-like candlestick pattern but traded within the previous day’s range, falling 0.34 percent. The index almost tested the 20-day EMA and moved closer to the midline of the Bollinger Bands but defended both levels on a closing basis. The RSI slightly turned bearish but still held above the 50 mark at 57.29. The Stochastic RSI sustained a positive crossover, while the MACD is on the verge of a bullish crossover, with weakness in the histogram almost fading. All this indicates relative resilience compared to the broader market.
According to the weekly options data, the maximum Call open interest was seen at the 25,800 strike (with 1.61 crore contracts). This level can act as a key resistance level for the Nifty in the short term. It was followed by the 26,000 strike (1.59 crore contracts) and 25,900 strike (1.33 crore contracts).
Maximum Call writing was observed at the 25,600 strike, which saw an addition of 98.07 lakh contracts, followed by the 25,650 and 25,550 strikes, which added 67.71 lakh and 58.03 lakh contracts, respectively. The maximum Call unwinding was seen at the 26,250 strike, which shed 10.41 lakh contracts, followed by the 26,150 and 26,100 strikes, which shed 6.18 lakh and 2.11 lakh contracts, respectively.
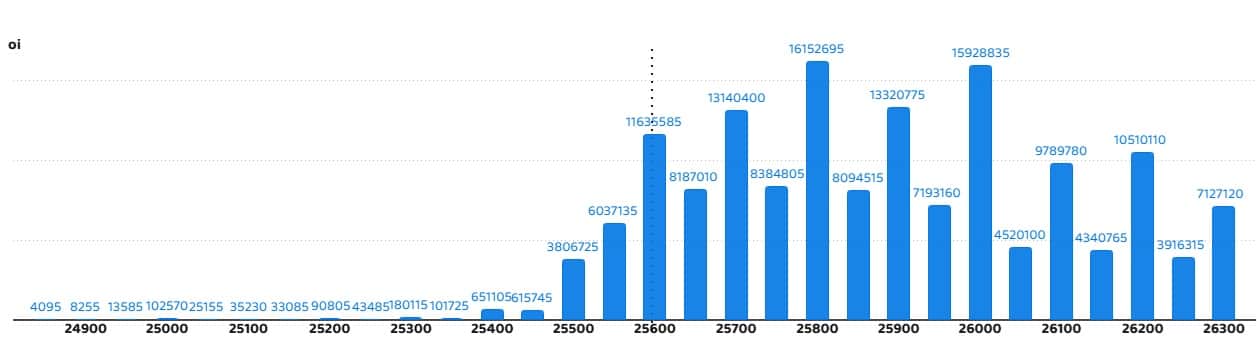
On the Put side, the 25,500 strike holds the maximum Put open interest (with 1.39 crore contracts), which can act as a key support level for the Nifty in the short term. It was followed by the 25,400 strike (1.08 crore contracts) and the 25,000 strike (88.17 lakh contracts).
The maximum Put writing was placed at the 25,500 strike, which saw an addition of 65.39 lakh contracts, followed by the 25,400 and 25,550 strikes, which added 48.96 lakh and 44.42 lakh contracts, respectively. The maximum Put unwinding was seen at the 25,700 strike, which shed 35.71 lakh contracts, followed by the 25,800 and 25,750 strikes, which shed 27.8 lakh and 18.44 lakh contracts, respectively.
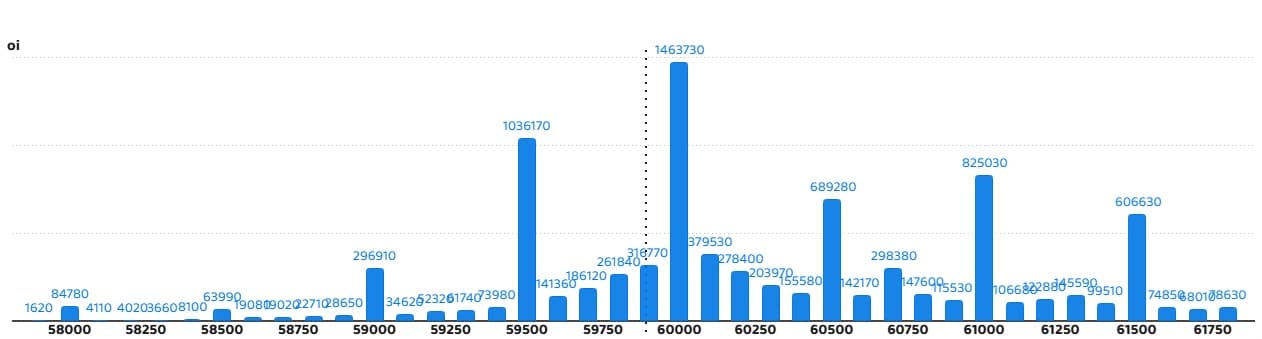
5) Bank Nifty Call Options Data
According to the monthly options data, the maximum Call open interest was seen at the 60,000 strike, with 14.63 lakh contracts. This can act as a key resistance level for the index in the short term. It was followed by the 59,500 strike (10.36 lakh contracts) and the 61,000 strike (8.25 lakh contracts).
Maximum Call writing was observed at the 59,900 strike (with the addition of 1.36 lakh contracts), followed by the 60,500 strike (80,910 contracts) and 59,800 strike (80,460 contracts). The maximum Call unwinding was seen at the 59,500 strike, which shed 4.48 lakh contracts, followed by the 60,300 and 60,200 strikes which shed 1.15 lakh and 76,770 contracts, respectively.
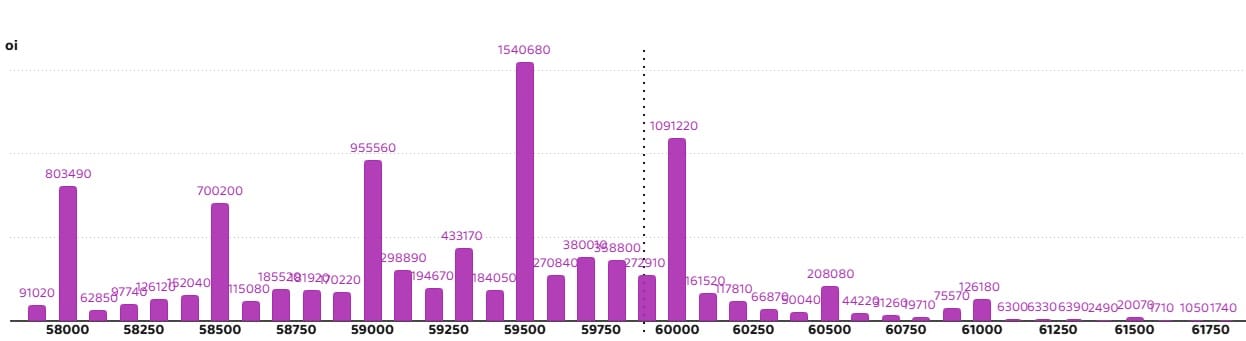
6) Bank Nifty Put Options Data
On the Put side, the 59,500 strike holds the maximum Put open interest (with 15.4 lakh contracts), which can act as a key support level for the index. This was followed by the 60,000 strike (10.91 lakh contracts) and the 59,000 strike (9.55 lakh contracts).
The maximum Put writing was placed at the 59,300 strike (which added 1.32 lakh contracts), followed by the 60,900 strike (53,730 contracts) and the 59,900 strike (41,370 contracts). The maximum Put unwinding was seen at the 59,500 strike, which shed 4.89 lakh contracts, followed by the 60,000 and 59,000 strikes, which shed 2.3 lakh and 1.34 lakh contracts, respectively.
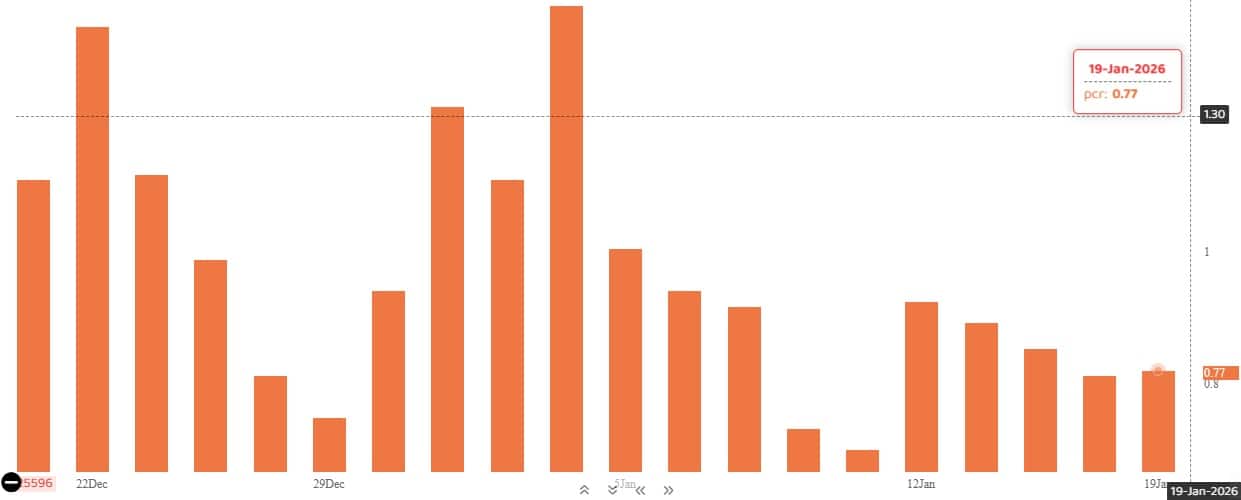
The Nifty Put-Call ratio (PCR), which indicates the mood of the market, rose to 0.77 on January 19, compared to 0.76 in the previous session.
The increasing PCR, or being higher than 0.7 or surpassing 1, means traders are selling more Put options than Call options, which generally indicates the firming up of a bullish sentiment in the market. If the ratio falls below 0.7 or moves towards 0.5, then it indicates selling in Calls is higher than selling in Puts, reflecting a bearish mood in the market.
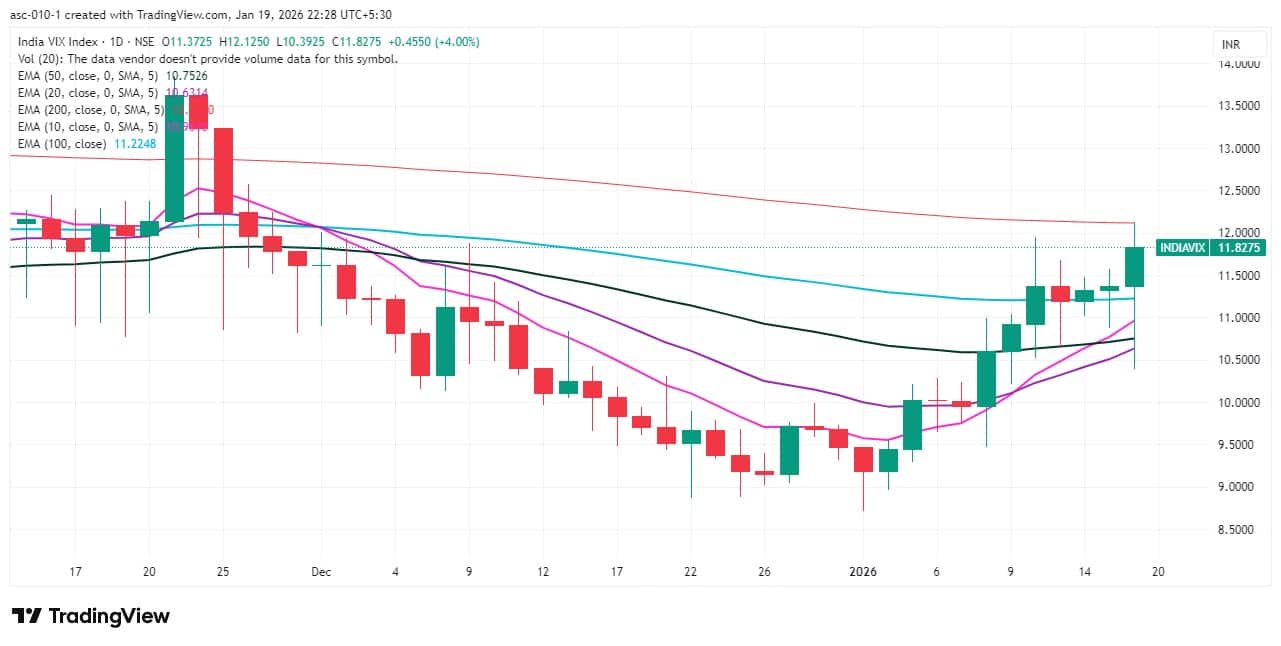
9) India VIX
India VIX, which measures expected market volatility, spiked above the 12 zone intraday before closing 4 percent higher at 11.83. With this move, the volatility index climbed above the 20-, 50-, and 100-day EMAs and tested the 200-day EMA intraday, signalling further caution for bulls.
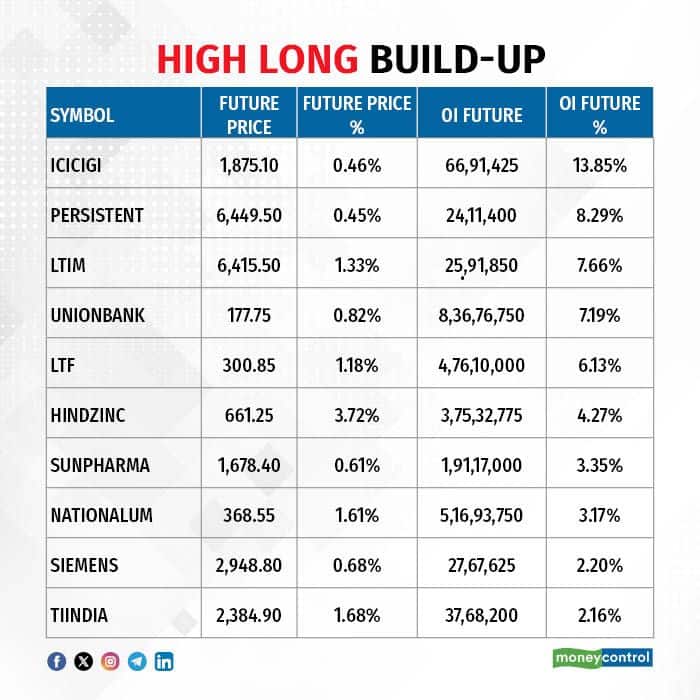
A long build-up was seen in 26 stocks. An increase in open interest (OI) and price indicates a build-up of long positions.
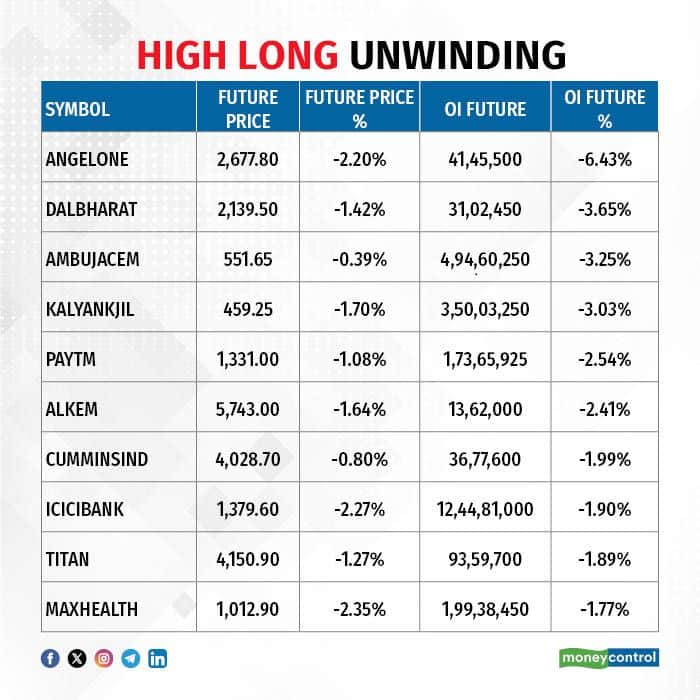
11) Long Unwinding (54 Stocks)
54 stocks saw a decline in open interest (OI) along with a fall in price, indicating long unwinding.
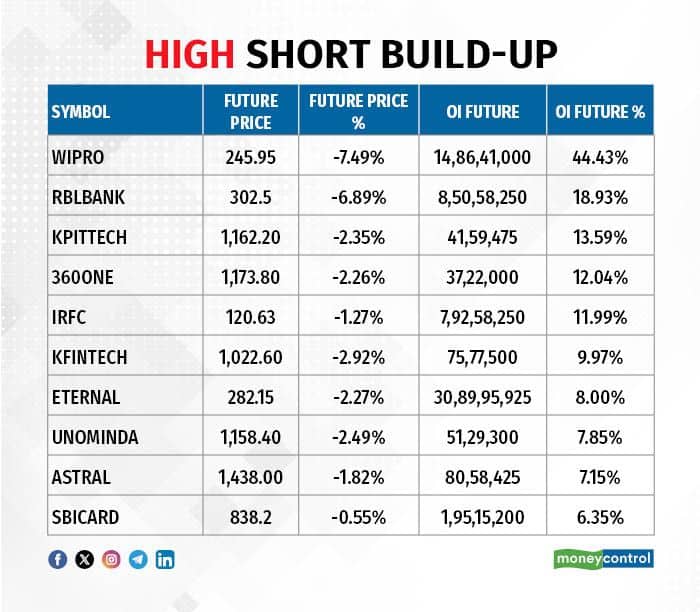
12) Short Build-up (98 Stocks)
98 stocks saw an increase in OI along with a fall in price, indicating a build-up of short positions.
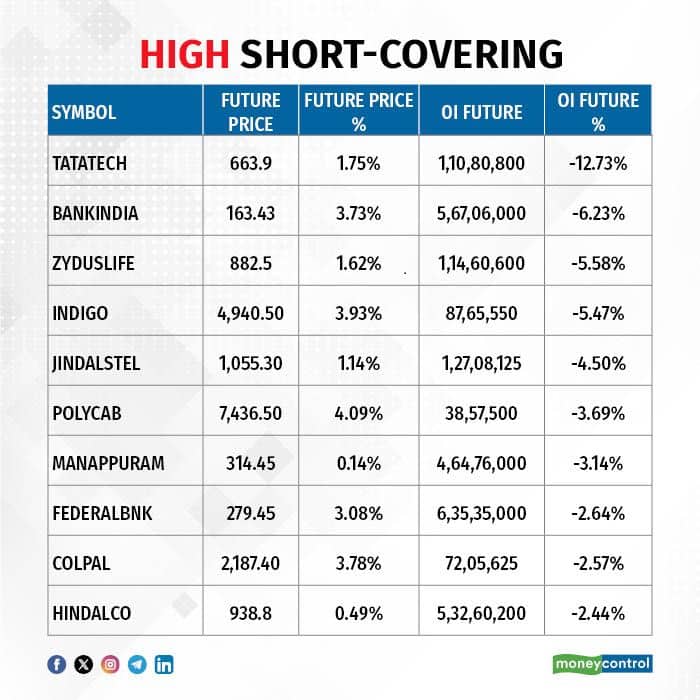
13) Short-Covering (34 Stocks)
34 stocks saw short-covering, meaning a decrease in OI, along with a price increase.
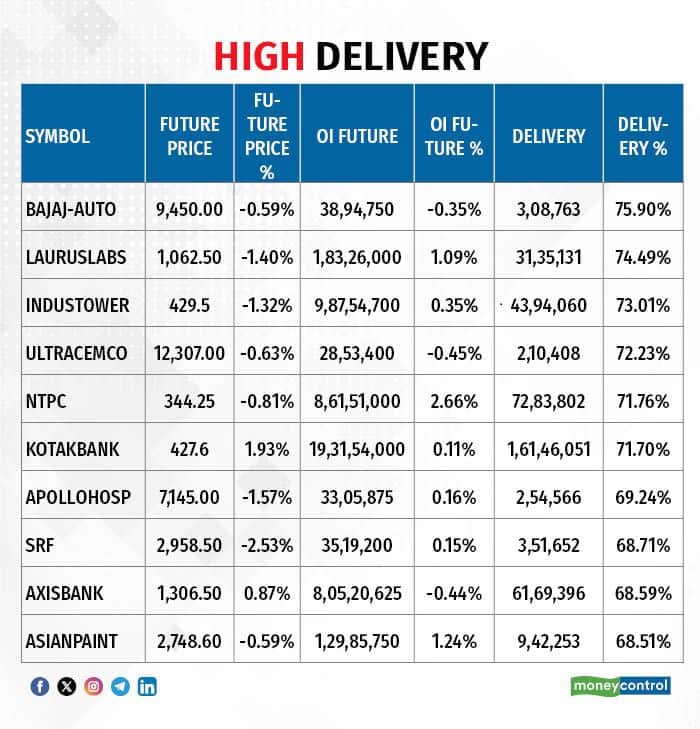
Here are the stocks that saw a high share of delivery trades. A high share of delivery reflects investing (as opposed to trading) interest in a stock.
Securities banned under the F&O segment include companies where derivative contracts cross 95 percent of the market-wide position limit.
Stocks added to F&O ban: Nil
Stocks retained in F&O ban: SAIL, Sammaan Capital
Stocks removed from F&O ban: Nil
Disclaimer: The views and investment tips expressed by experts on Moneycontrol are their own and not those of the website or its management. Moneycontrol advises users to check with certified experts before taking any investment decisions.Disclaimer: Moneycontrol is a part of the Network18 group. Network18 is controlled by Independent Media Trust, of which Reliance Industries is the sole beneficiary.Discover the latest Business News, Sensex, and Nifty updates. Obtain Personal Finance insights, tax queries, and expert opinions on Moneycontrol or download the Moneycontrol App to stay updated!
Find the best of Al News in one place, specially curated for you every weekend.
Stay on top of the latest tech trends and biggest startup news.


