


The market remained range-bound at 25,600–25,900 (i.e., within the 100-day EMA and 50-day EMA) for the fourth straight session, with the Nifty 50 closing one-third of a percent lower on January 14. Technical and momentum indicators, along with an elevated VIX, continued to signal caution for bulls as the market awaits further corporate earnings. The index is expected to get a firm direction only after it convincingly breaks the above-mentioned range on either side. Below 25,600, the 25,450 level will be crucial to watch; however, on the higher side, above 25,900, a move towards 26,000–26,100 cannot be ruled out, according to experts.
Here are 15 data points we have collated to help you spot profitable trades:
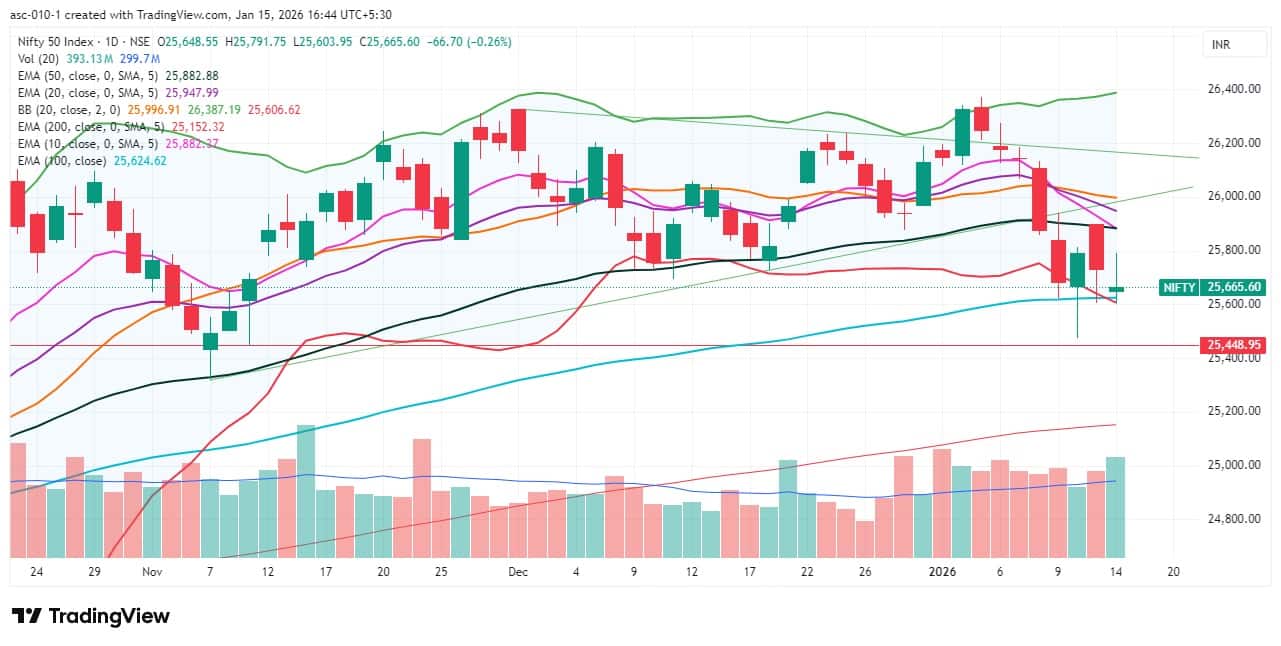
1) Key Levels For The Nifty 50 (25,666)
Resistance based on pivot points: 25,759, 25,803, and 25,875
Support based on pivot points: 25,615, 25,571, and 25,499
Special Formation: The Nifty 50 formed a small-bodied green candle with a long upper shadow on the daily charts, accompanied by above-average volumes, indicating selling pressure at higher levels amid range-bound trading. Additionally, there was a tweezer bottom–like pattern formation (not a classical one), which is a bullish reversal pattern but requires confirmation in the following session. The index continued to trade below short- and medium-term moving averages, with the 10-day EMA remaining below the 20-day EMA, and it is on the verge of breaking down below the 50-day EMA. The RSI dropped to 39.26, while the MACD remained below the signal line, with further weakness visible in the histogram. All these indicators suggest continued weakness and caution for bulls.
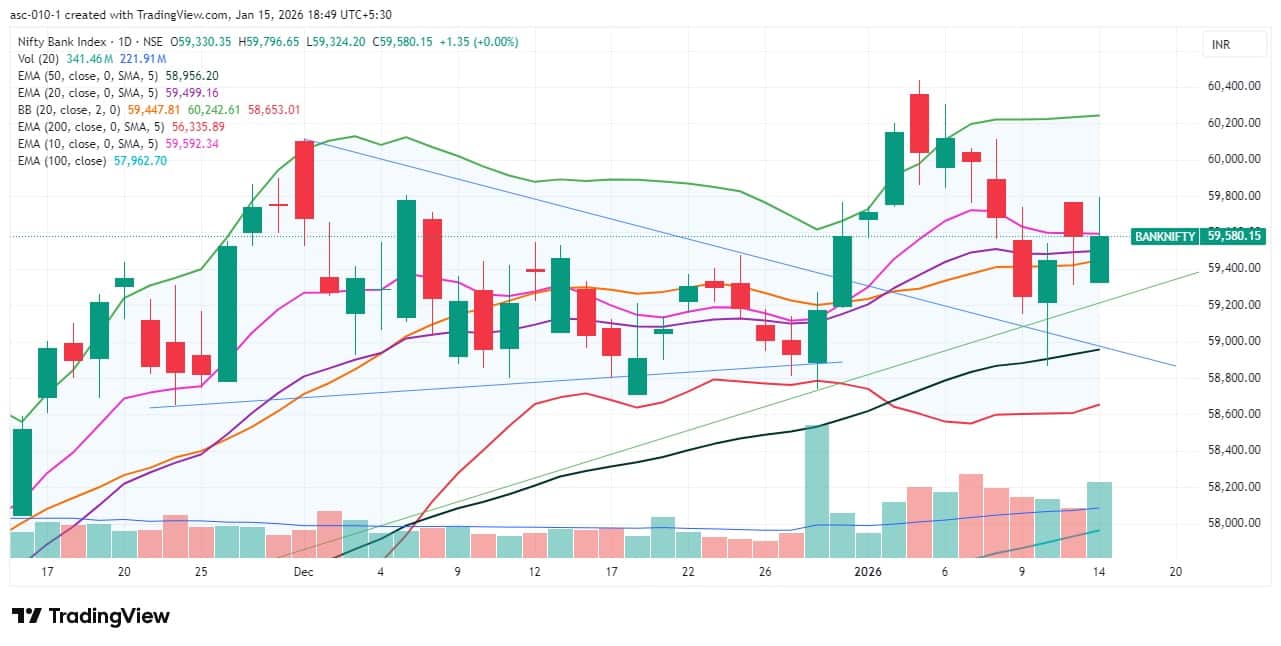
2) Key Levels For The Bank Nifty (59,580)
Resistance based on pivot points: 59,747, 59,859, and 60,039
Support based on pivot points: 59,387, 59,275, and 59,095
Resistance based on Fibonacci retracement: 59,839, 60,103
Support based on Fibonacci retracement: 59,080, 58,712
Special Formation: The Bank Nifty closed flat and formed a bullish candle with an upper shadow on the daily charts, accompanied by above-average volumes, while sustaining above the 20-day EMA, the midline of the Bollinger Bands, and key support trendlines, indicating a positive bias despite pressure at higher levels. The index continued its higher high–higher low formation for another session. The RSI inched up slightly to 53.55, though it remained below the reference line. The MACD continued below the signal line with further weakness in the histogram; however, the Stochastic RSI turned bullish. All these indicators point towards a cautiously positive bias for the Bank Nifty.
According to the weekly options data, the maximum Call open interest was seen at the 26,000 strike (with 1.27 crore contracts). This level can act as a key resistance level for the Nifty in the short term. It was followed by the 25,800 strike (86.57 lakh contracts) and 26,500 strike (79.19 lakh contracts).
Maximum Call writing was observed at the 26,000 strike, which saw an addition of 56.37 lakh contracts, followed by the 26,400 and 26,500 strikes, which added 36.04 lakh and 33.92 lakh contracts, respectively. There was hardly any Call unwinding seen in the 25,000-26,500 strike band.
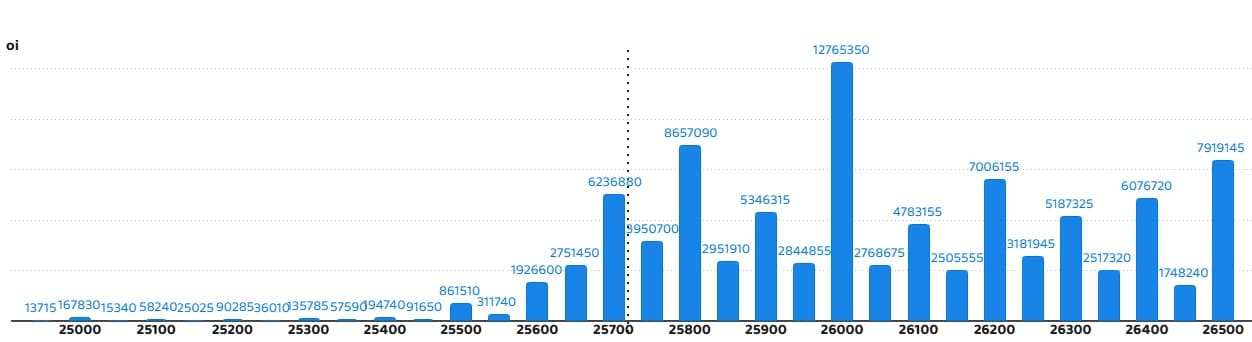
On the Put side, the 25,000 strike holds the maximum Put open interest (with 77.05 lakh contracts), which can act as a key support level for the Nifty in the short term. It was followed by the 25,500 strike (47.86 lakh contracts) and the 25,600 strike (45.69 lakh contracts).
The maximum Put writing was placed at the 25,000 strike, which saw an addition of 37.34 lakh contracts, followed by the 25,600 and 25,300 strikes, which added 17.1 lakh and 16.27 lakh contracts, respectively. The maximum Put unwinding was seen at the 25,950 strike, which shed 66,560 contracts, followed by the 26,200 and 26,000 strikes, which shed 64,480 and 36,075 contracts, respectively.
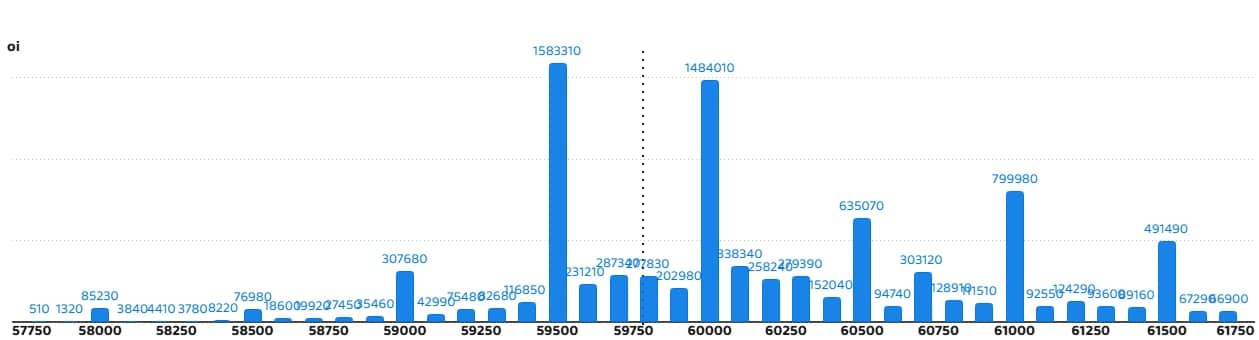
5) Bank Nifty Call Options Data
According to the monthly options data, the maximum Call open interest was seen at the 59,500 strike, with 15.83 lakh contracts. This can act as a key level for the index in the short term. It was followed by the 60,000 strike (14.84 lakh contracts) and the 61,000 strike (7.99 lakh contracts).
Maximum Call writing was observed at the 60,700 strike (with the addition of 1.6 lakh contracts), followed by the 60,100 strike (1.21 lakh contracts) and 61,000 strike (16,410 contracts). The maximum Call unwinding was seen at the 60,000 strike, which shed 1.06 lakh contracts, followed by the 59,500 and 59,000 strikes which shed 33,870 and 26,280 contracts, respectively.
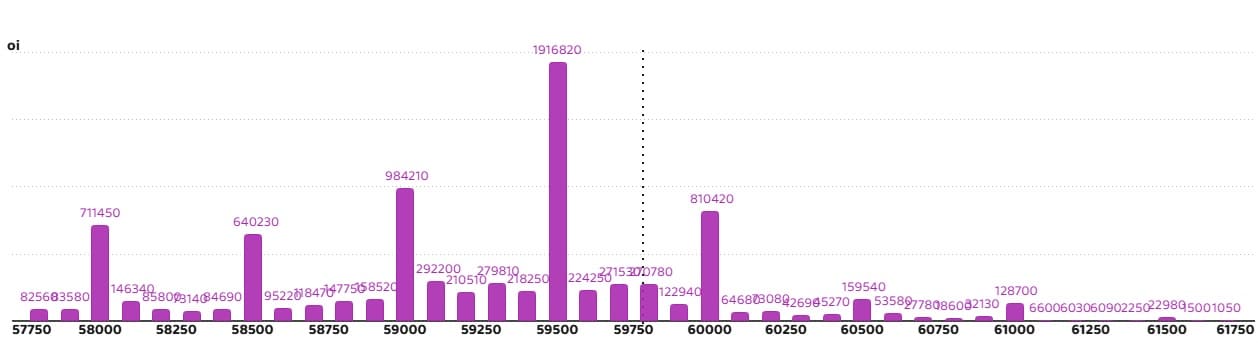
6) Bank Nifty Put Options Data
On the Put side, the 59,500 strike holds the maximum Put open interest (with 19.16 lakh contracts), which can act as a key support level for the index. This was followed by the 59,000 strike (9.84 lakh contracts) and the 60,000 strike (8.1 lakh contracts).
The maximum Put writing was placed at the 59,100 strike (which added 1.27 lakh contracts), followed by the 59,800 strike (87,270 contracts) and the 59,700 strike (56,550 contracts). The maximum Put unwinding was seen at the 58,000 strike, which shed 56,820 contracts, followed by the 59,200 and 59,000 strikes, which shed 28,080 and 23,670 contracts, respectively.
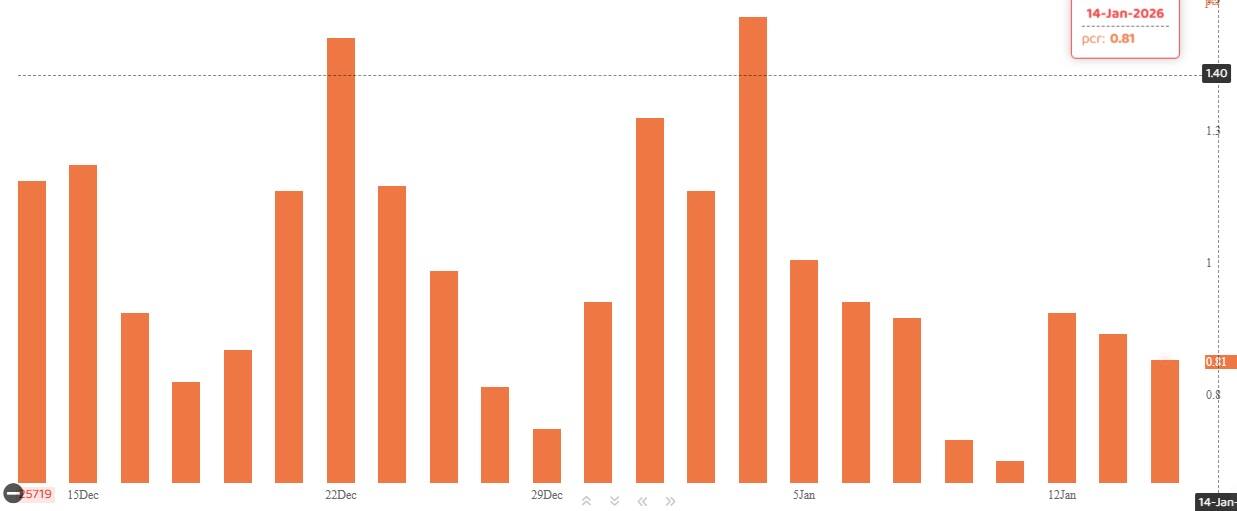
The Nifty Put-Call ratio (PCR), which indicates the mood of the market, fell to 0.81 on January 14, compared to 0.86 in the previous session.
The increasing PCR, or being higher than 0.7 or surpassing 1, means traders are selling more Put options than Call options, which generally indicates the firming up of a bullish sentiment in the market. If the ratio falls below 0.7 or moves towards 0.5, then it indicates selling in Calls is higher than selling in Puts, reflecting a bearish mood in the market.
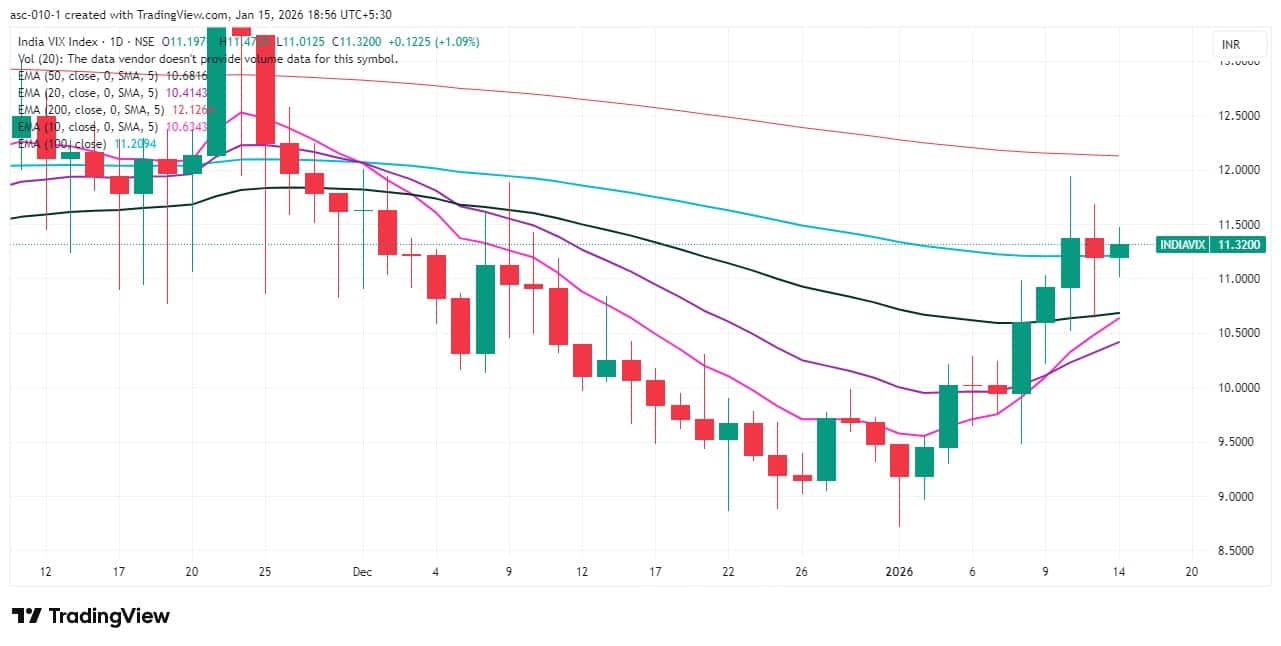
9) India VIX
The fear gauge, India VIX, remained at elevated levels, holding above its 20-, 50-, and 100-day EMAs, and climbed near the 11.50 zone intraday before ending at 11.32, up 1.09 percent. This indicates continued caution for bulls until the VIX decisively falls below the 10 zone.
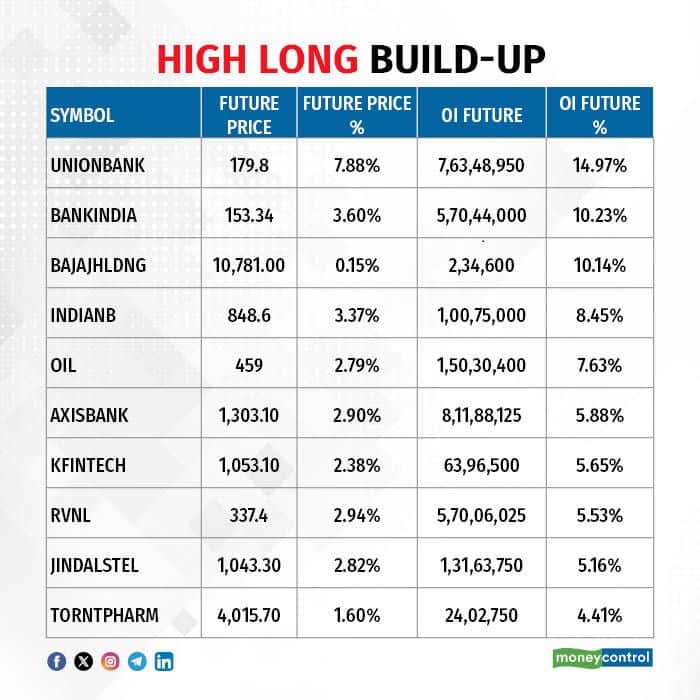
A long build-up was seen in 63 stocks. An increase in open interest (OI) and price indicates a build-up of long positions.
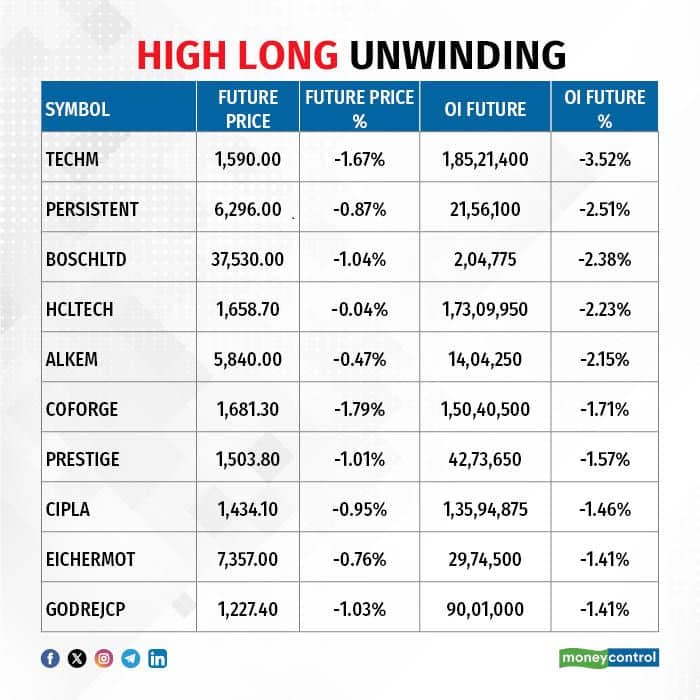
11) Long Unwinding (32 Stocks)
32 stocks saw a decline in open interest (OI) along with a fall in price, indicating long unwinding.
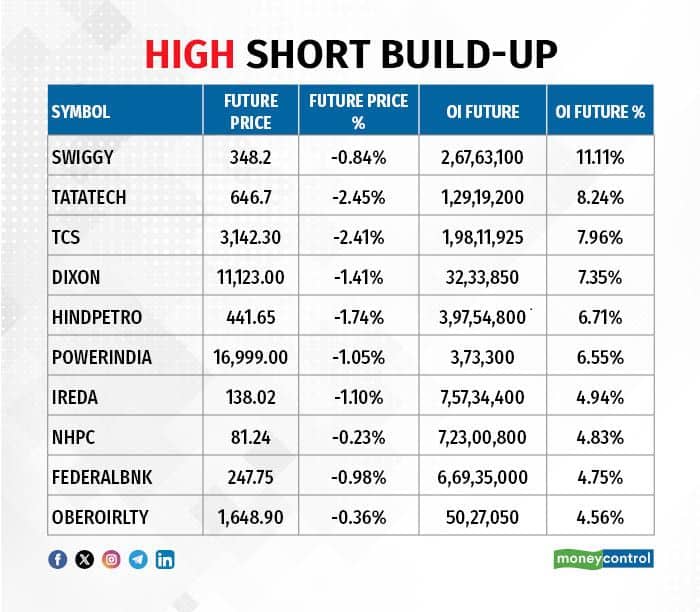
12) Short Build-up (71 Stocks)
71 stocks saw an increase in OI along with a fall in price, indicating a build-up of short positions.
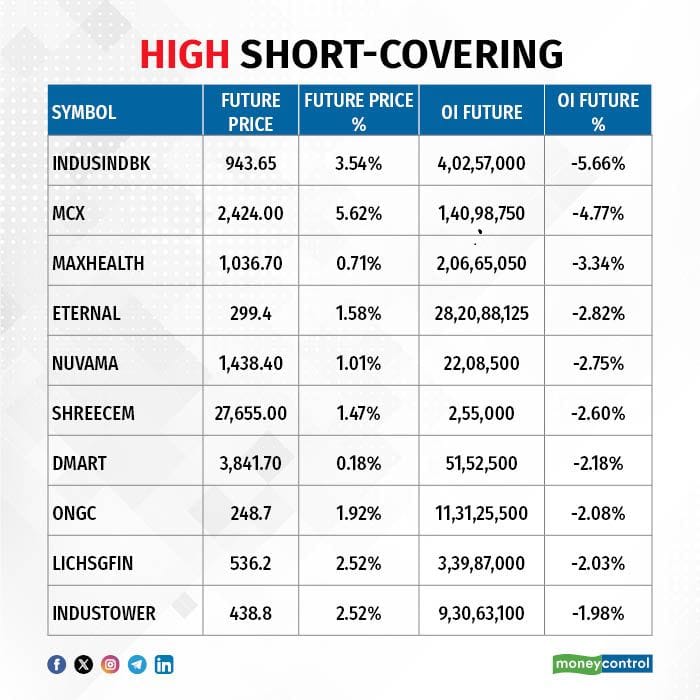
13) Short-Covering (45 Stocks)
45 stocks saw short-covering, meaning a decrease in OI, along with a price increase.
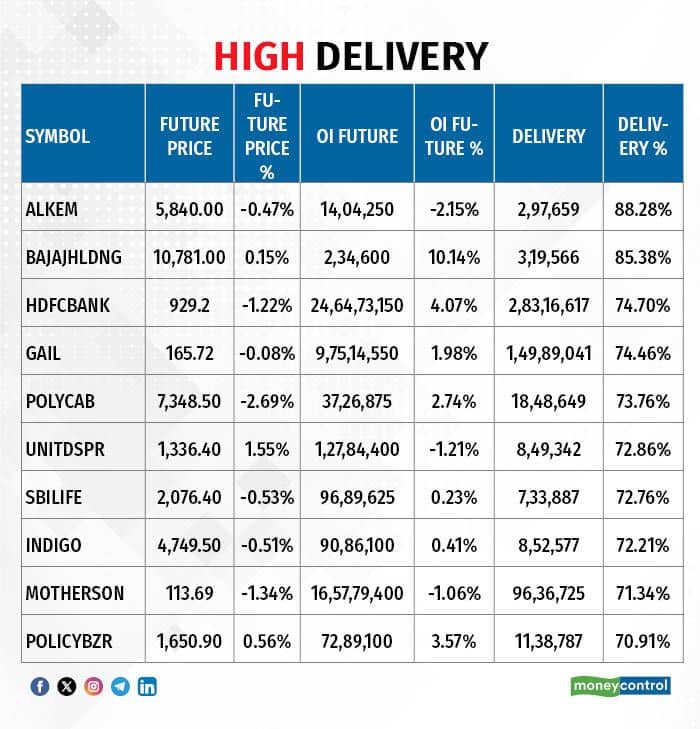
Here are the stocks that saw a high share of delivery trades. A high share of delivery reflects investing (as opposed to trading) interest in a stock.
Securities banned under the F&O segment include companies where derivative contracts cross 95 percent of the market-wide position limit.
Stocks added to F&O ban: Nil
Stocks retained in F&O ban: SAIL, Sammaan Capital
Stocks removed from F&O ban: Nil
Disclaimer: The views and investment tips expressed by experts on Moneycontrol are their own and not those of the website or its management. Moneycontrol advises users to check with certified experts before taking any investment decisions.Disclaimer: Moneycontrol is a part of the Network18 group. Network18 is controlled by Independent Media Trust, of which Reliance Industries is the sole beneficiary.Discover the latest Business News, Sensex, and Nifty updates. Obtain Personal Finance insights, tax queries, and expert opinions on Moneycontrol or download the Moneycontrol App to stay updated!
Find the best of Al News in one place, specially curated for you every weekend.
Stay on top of the latest tech trends and biggest startup news.


