


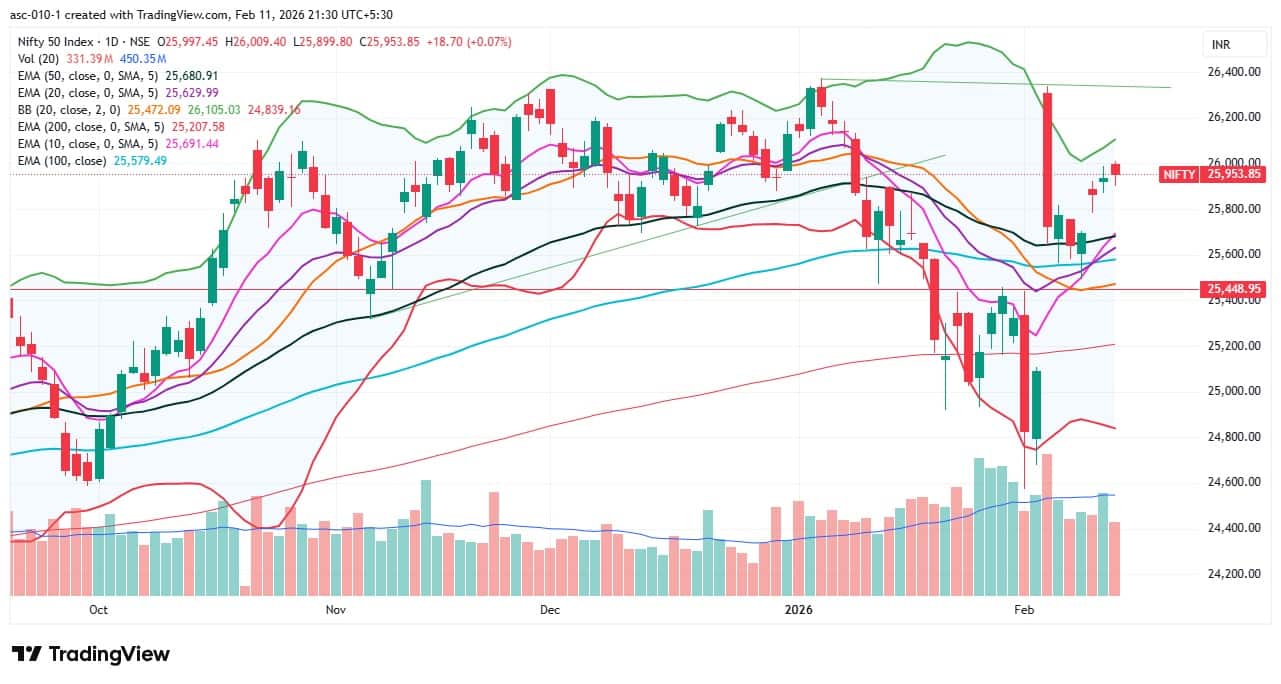
The Nifty 50 closed a range-bound session with moderate gains of 0.07 percent on February 11, extending its northward journey for the fourth consecutive day and continuing its higher top–higher bottom formation. This move was supported by healthy momentum indicators and upward-sloping moving averages. The benchmark index needs to convincingly scale above the 26,000 zone for a move toward its record high. However, as long as the index stays below this level on a closing basis, consolidation with range-bound trading may continue, with immediate crucial support placed at 25,780, according to experts.
Here are 15 data points we have collated to help you spot profitable trades:
1) Key Levels For The Nifty 50 (25,954)
Resistance based on pivot points: 25,996, 26,022, and 26,064
Support based on pivot points: 25,912, 25,887, and 25,845
Special Formation: The Nifty formed a small bearish candle with a lower shadow on the daily charts, indicating buying interest at lower levels, although there was some profit booking near the 26,000 zone. The Bollinger Bands continued to expand, while the moving averages maintained their northward trajectory, with the 10-day EMA crossing above all other key moving averages. The momentum indicators retained buy signals, with the RSI rising to 57.88. Meanwhile, the MACD climbed above the zero line with a positive crossover, and the histogram showed a further uptick. All these indicators suggest underlying strength despite the consolidation.
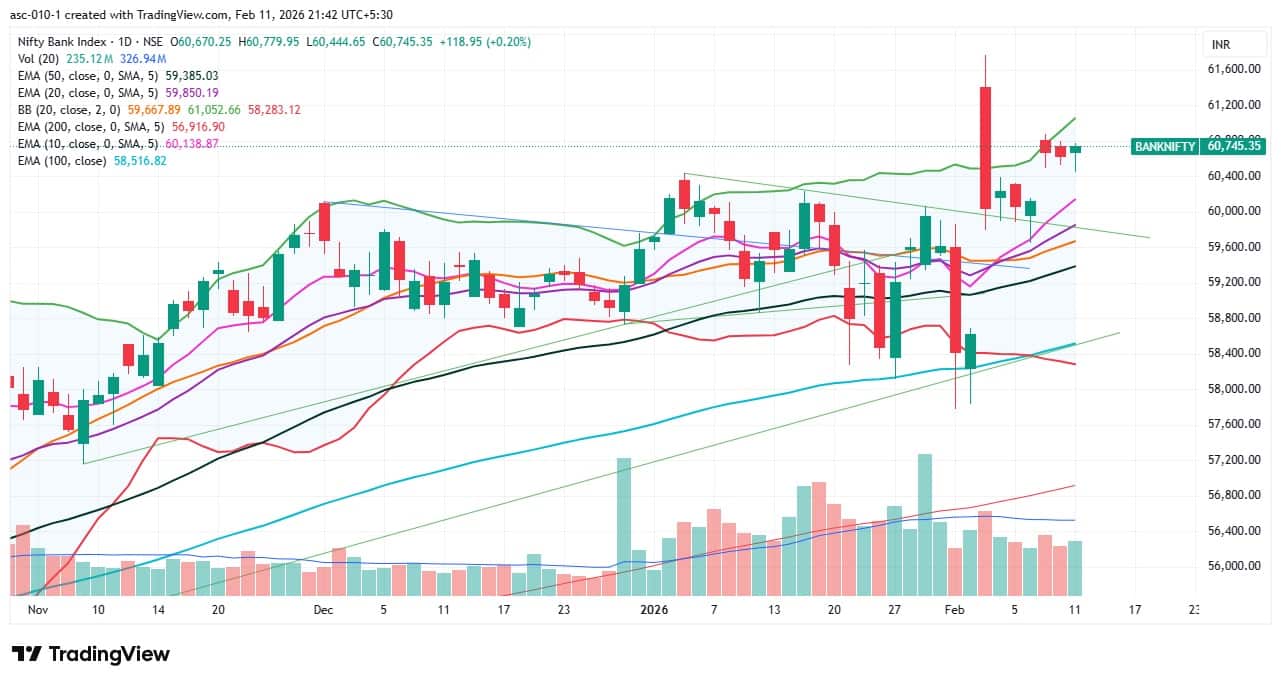
2) Key Levels For The Bank Nifty (60,745)
Resistance based on pivot points: 60,785, 60,864, and 60,992
Support based on pivot points: 60,529, 60,449, and 60,321
Resistance based on Fibonacci retracement: 61,160, 62,075
Support based on Fibonacci retracement: 60,000, 59,452
Special Formation: The Bank Nifty maintained narrow range-bound trading for another session, forming a small-bodied bullish candle with a lower shadow on the daily timeframe, indicating buying interest at lower levels. The index sustained above Monday's bullish gap for another session and traded near the upper Bollinger Bands. All the moving averages trended upward, while the momentum indicators sustained buy signals, with the RSI climbing to 60.68. All these factors indicate continued strength in the index despite consolidation.
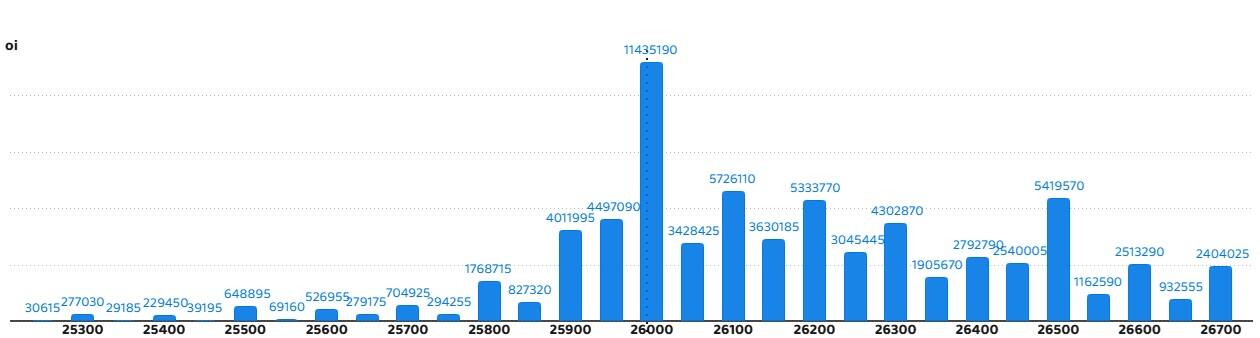
According to the weekly options data, the 26,000 strike holds the maximum Call open interest (with 1.14 crore contracts). This level can act as a key resistance level for the Nifty in the short term. It was followed by the 26,100 strike (57.26 lakh contracts) and 26,500 strike (54.19 lakh contracts).
Maximum Call writing was observed at the 26,000 strike, which saw an addition of 55.53 lakh contracts, followed by the 26,150 and 25,950 strikes, which added 26.85 lakh and 26.36 lakh contracts, respectively. The maximum Call unwinding was seen at the 25,500 strike which shed 1.37 lakh contracts, followed by the 25,650 and 25,300 strikes, which shed 13,260 and 4,160 contracts, respectively.
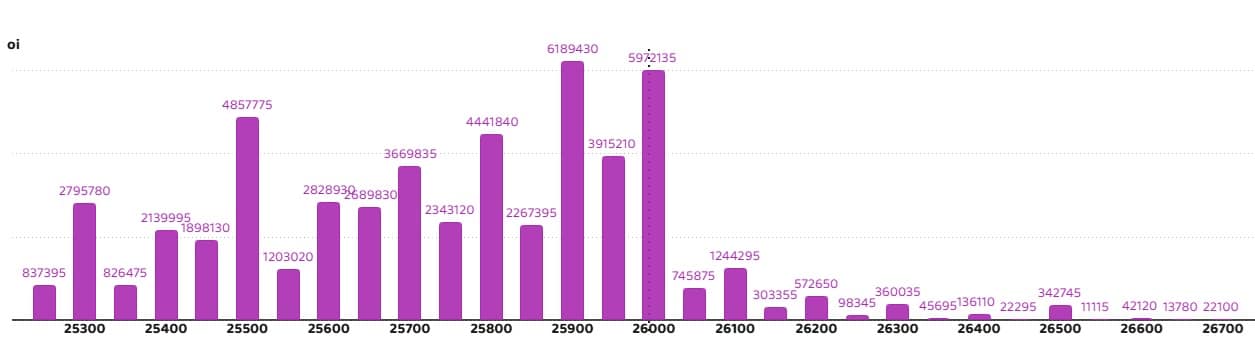
On the Put side, the maximum Put open interest was seen at the 25,900 strike (with 61.89 lakh contracts), which can act as a key support level for the Nifty in the short term. It was followed by the 26,000 strike (59.72 lakh contracts) and the 25,500 strike (48.57 lakh contracts).
The maximum Put writing was placed at the 25,900 strike, which saw an addition of 27.56 lakh contracts, followed by the 26,000 and 25,950 strikes, which added 26.93 lakh and 18.97 lakh contracts, respectively. There was hardly any Put unwinding seen in the 25,250-26,700 strike band.
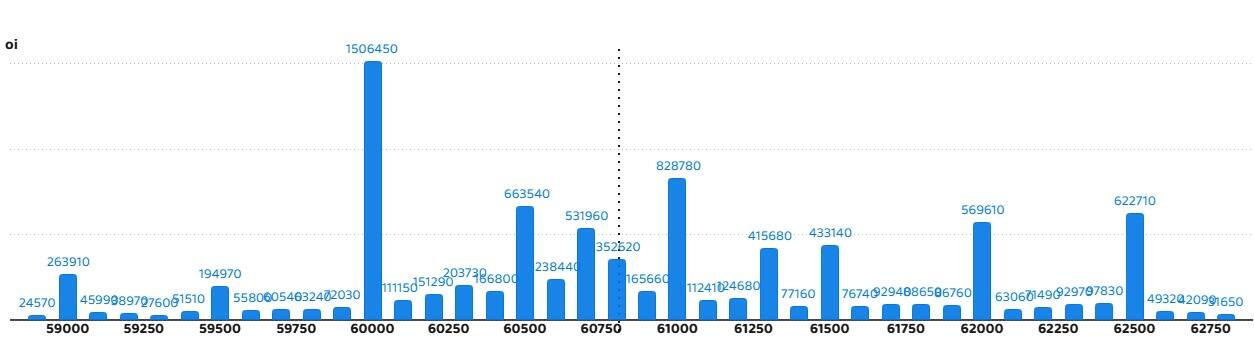
5) Bank Nifty Call Options Data
According to the monthly options data, the 60,000 strike holds the maximum Call open interest, with 15.06 lakh contracts. This can act as a key level for the index in the short term. It was followed by the 61,000 strike (8.28 lakh contracts) and the 60,500 strike (6.63 lakh contracts).
Maximum Call writing was observed at the 60,800 strike (with the addition of 57,420 contracts), followed by the 62,500 strike (51,480 contracts) and 60,700 strike (31,560 contracts). The maximum Call unwinding was seen at the 60,500 strike, which shed 31,410 contracts, followed by the 62,600 and 61,700 strikes which shed 27,600 and 23,190 contracts, respectively.
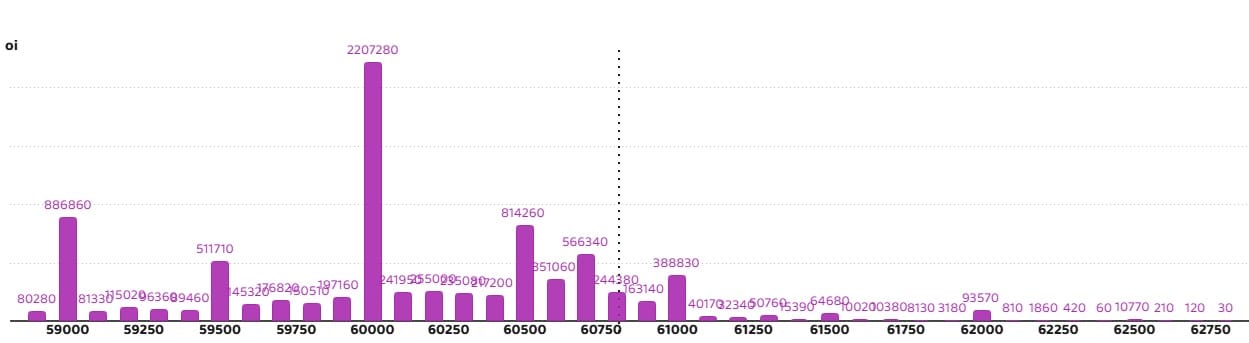
6) Bank Nifty Put Options Data
On the Put side, the maximum Put open interest was seen at the 60,000 strike (with 22.07 lakh contracts), which can act as a key support level for the index. This was followed by the 59,000 strike (8.86 lakh contracts) and the 60,500 strike (8.14 lakh contracts).
The maximum Put writing was placed at the 60,000 strike (which added 1.86 lakh contracts), followed by the 60,500 strike (1.8 lakh contracts) and the 60,700 strike (1.6 lakh contracts). The maximum Put unwinding was seen at the 59,800 strike which shed 26,310 contracts, followed by the 59,500 and 61,500 strikes, which shed 12,540 and 8,700 contracts, respectively.
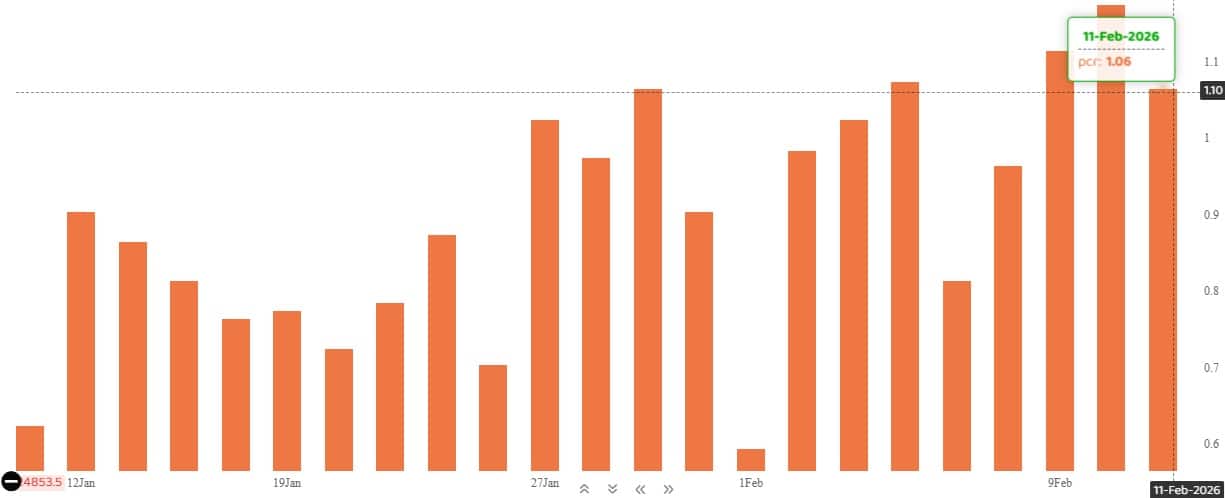
The Nifty Put-Call ratio (PCR), which indicates the mood of the market, fell to 1.06 on February 11, compared to 1.17 in the previous session.
The increasing PCR, or being higher than 0.7 or surpassing 1, means traders are selling more Put options than Call options, which generally indicates the firming up of a bullish sentiment in the market. If the ratio falls below 0.7 or moves towards 0.5, then it indicates selling in Calls is higher than selling in Puts, reflecting a bearish mood in the market.
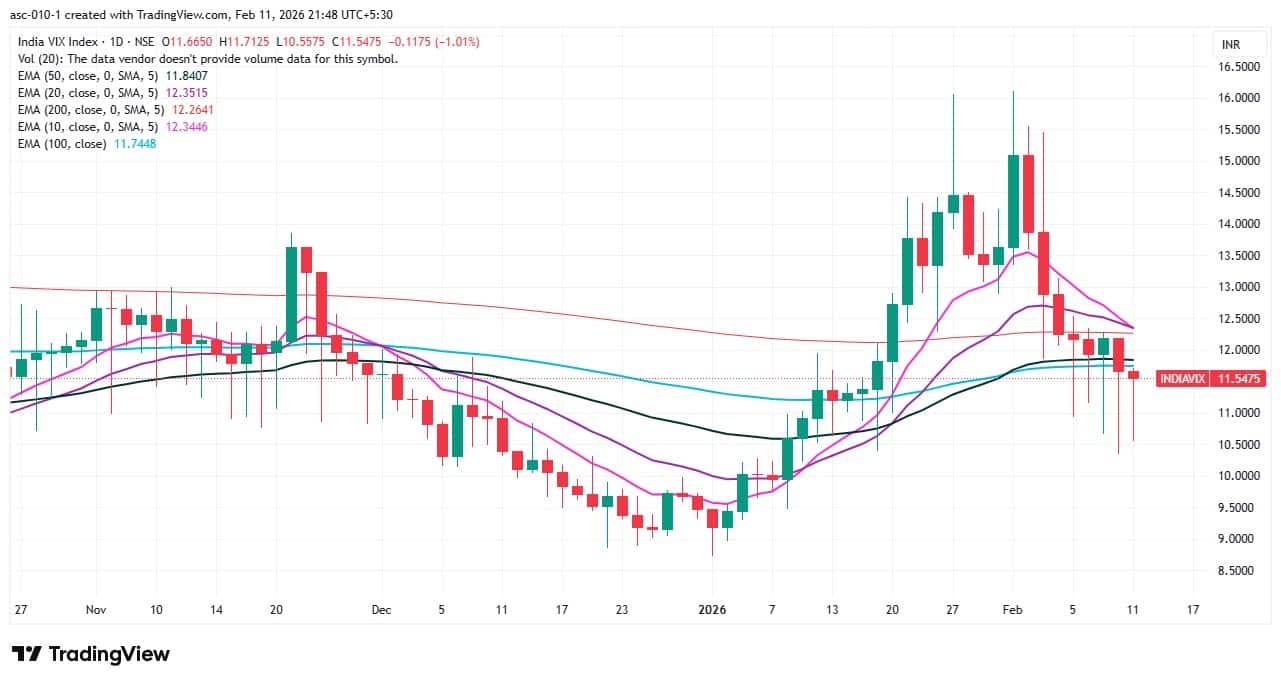
9) India VIX
India VIX, also known as the fear gauge, remained in the comfort zone for bulls and signalled low market uncertainty, as it declined 1.01 percent to 11.55 and sustained below all key moving averages.
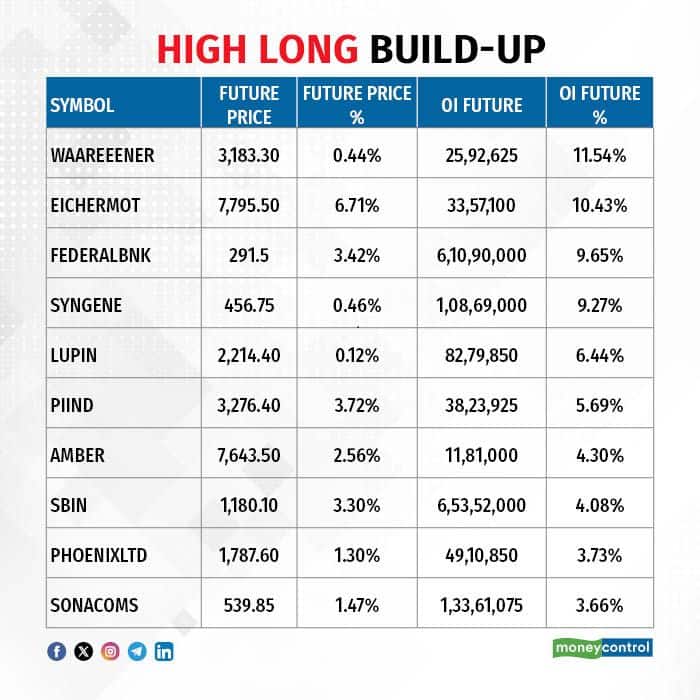
A long build-up was seen in 54 stocks. An increase in open interest (OI) and price indicates a build-up of long positions.
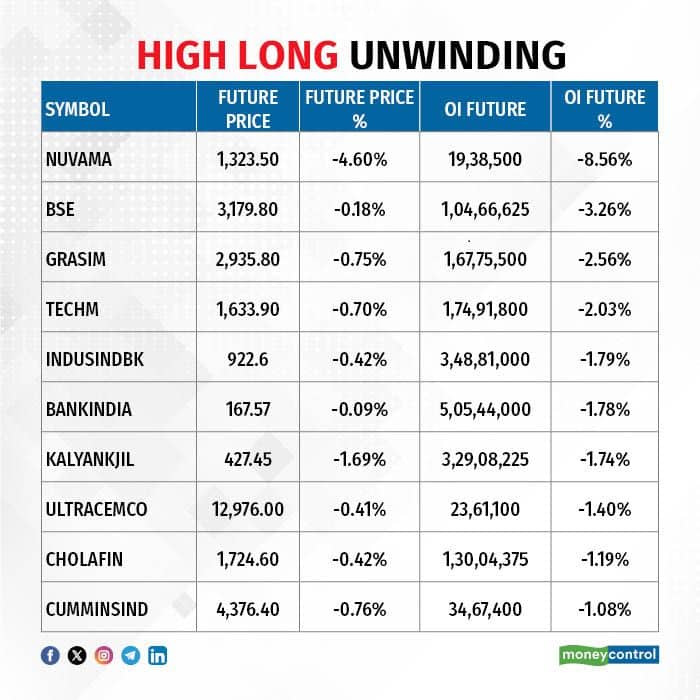
11) Long Unwinding (27 Stocks)
27 stocks saw a decline in open interest (OI) along with a fall in price, indicating long unwinding.
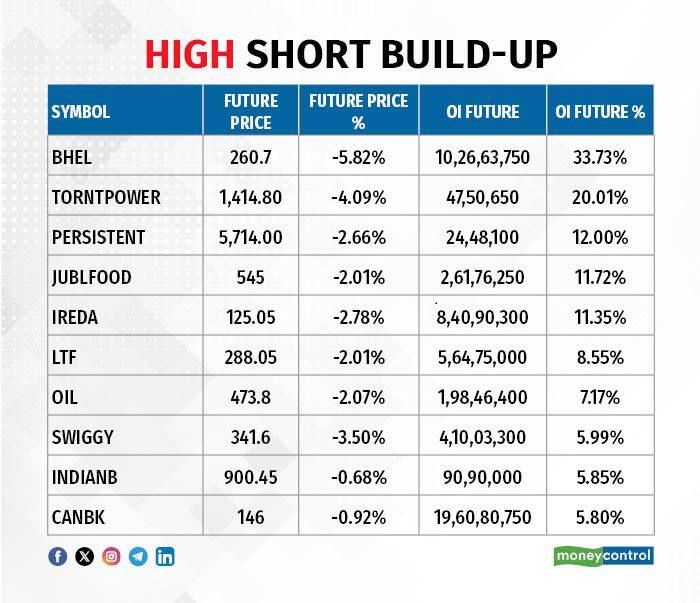
12) Short Build-up (61 Stocks)
61 stocks saw an increase in OI along with a fall in price, indicating a build-up of short positions.
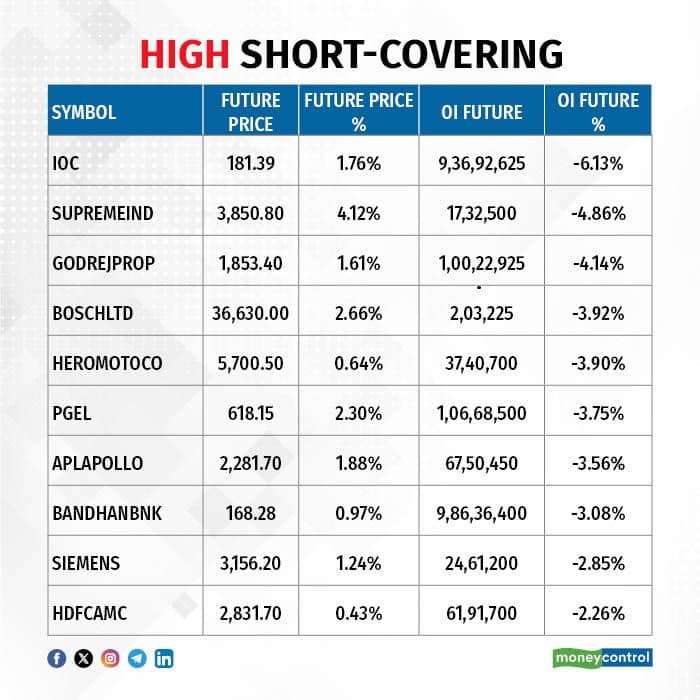
13) Short-Covering (66 Stocks)
66 stocks saw short-covering, meaning a decrease in OI, along with a price increase.
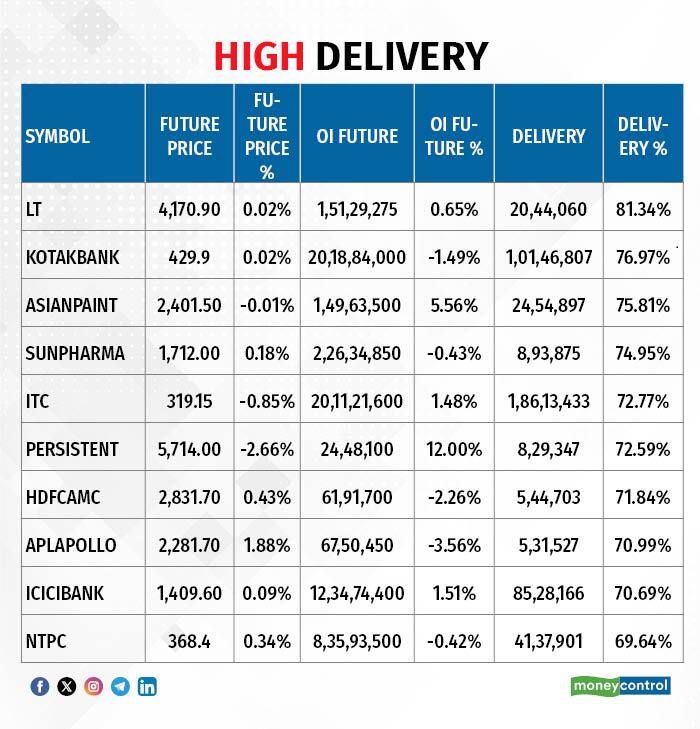
Here are the stocks that saw a high share of delivery trades. A high share of delivery reflects investing (as opposed to trading) interest in a stock.
Securities banned under the F&O segment include companies where derivative contracts cross 95 percent of the market-wide position limit.
Stocks added to F&O ban: Nil
Stocks retained in F&O ban: SAIL, Sammaan Capital
Stocks removed from F&O ban: Nil
Disclaimer: The views and investment tips expressed by experts on Moneycontrol are their own and not those of the website or its management. Moneycontrol advises users to check with certified experts before taking any investment decisions.Disclaimer: Moneycontrol is a part of the Network18 group. Network18 is controlled by Independent Media Trust, of which Reliance Industries is the sole beneficiary.Discover the latest Business News, Sensex, and Nifty updates. Obtain Personal Finance insights, tax queries, and expert opinions on Moneycontrol or download the Moneycontrol App to stay updated!
Find the best of Al News in one place, specially curated for you every weekend.
Stay on top of the latest tech trends and biggest startup news.


