


Bears mauled the markets down to a four-month low in the week ended October 27, though a rebound on the closing day helped it revive from an oversold condition and took the Nifty 50 back above 19,000 points.
Experts called the Friday's rebound as Dead Cat Bounce. After shedding 1,000 points from the October top, bulls will now have the real challenge to retrieve those gains in an environment of unsupportive global factors.
Hence, any bounce back from here on, at least for few weeks, looks unsustainable in the face of selling pressure on every rise. Crucial support for the Nifty50 is expected to remain at 18,800, the low of the last week, as beyond this point, it may slide down to 18,600-18,500. On the higher side, the immediate hurdle will be at 19,200-19,300, followed by 19,500, experts said.
The Nifty50 fell 2.5 percent in the last week to settle at 19,047, and formed a long, bearish candlestick pattern with sizeable lower shadow on the weekly charts, making lower-high, lower-low formation, especially after a bearish tweezer top kind of pattern formation in the previous week.
"The range of 19,200 to 19,250 is a formidable resistance zone, that is a breakdown level from a major swing low," Sameet Chavan, vice-president for technical and derivatives at Angel One, said.
In addition, the RSI Smoothened indicator has dipped into the oversold zone below 30 levels for the first time since March and, hence, in the near term, he feels dip towards last week’s low of around 19,850 - 19,800 may continue to act as a cushion, while a critical support zone is observed around 18,600, represented by the long-term 200SMA moving average.
Jatin Gedia, technical research analyst at Sharekhan by BNP Paribas also feels going ahead the Nifty can consolidate within 18,800 – 19,200 before resuming next leg of the fall.
Hence, when navigating these market conditions, it is crucial to focus on trading opportunities while keeping a close eye on key levels in both directions, Sameet advised.
Let's take a look at the top 10 trading ideas from experts for the next three-four weeks. Returns are based on the October 27 closing prices.
Expert: Vinay Rajani, CMT, senior technical & derivative analyst at HDFC SecuritiesGNFC: Buy | LTP: Rs 665 | Stop-Loss: Rs 629 | Target: Rs 710 | Return: 7 percent
Gujarat Narmada Valley Fertilizers & Chemicals' stock price has been forming higher tops and higher bottoms on the daily chart. Primary trend of the stock is bullish as it is placed above all important moving averages.
Indicators and oscillators have been showing bullish trend for the stock. In the October series, the stock has seen long build up in the derivative segment, which confirms the uptrend.

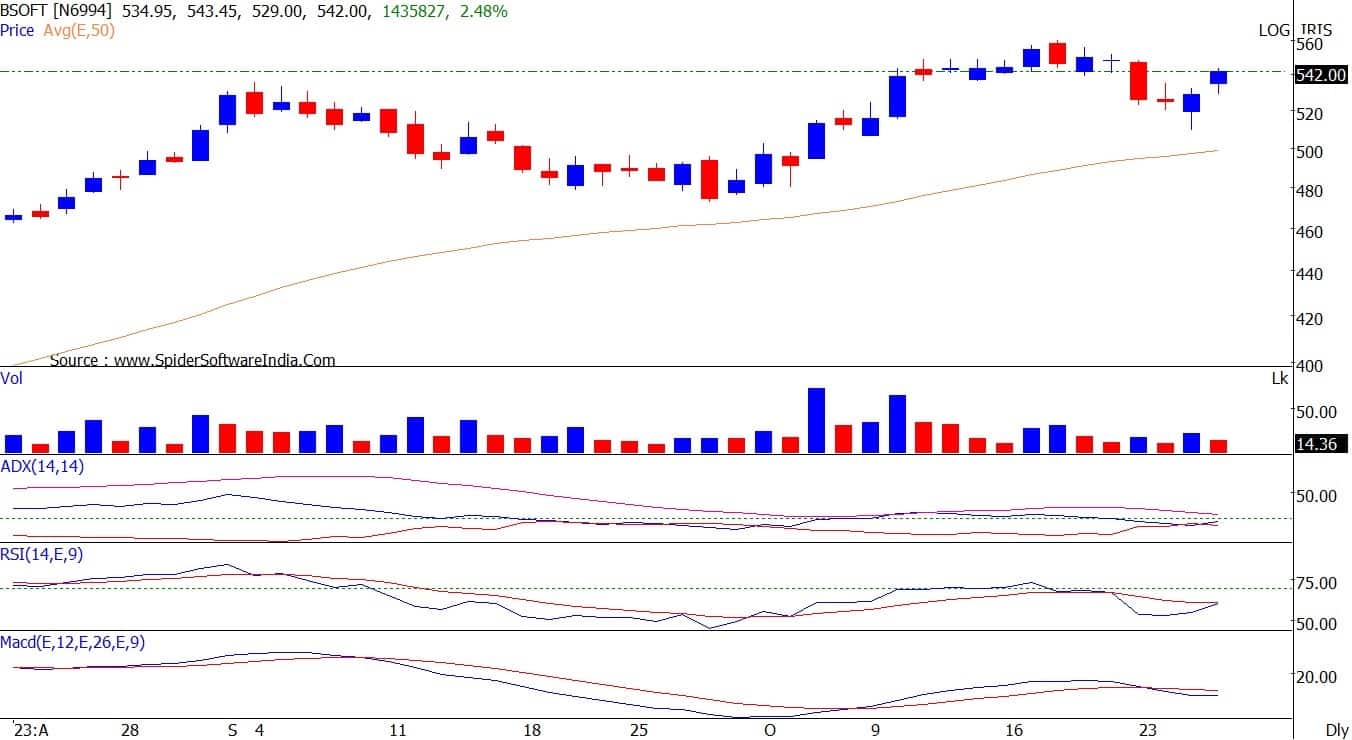
Birlasoft: Buy | LTP: Rs 542 | Stop-Loss: Rs 509 | Target: Rs 590 | Return: 9 percent
The stock price has broken out from the Bullish Flag pattern on the daily chart. Primary trend of the stock is bullish as it has been forming higher tops and higher bottoms on the weekly charts.
Indicators and oscillators have also been showing strength on daily and weekly time frame.
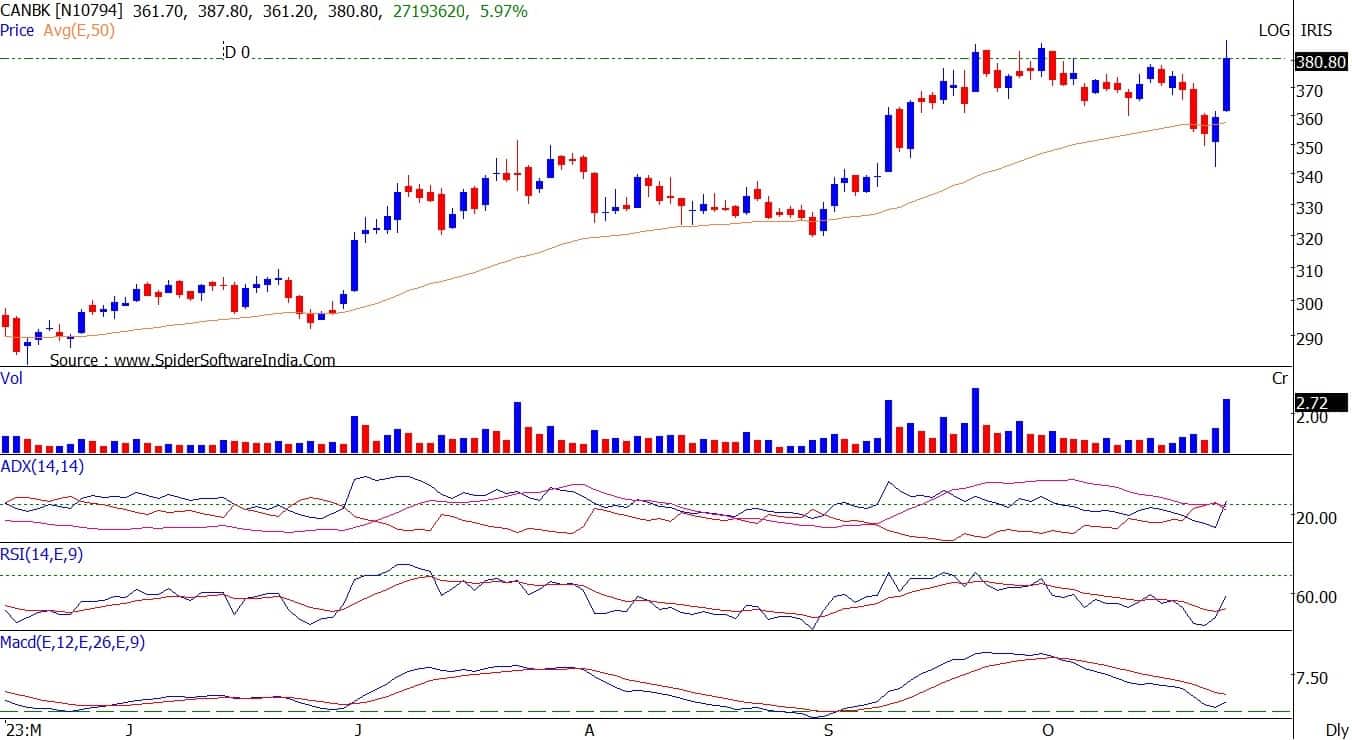
Canara Bank: Buy | LTP: Rs 380 | Stop-Loss: Rs 361 | Target: Rs 405 | Return: 7 percent
The stock price has registered fresh 52-week high of Rs 387.80 with jump in volumes. The stock has remained resilient in the recent market weakness.
The stock price has broken out from Flag pattern on the weekly chart, which indicates continuation of a primary uptrend.
Tata Motors: Buy | LTP: Rs 641 | Stop-Loss: Rs 615 | Target: Rs 700 | Return: 9 percent
The stock experienced a significant upswing from April this year until August, advancing from Rs 400 to Rs 650 levels. Subsequently, the stock entered a consolidation phase, trading within a relatively tight range of Rs 645 to Rs 605.
Last week, a noteworthy development occurred as the stock broke above a previously established downward-sloping trendline. This breakout was characterized by price intensity and robust trading volumes.
Despite intermittent market corrections, the stock retraced to retest the breakout zone. Encouragingly, it demonstrated resilience and responded positively on Friday, indicating the presence of latent demand at lower price levels.

Persistent Systems: Buy | LTP: Rs 6,084 | Stop-Loss: Rs 5,840 | Target: Rs 6,650 | Return: 9.3 percent
The stock has been trading within a well-defined channel since it commenced its upward momentum in October 2022. During this period, the stock has consistently exhibited more substantial upward rallies compared to weaker down moves.
Corrections in the price have been brief and followed by rapid retracements, illustrating a mature and robust pattern of higher highs and higher lows. In the most recent session, the stock broke out above the established channel, driven by strong trading volume, and closed above its previous all-time highs.

L&T Finance Holdings: Buy | LTP: Rs 137 | Stop-Loss: Rs 132 | Target: Rs 150 | Return: 9.5 percent
The stock has demonstrated a robust and consistent upward trajectory since its lows in April 2023, with gains from rs 80 to approximately Rs 137. Starting from July this year, the stock has been in a consolidation phase in terms of both time and price.
Recent price action in which higher highs and higher lows were established, along with notable trading volume in the past few sessions, suggests that there is strong demand at lower price levels.
Currently, the stock is forming an Ascending Triangle pattern, and a breakout above the Rs 138 levels is expected to have significant bullish implications.

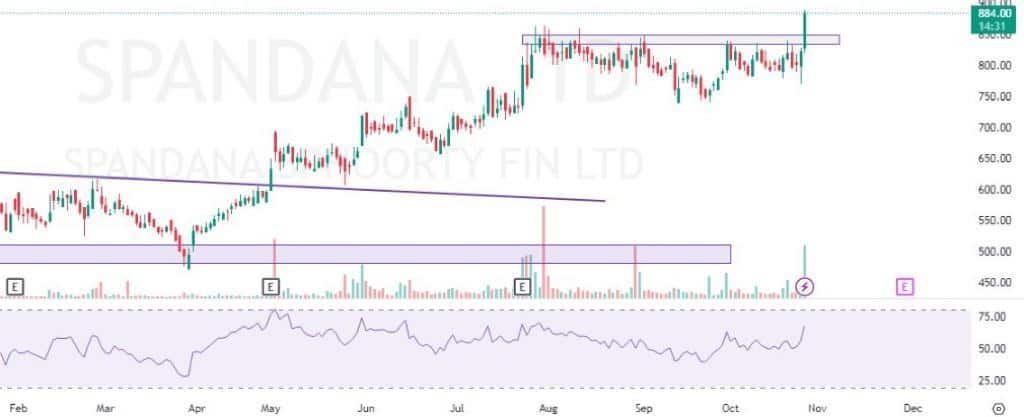
Spandana Sphoorty Financial: Buy | LTP: Rs 882 | Stop-Loss: Rs 840 | Target: Rs 950 | Return: 8 percent
Spandana Sphoorty has seen breaking out of a resistance zone on the daily timeframe after almost three months with a bullish candlestick and above average volumes. In addition, the stock is trading and sustaining above all its important EMAs (exponential moving average) which can be used as a confluence towards the bullish view.
On the indicator front, the Ichimoku Cloud is also suggesting a bullish move as the price is trading above the conversion line, base line and cloud. Momentum oscillator RSI (14) is at around 66 on the daily time frame indicating strength by sustaining above 50.
Observation of the above factors indicates that a bullish move in Spandana Sphoorty is possible for target upto Rs 950. One can initiate a buy trade in between the range of Rs 878-881, with a stop-loss of Rs 840 on daily closing basis.
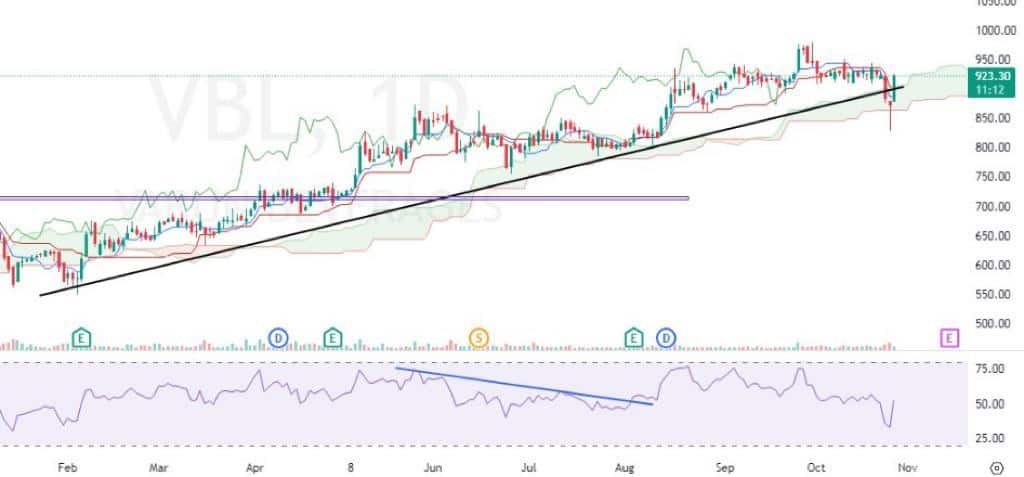
Varun Beverages: Buy | LTP: Rs 921 | Stop-Loss: Rs 885 | Target: Rs 987 | Return: 7 percent
VBL has seen taking support from an upwards sloping trendline support on the daily timeframe with above average volumes and a bullish candlestick on the daily timeframe. In addition, the stock is trading above important EMAs of 20/50/100/200 on the daily timeframe which indicates strength.
On the indicator front, momentum oscillator RSI (14) is at around 51 on the daily time frame indicating strength by sustaining above 50 and the Ichimoku Cloud is also suggesting a bullish move.
Observation of the above factors indicates that a bullish move in VBL is possible for target upto Rs 987. One can initiate a buy trade in the range of Rs 914-918 with a stop-loss of Rs 885 on daily closing basis.
Mangalam Cement: Buy | LTP: Rs 396 | Stop-Loss: Rs 378 | Target: Rs 436 | Return: 10 percent
Mangalam Cement has seen breaking out of a Cup and Handle pattern formation on the daily timeframe with a bullish candlestick and above average volume after one year which indicates strength as the stock is also trading above all its important EMAs on the daily timeframe which acts as a confluence.
The supertrend indicator is also indicating a bullish continuation which supports the bullish view. Momentum oscillator RSI (14) is at around 64 on the daily time frame indicating strength by sustaining above 50. And the Ichimoku Cloud is also suggesting a bullish move as the price is trading above the conversion line, base line and cloud.
Observation of the above factors indicates that a bullish move in Mangalam Cement is possible for target upto Rs 436. One can initiate a buy trade in between the range of Rs 394-396, with a stop-loss of Rs 378 on daily closing basis.

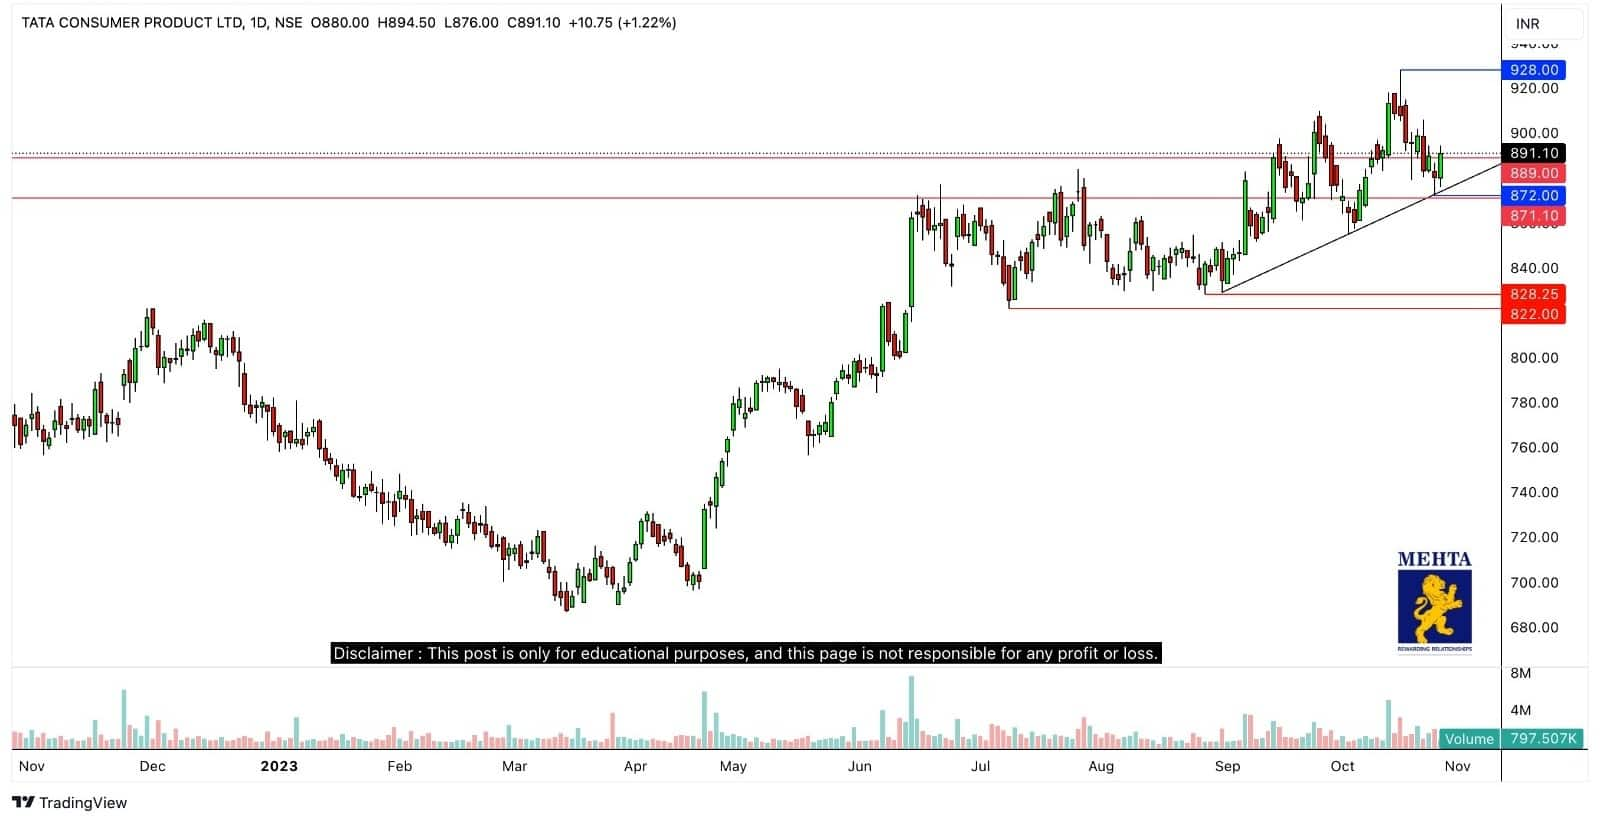
Tata Consumer Products: Buy | LTP: Rs 891 | Stop-Loss: Rs 850 | Target: Rs 930-950 | Return: 7 percent
The stock has reached a significant support level at Rs 872 and has witnessed substantial buying activity at these levels. Given that the stock is currently trading near its September 2021 highs and consistently attracting buyers during price dips, there is a strong possibility that the stock may move higher towards levels around Rs 930 and Rs 950.
Buy at the current levels and set a stop-loss below Rs 850 for a target of Rs 930 and Rs 950 in the near term.
Discover the latest Business News, Sensex, and Nifty updates. Obtain Personal Finance insights, tax queries, and expert opinions on Moneycontrol or download the Moneycontrol App to stay updated!
Find the best of Al News in one place, specially curated for you every weekend.
Stay on top of the latest tech trends and biggest startup news.


