


Chandan Taparia Motilal Oswal Securities
Today, we will be discussing reversal patterns. The appearance of the 2-bar reversal price action set-up primarily indicates a fight between the bulls and bears, or buyers and sellers. It is often signified by a large bearish and bullish bars and when they occur next to each other the 2-bar reversal pattern often signifies a rejection of lower or higher prices by the markets, where the preceding price action candle shows market sentiment. There are two types of 2-bar reversal patterns: Bullish 2-Bar Reversal and Bearish 2 Bar.
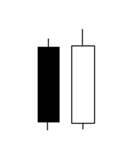
a) Bullish 2-Bar Reversal pattern For a Bullish 2-Bar Reversal, the first bar must go down and the second candlestick must then open lower and take the price higher. When a bullish bar appear in the 2-bar reversal method, the sentiment is in the direction of the bullish candlestick pattern and thus indicative of a bullish market sentiment. Such patterns are really useful to trade within the trend, especially at retracements.
For example, the appearance of a 2–bar reversal pattern, a bearish candlestick followed by a bullish candlestick,can be seen as a signal of the end of the retracement, especially when this price action pattern occurs at a previously identified support zone.
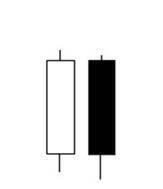
b) Bearish 2 –Bar Reversal pattern For a Bearish 2-Bar Reversal, the first bar must go up and the second candlestick must then open and snap back lower. Likewise, when the bearish bar appears in the second bar reversal method it indicates bearish market sentiment.
Bearish 2-Bar Reversal pattern is useful at retracements. For example, the appearance of a 2–bar reversal pattern, a bullish candlestick followed by a bearish candlestick can be seen as a signal of the end of the retracement, especially when this price action pattern occurs at a previously identified resistance zone.

Discover the latest Business News, Sensex, and Nifty updates. Obtain Personal Finance insights, tax queries, and expert opinions on Moneycontrol or download the Moneycontrol App to stay updated!
Find the best of Al News in one place, specially curated for you every weekend.
Stay on top of the latest tech trends and biggest startup news.


