Moneycontrol Contributor
July 07, 2020 / 10:55 IST
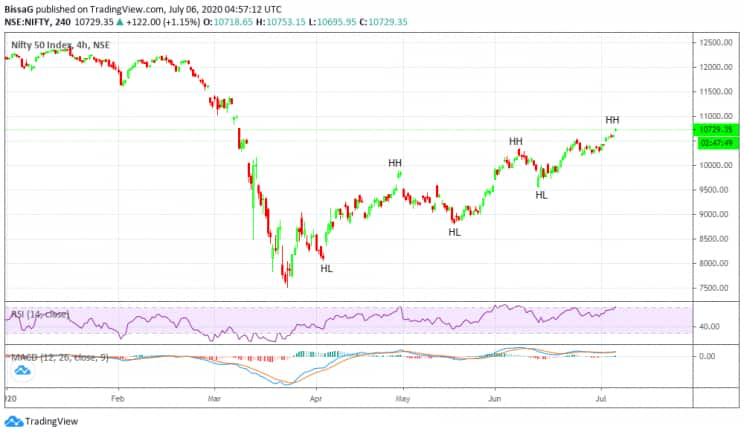
Gaurav Bissa The Nifty50 has a strong hurdle between 10,750-10,800 levels and can dip toward levels of 10,400-10,200 in the coming days with view negation above 11,000 closings. The Nifty has seen a strong move since the last few weeks and is now at a crucial level of the rally. However, the overall trend remains positive for now. The chart below shows Nifty exhibiting clear Dow Theory which includes the formation of Higher High and Higher Low denoted by HH and HL respectively. This is a characteristic of an uptrend. However, there can be some whipsaws or retracements along the way which I have shown in other charts.
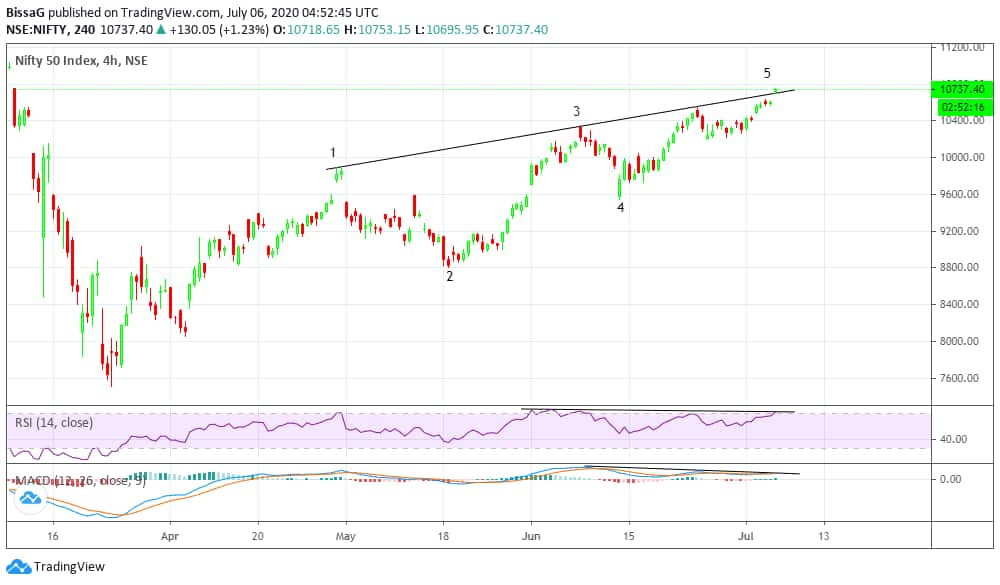
On a 4 hours chart, the Nifty has now formed a bearish ‘Wolfe Wave’ pattern. The Nifty can see some upside till 10800 but there is a strong hurdle at that level which can push the Nifty to lower levels. Also, the RSI, as well as MACD, have formed bearish divergences. MACD is a relatively heavy indicator compared to RSI which means it doesn’t move as fast as RSI. The fact that it is witnessing a fall while Nifty is rising raises some questions about the strength of trend on an immediate basis.
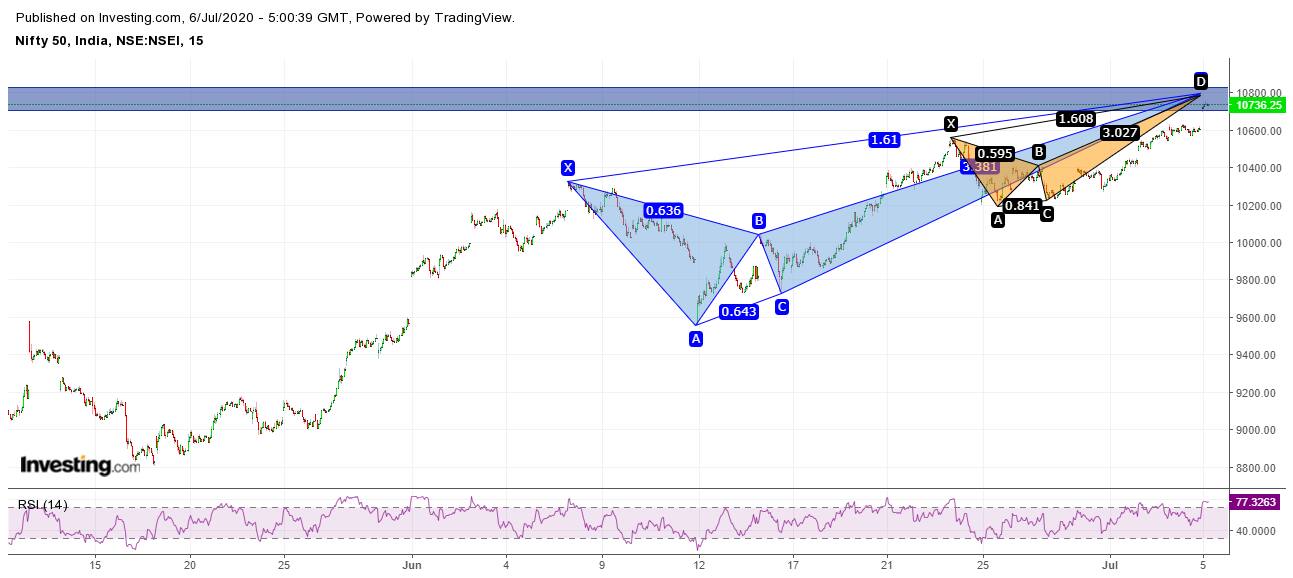
Along with Wolfe Wave pattern, Nifty is also forming two bearish harmonic crab patterns on hourly charts with prz (trigger point) near 10800 level which is also where immediate resistance is placed.
 (The author is AVP-Technicals and Derivatives at LKP Securities)Disclaimer: The views and investment tips expressed by investment experts on Moneycontrol.com are their own and not that of the website or its management. Moneycontrol.com advises users to check with certified experts before taking any investment decisions.
 Discover the latest Business News, Sensex, and Nifty updates. Obtain Personal Finance insights, tax queries, and expert opinions on Moneycontrol or download the Moneycontrol App to stay updated!