


ONGC Ltd shares have been outperforming recently, emerging as one of the most bullish stocks in the oil and gas sector. According to analysts, technical indicators suggest continued strength across all time frames, with the RSI and Bollinger Bands expanding in a northward direction on the daily charts.
"The stock price has shown a strong price-volume breakout on the daily charts and is now retesting those breakout zones amid the recent market correction," said Arun Kumar Mantri, Founder of Mantri Finmart.
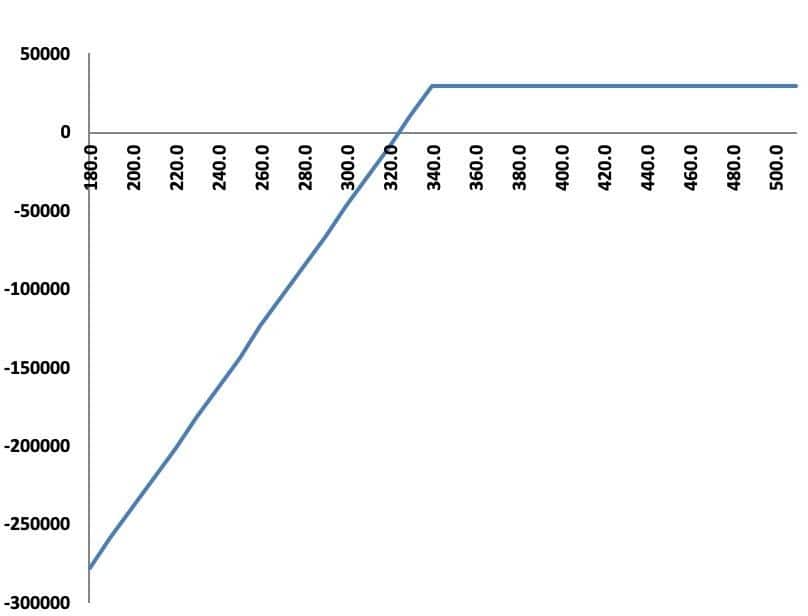
To capture the upside momentum, Mantri recommends a Covered Call strategy in ONGC:Trade: Buy one lot of ONGC August Futures at Rs 330 and sell one lot of ONGC August 340 Call Option at Rs 5.5.
Break-even point: Rs 324.5
Stop loss: Rs 320 (spot levels)
Mantri highlights that the stock is trading well above the major moving averages, with the Bollinger Bands (20,2) indicating further potential for a price increase. Support is placed at Rs 318-320 on the downside, while Rs 340 and Rs 345 are the near-term resistances for the stock in the coming week.
On the derivatives front, the 320 PE of the stock has an open interest of over 49.7 lakh shares, indicating a strong base formation around the Rs 320-325 levels. "Conversely, the 340 CE has open interest of around 1.21 crore shares, which could act as the next resistance in upcoming trades. The overall setup for the stock appears bullish, and a covered call strategy may be effective over the next 4-5 trading sessions," said Mantri.
Discover the latest Business News, Sensex, and Nifty updates. Obtain Personal Finance insights, tax queries, and expert opinions on Moneycontrol or download the Moneycontrol App to stay updated!
Find the best of Al News in one place, specially curated for you every weekend.
Stay on top of the latest tech trends and biggest startup news.


