


The technical structure that has developed on the Nifty’s weekly chart suggests bumpy ride going ahead during the week beginning Monday (March 18). This assumption is based on Nifty’s past behaviour based on such a technical structure I the recent past. NSE’s benchmark is expected to remain in the correction mode in the week ahead.
Nifty's winning streak snapped: Ends in red for the first time in four weeks!The Nifty came under intense selling pressure throughout the week ended March 15, closing 470 points lower or -2.09 percent at 22,023. With this, Nifty 50 also gave a lower close (closing below previous week’s low) for the first time since October 23, 2023 on the weekly chart, signalling caution. The maximum Call and Put open interest is placed at the 22,000 strike and the option activity at this strike will provide cues about Nifty’s direction in the coming week.
FPIs Increase Exposure to ShortsThe Long-Short Ratio of foreign portfolio investors (FPIs) stood at 41.86 percent on March 7, 2024. It increased to 42.89 percent on March 12 before settling at 37.55 percent on March 15. The FPIs have been steadily increasing their exposure to shorts in Index futures.
It is important to note here that the FPIs have been holding more short positions relative to long positions since January 18, 2024. Since this date the ratio hasn’t gone above 50. The lowest it went to was 22 percent on January 25 and the highest was 45.66 percent on February 27. The FPI activity in Index has remained subdued for quite a while.
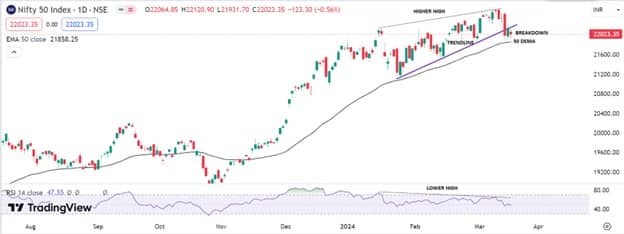
Weak Price Action Structure on the Daily ChartNifty has given a trendline breakdown on the daily chart (marked in purple) on March 13 and closed marginally above the 50-day exponential moving average (DEMA) of 21,858 (black line). The next two days, the same trendline acted as a resistance for the Index.
A relative strength index (RSI) bearish divergence is also visible with the price making higher highs and the RSI making lower highs, indicating slowdown in momentum for quite some time. It will be interesting to see if Nifty can hold on to the 50 DEMA level in the coming week. Moreover, Nifty 50 has formed an Evening Star candle like pattern on the weekly chart which is usually considered to be bearish reversal signal.
The Open Interest rose from 1.54 crore shares on March 7 to 1.61 crore shares on March 15, rising nearly 4 percent. The price during the same period fell 2 percent from 22,494 to 22,023. When open interest goes up and price goes down, it indicates buildup of fresh short positions. Though there were bouts of short covering observed on Intra-day basis, the larger trend remained negative.
The bulls have taken massive blows in the week gone by and it is to be seen if bears show some mercy or keep the pressure on them.
Option Activity at 22,000 to provide cuesBoth the Call and Put writers have sizeable positions at the 22,000 strike. The maximum Call & Put open interest is placed at this level, which makes 22,000 as the make-or-break level for Nifty. If Put writers (bulls) exit from the 22,000 strike and Nifty falls below the 50 DEMA, the fall is likely to intensify further. It will require a mammoth effort from the bulls in the coming week to make inroads and keep the bears at bay.
Disclaimer: The views and investment tips expressed by investment experts on Moneycontrol.com are their own and not those of the website or its management. Moneycontrol.com advises users to check with certified experts before taking any investment decisions.
Discover the latest Business News, Sensex, and Nifty updates. Obtain Personal Finance insights, tax queries, and expert opinions on Moneycontrol or download the Moneycontrol App to stay updated!
Find the best of Al News in one place, specially curated for you every weekend.
Stay on top of the latest tech trends and biggest startup news.


