


The Nifty50 has recovered almost 600 points from the recent bottom of 16,836 registered on January 25. During this recovery, the Nifty reached 17,410, which is almost at the 38.2 percent Fibonacci retracement of the entire downswing seen from 18,351 (Top Made on January 18, 2022) to 16,836 (Bottom Made on January 25, 2022).
Primary trend of the Nifty is still bearish, as the Nifty trades below its 50 and 100-day EMA (exponential moving average). During the pullbacks underlying could show retracement of 38.2 percent, 50 percent and 61.8 percent of the entire downswing. The Nifty has completed 38.2 percent retracement and now the next key resistances are placed at 17,593 and 17,772. The Nifty would be considered in downtrend unless it closes above 17,772.
Indicators and oscillators on the Nifty daily chart still show a bearish trend.
Any level below 16,836 would be considered a fresh sell signal on the Nifty charts. Below 16,836, the Nifty could slide towards the next support of 200-day EMA, currently placed at 16,612. Close below 200-day EMA could turn things bad to worse for the Nifty.
Click Here To Read All Live Updates On Union BudgetHowever, some of the sectoral indices look much stronger on the charts. PSU Bank, BankNifty and Auto indices are expected to outperform the Nifty with good margin.
Though we have seen pullback from the lower levels, we can't call it as a bullish trend reversal for Nifty. Budget Session is going to be very volatile for the markets, we can expect wild swings during the day.
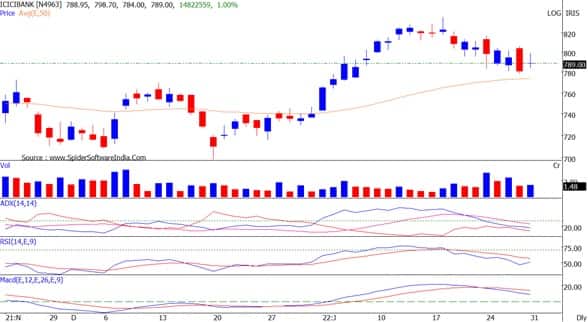
Catch all the market action on our live blogHere are three buy calls for next 2-3 weeks:ICICI Bank: Buy | LTP: Rs 788.80 | Stop-Loss: Rs 750 | Target: Rs 850 | Return: 7.8 percentThe stock has been into the running correction mode for the last eight trading sessions. The primary trend of the stock has been bullish with higher tops and higher bottoms. It is placed above all important moving averages, which indicates a bullish trend on all time frames.
Banking as a sector has been outperforming for a while and technical setup of the Bank index is much stronger than the Nifty. The stock is developing 'flag' kind of pattern on the daily chart.
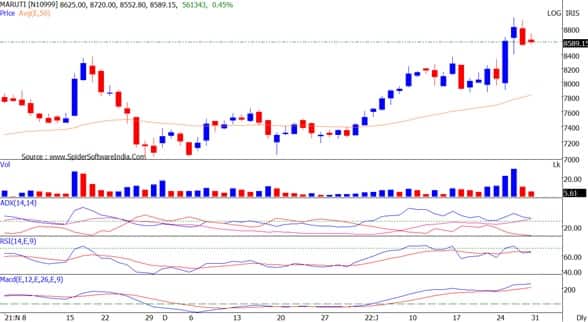
The stock has broken out from the bullish cup-and-handle pattern on the daily charts. A price breakout is accompanied with a jump in volumes. The stock has started outperforming other auto stocks. Indicators and oscillators have turned bullish on daily and weekly charts.
The stock sees running correction through the last two trading sessions. It has reached the previous breakout level and is expected to resume its uptrend.
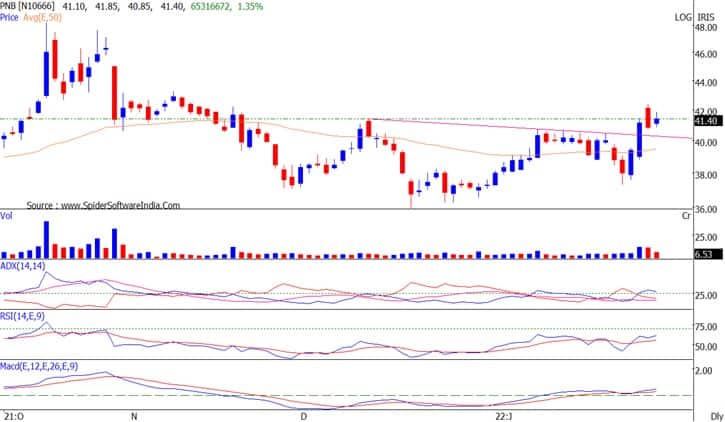
An inverted head-and-shoulder pattern breakout was seen on the daily chart. The stock price has broken out from the downward sloping trend line on the daily chart. Price breakout is accompanied with a rise in volumes.
Indicators and Oscillators have turned bullish on daily and weekly charts. The PSU Bank Index has started outperforming the Nifty50 and Bank Nifty. The stock surpassed the 20, 50, 100 and 200-day EMA resistances and is sustaining above it. Primary trend of the stock has been bullish with higher tops and higher bottoms.

Discover the latest Business News, Sensex, and Nifty updates. Obtain Personal Finance insights, tax queries, and expert opinions on Moneycontrol or download the Moneycontrol App to stay updated!
Find the best of Al News in one place, specially curated for you every weekend.
Stay on top of the latest tech trends and biggest startup news.


