


Finance Minister Nirmala Sitharaman may have taken just 91 minutes to deliver the Budget speech but the annual financial statement is a far more comprehensive and complex document.
For a simplified understanding of the broad aggregates of the Union Budget 2022-23, Moneycontrol has five easy graphs for its readers.
They look at the source of the government’s income as well as major areas of expenditure. They stack up direct taxes against indirect taxes, the factors that push the fiscal deficit and what can states expect from the pool of tax revenue.
Where does the money come from?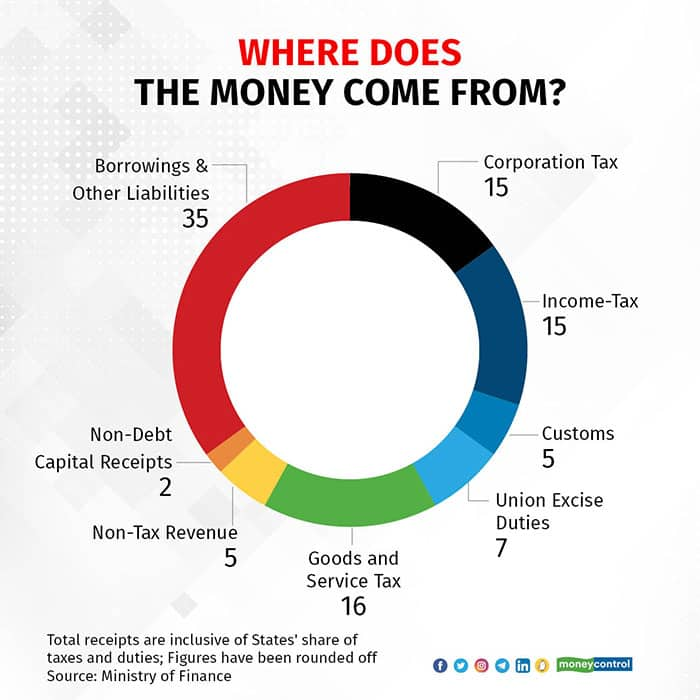 Borrowings and other liabilities accounted for the maximum, 35 percent, of the total money that came in2. Where does the money go?
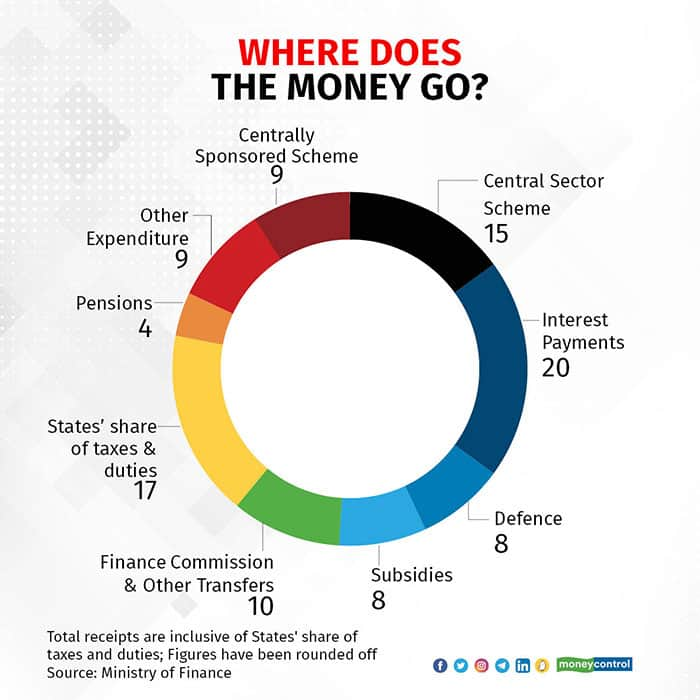 Interest payments account for 20 percent of the expenditure, followed by 17 percent of the money that is spent towards meeting states' share of taxes and duties3. Direct taxes may beat indirect taxes by a small margin
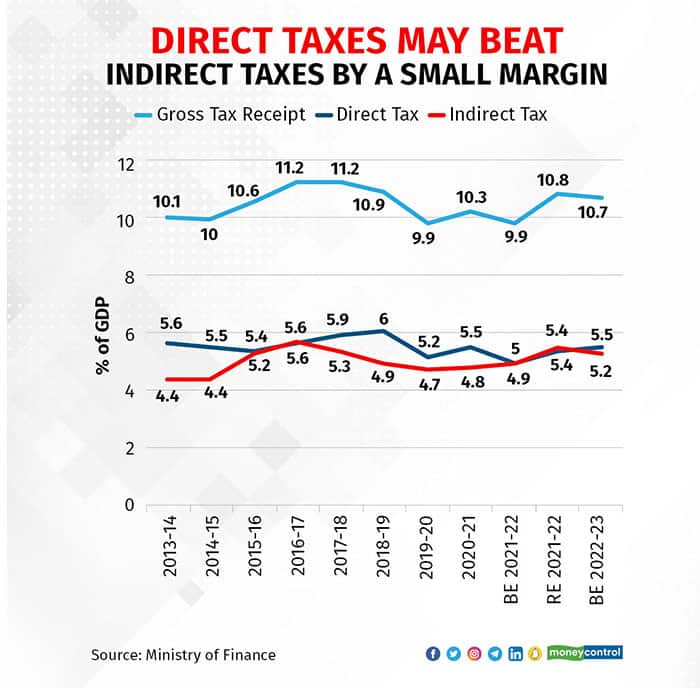 The shares of direct and indirect taxes in the GDP run neck-and-neck4. States can expect more generous transfers from Centre
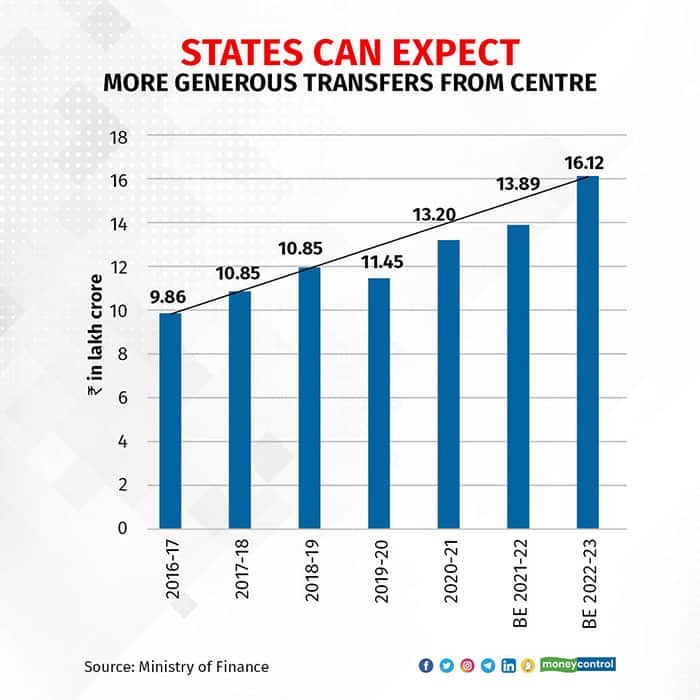 States have reason to cheer as the devolution is estimated to rise further in FY23
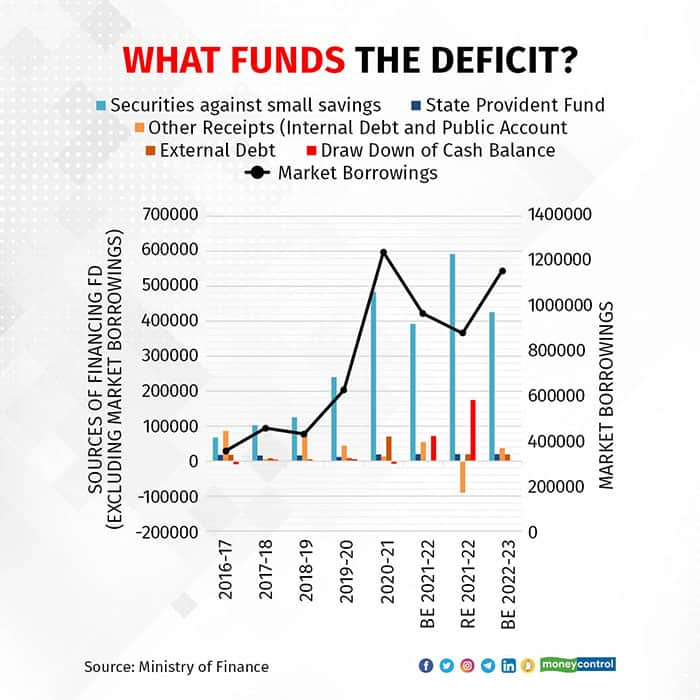 Market borrowings is one of the primary sources that bridges the deficit
 Discover the latest Business News, Sensex, and Nifty updates. Obtain Personal Finance insights, tax queries, and expert opinions on Moneycontrol or download the Moneycontrol App to stay updated!
Find the best of Al News in one place, specially curated for you every weekend.
Stay on top of the latest tech trends and biggest startup news.


