


The start of 2025 has clearly marked a shift in the RBI’s strategic orientation. The central bank’s focus has moved away from concerns around inflation and asset quality, and has pivoted decisively toward growth prioritisation.
Beginning in December 2024, the RBI embarked on a sustained phase of monetary easing—through policy rate cuts, large-scale liquidity support, and regulatory relaxation—with the explicit objective of stimulating economic activity through stronger credit creation. This support continues even today.
A key element of this shift has been the sheer magnitude of liquidity infusion.
Over the 14‑month period from December 2024 to January 2026, the RBI has undertaken or announced permanent liquidity injections totalling Rs 17.7 trillion.
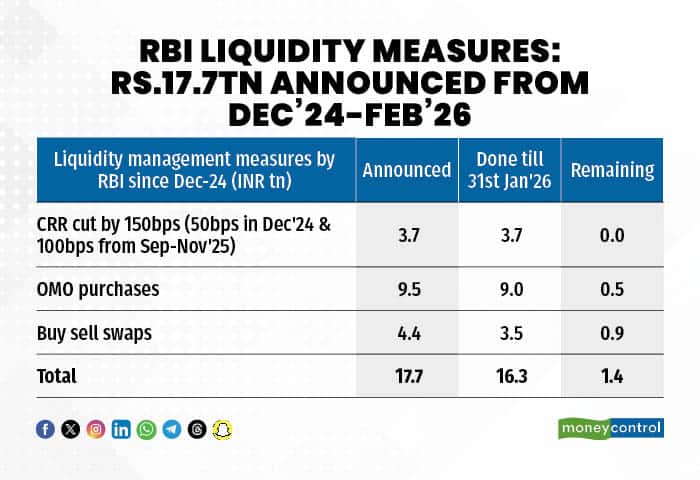
Of this amount, Rs 16.3 trillion had already been infused by January, with an additional Rs 1.4 trillion injected by the first week of February 2026.The policy tools used include outright purchases of government securities (OMOs), a CRR reduction that frees a portion of banks’ liabilities for credit creation, and FX buy–sell swaps under which the RBI purchases dollars today—injecting rupee liquidity—with an obligation to reverse these trades a few years later (typically within three years). In addition, the central bank conducted several long-tenor VRRR and VRR operations to smooth frictional liquidity mismatches.
It is interesting to note that by end financial year FY26, RBI would have conducted OMO purchase worth Rs. 6.7 trillion, thereby absorbing 61% of net G-sec supply or slightly more than one-third of net government bond supply (G-sec +SDL combined).
Hence, RBI’s presence had been very critical in clearing the government bond market this year.
Yet, despite this unprecedented scale of liquidity infusions, banking system liquidity stands at just Rs 1.5 trillion as of 30 January 2026—equivalent to only 0.6% of banks’ NDTL (net demand and time liabilities). During a monetary easing cycle, system liquidity of at least 1% of NDTL would normally be desirable.
Low system liquidity can also be partly attributed to high government cash balance. Throughout most days of FY26, central government cash balance has hovered around Rs 1.5 trillion to Rs 4 trillion (averaging at Rs 2.5 trillion). Since the RBI is the banker to both the central and state governments, idle cash held by the government is effectively withdrawn from the banking system.
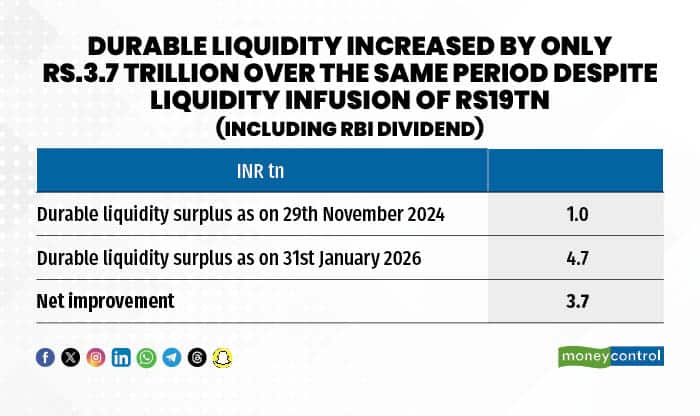
Market participants typically adjust for this by looking at ‘durable liquidity’—liquidity net of government cash balances—on the assumption that these funds will eventually return to the system. However, even after this adjustment, durable liquidity is just Rs 4.7 trillion (1.8% of NDTL), barely Rs 3.5 trillion higher than 14 months ago and insufficient to ease system-wide stress.
The consequence has been a sharp rise in money-market rates.
Three‑month CD rates—the short-term funding cost for banks—have increased from around 5.80% in August–October 2025 to over 7.20% by January 2026, a rise of 140 bps despite an accommodative monetary policy backdrop.
The spread over T‑bills has widened from 30–40 bps to nearly 170 bps over the same period, underscoring intense liquidity pressure in the banking system.
This naturally raises the core question: if nearly Rs. 18 trillion was injected, where did the liquidity go? Or in other words, what developments in the market required such massive support?
Hence, we analyse the forces that sucked out this liquidity.
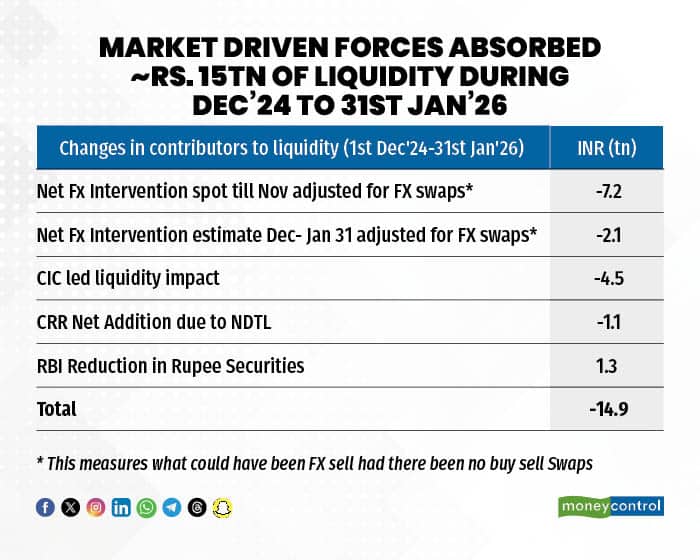
It was relatively higher currency leakage (i.e. hard cash withdrawal by the public) and shortage of dollar capital flow in India which necessitated RBI to sell its own dollar reserves (either in spot or in the forwards) to provide for the dollar needs, thereby sucking out rupee liquidity in exchange.
Currency withdrawals have amounted to Rs 4.4 trillion over the past 14 months—three times higher during the first 10 months of FY26 compared to the same period last year, and at least Rs. 1 trillion above the average trend of the past four years. This is a curious phase: physical cash withdrawals are rising even as digital payments continue to expand at a healthy pace (up 14% year‑on‑year during the first nine months of FY26).
A part of liquidity also gets sucked out due to an organic growth in the banks’ liability base which requires some proportion to be parked with RBI on account of regulatory CRR requirement (currently 3%, and NDTL base has been growing at 11-12%). But this is an organic phenomenon, which happens every year.
However, these were not the dominant factors. The primary driver of the liquidity drain has been the RBI’s large-scale dollar sales.
Our estimates suggest that, without the mitigating effect of FX buy–sell swaps, the RBI’s spot FX operations would have withdrawn approximately Rs. 9.2 trillion from the system. Effectively, around 60% of the liquidity infused was required to offset capital outflows, 30% to offset currency withdrawals, and 8% to meet CRR-related requirements. Only the remaining 2% actually augmented system liquidity.
To sum it all, negative sentiments around rupee has been at the helm of liquidity crunch in the Indian banking system and consequent rise in bond yields across the corporate and government bond space.
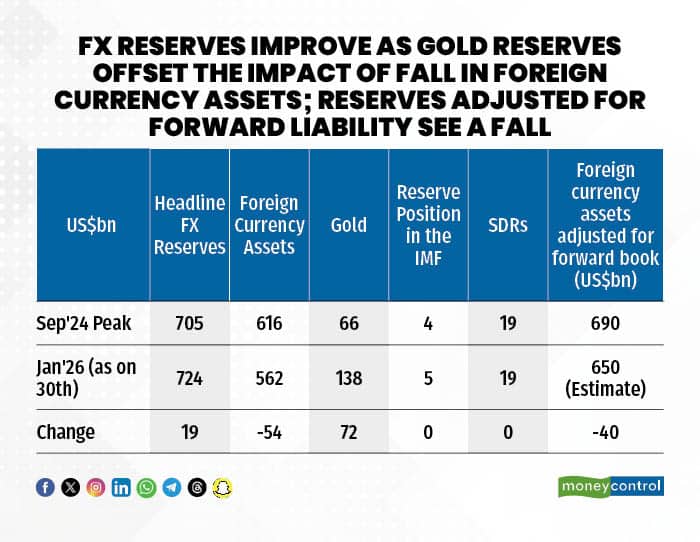
Despite substantial capital outflows, India’s FX reserves have remained broadly near $ 700 billion—a development that appears counter‑intuitive. FX reserves peaked only in the last week of January 2026 at $724 billion (earlier peak was at US$705bn in September 2024). This stability is explained by two factors: gains in gold and deferred recognition of dollar liabilities through a larger forward book.
FX reserves in India consist mainly of foreign currency assets (88% of total reserves on a five-year average), gold (8%), and smaller components such as SDRs and the IMF reserve tranche. Since the peak in September 2024, foreign currency assets have declined by $54 billion (after valuation adjustments), but gold holdings have risen by $72 billion—driven by both new purchases and valuation gains. This has entirely offset the decline in foreign currency assets.
Importantly, the RBI’s gold share in reserves has risen from an average of 6% during FY00–FY20 to 19% by end January 2026. This is over double China’s gold share (8.3% as of November 2025), though still below the global average of around 25%.
Additionally, the RBI’s forward-book liability has increased by USD 49 billion (as of December 2025). Adjusting for these future obligations, India’s effective FX reserves have declined to an estimated USD 650 billion by January 2026.
Even a sub‑1% current account deficit was proving difficult to fund. Historically, India’s external account has been considered sustainable as long as the CAD remains below 2% of GDP. CAD has indeed remained below this threshold since COVID—0.6% of GDP in FY25 and an estimated 0.5% in FY26—equivalent to $20 billion of annual deficits since FY24. The absence of a trade deal would have led to a balance‑of‑payments deficit for a second consecutive year. The key reason was the steep fall in net FDI. Between FY15 and FY22, net FDI never fell below $30 billion. It dropped to $28 billion in FY23, then to $10 billion in FY24, and collapsed further to just $ 1 billion in FY25. By November FYTD (financial year to date) FY26, the total was only $6 billion. Rising US Treasury yields have also made dollar borrowing less attractive, increasing dependence on volatile FPI flows.
Now with the trade deal fructifying, it could help ease external account pressures by reviving FII inflows and reducing depreciation pressures on the Indian rupee, which has sharply underperformed relative to other emerging‑market currencies.
An improvement in balance of payments position would in turn support better domestic liquidity conditions.
(Namrata Mittal, Chief Economist & Varnika Khemani, Economist, SBI Mutual Fund.)
Views are personal and do not represent the stand of this publication.
Discover the latest Business News, Sensex, and Nifty updates. Obtain Personal Finance insights, tax queries, and expert opinions on Moneycontrol or download the Moneycontrol App to stay updated!
Find the best of Al News in one place, specially curated for you every weekend.
Stay on top of the latest tech trends and biggest startup news.


