


The market saw profit-taking after a four-day rally and closed moderately lower on June 28, despite positive breadth. About 1,262 shares advanced, and 1,056 shares declined on the NSE. The Nifty 50 is expected to consolidate with a hurdle at 24,200 on the higher side and support at 23,800. Here are some trading ideas for the near term:
Rajesh Bhosale, Technical Analyst at Angel OneMahindra Logistics | CMP: Rs 525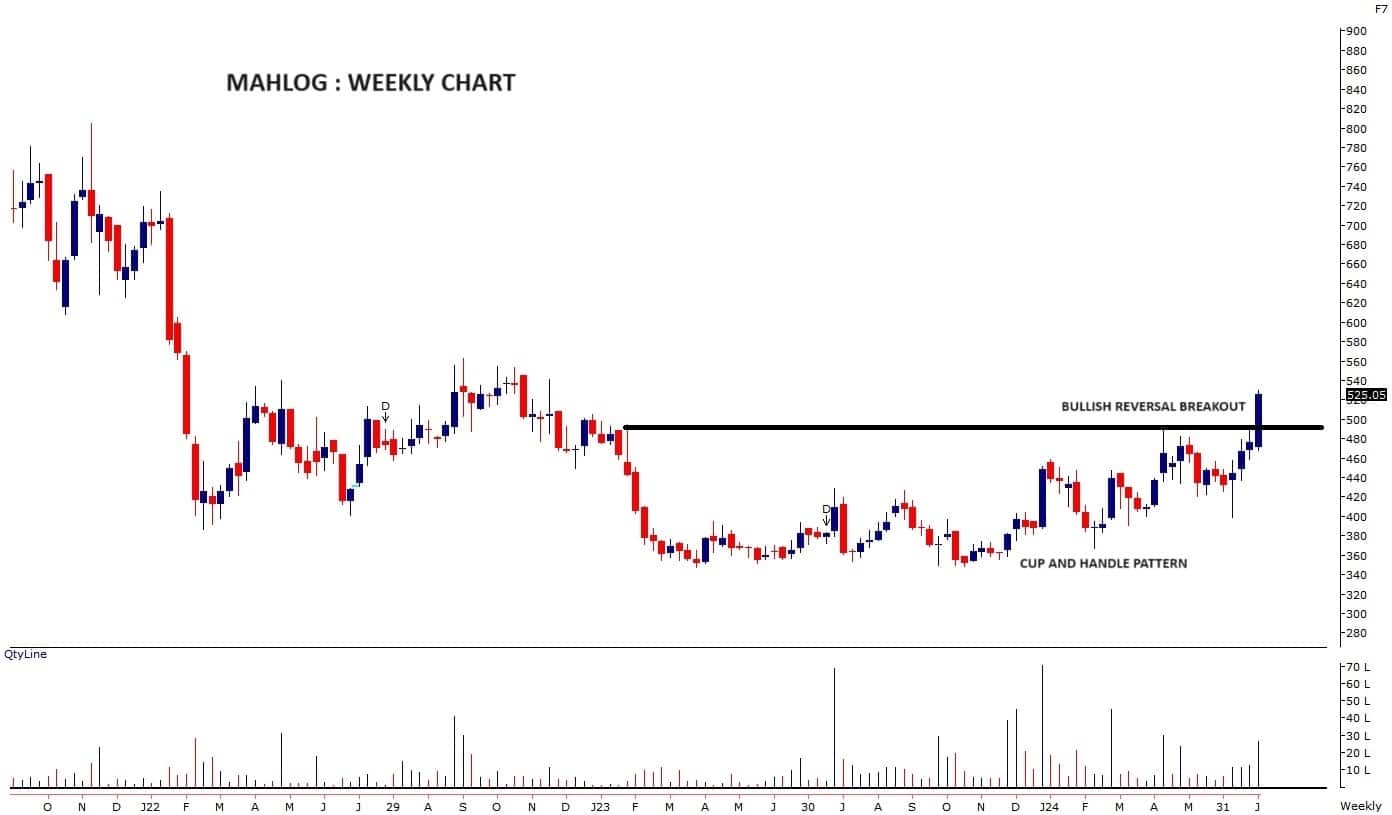
On the weekly chart, Mahindra Logistics prices have confirmed a bullish reversal pattern breakout known as the Cup and Handle. This breakout occurred after a strong consolidation period of more than 18 months and is supported by a significant surge in volumes. Prices have also broken above the 200-week moving average, which previously acted as strong resistance. Although the indicators have now entered the overbought zone, this suggests inherent strength in the stock. Hence, we recommend buying Mahindra Logistics around Rs 515-520.
Strategy: Buy
Target: Rs 577
Stop-Loss: Rs 488
Amber Enterprises | LTP: Rs 4,521.75
Amber Enterprises prices are in a strong uptrend, following a higher high and higher low price cycle. During the week ended June 28, prices broke through a key hurdle that had acted as stiff resistance three times in the past six months, signaling a momentum trigger for the bulls. Volume analysis shows higher volume during upticks compared to lower volume during downticks, indicating accumulation in this counter. Considering the technical setup, we have a positive view on this counter. Hence, we recommend buying Amber Enterprises around Rs 4,500-4,510.
Strategy: Buy
Target: Rs 4,960
Stop-Loss: Rs 4,275
Patanjali Foods | CMP: Rs 1,591.4
In recent weeks, Patanjali Foods prices have been forming a strong base around the 50 EMA (Exponential Moving Average) on the weekly chart. Last week, a surge from this support level led to a symmetrical triangle breakout, supported by a significant increase in volume. Additionally, we are observing a fresh buy crossover in the RSI (Relative Strength Index) smoothed indicator with its moving average, further supporting our view. Based on this evidence, we expect strong outperformance by this stock. Hence, we recommend buying Patanjali Foods around Rs 1,580-1,590.
Strategy: Buy
Target: Rs 1,740
Stop-Loss: Rs 1,510
Rajesh Palviya, Senior Vice President Research (Head Technical Derivatives) at Axis SecuritiesBiocon | CMP: Rs 351.1
In April 2024, Biocon confirmed a "Rounding Bottom formation" breakout at Rs 295 levels and has been sustaining above the same. This breakout is accompanied by huge volumes indicating increased participation. Recently, the stock has recaptured its 20, 50, and 100-day SMA and rebounded sharply, which reconfirms the bullish trend. The monthly "Bollinger Bands" buy signal indicates increased momentum. The weekly and monthly strength indicator RSI is in positive terrain, which justifies rising strength across all time frames. Investors should buy, hold, and accumulate this stock with an expected upside of Rs 385-405, and with a downside support zone of Rs 335-325 levels.
Strategy: Buy
Target: Rs 385, Rs 405
Stop-Loss: Rs 335-325
LIC Housing Finance | CMP: Rs 796.8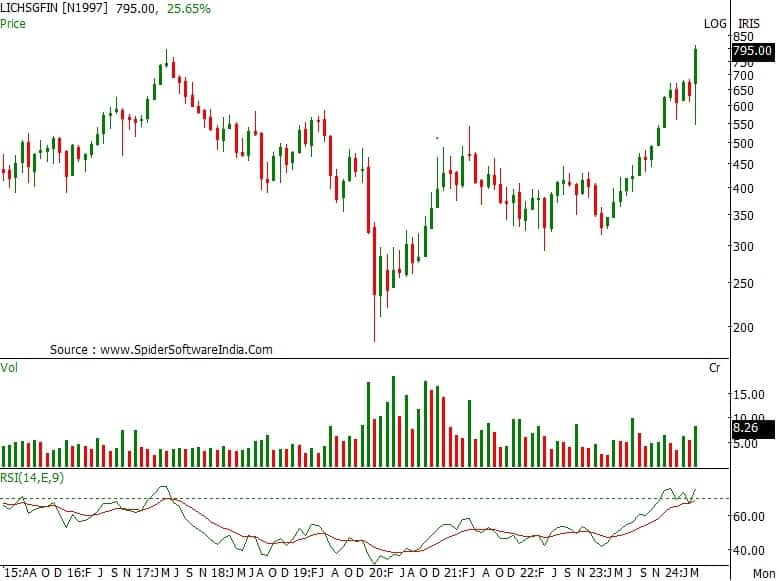
LIC Housing Finance is in a strong uptrend across all time frames, forming a series of higher tops and bottoms, indicating positive bias. It has registered an all-time high at Rs 809, indicating bullish sentiments. The stock has been well placed above its 20, 50, 100, and 200-day SMA, and these averages are also inching up along with the price rise, which reaffirms the bullish trend. The weekly "Bollinger Bands" buy signal indicates increased momentum. The daily, weekly, and monthly strength indicator RSI is in positive terrain, which justifies rising strength across all time frames. Investors should buy, hold, and accumulate this stock with an expected upside of Rs 830-860, with a downside support zone of Rs 770-750 levels.
Strategy: Buy
Target: Rs 830-860
Stop-Loss: Rs 770-750
Praj Industries | CMP: Rs 728.65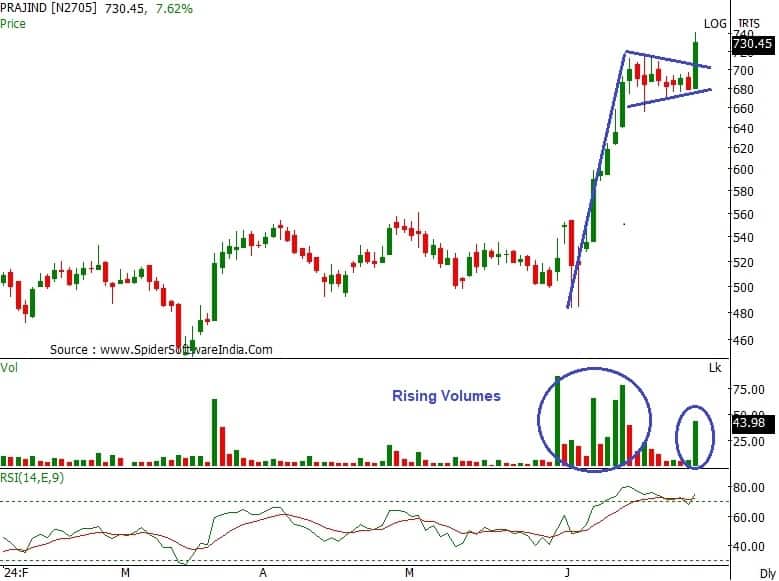
On the daily chart, Praj Industries stock has confirmed a "Pennant" continuation pattern breakout at Rs 718 levels along with huge volumes. The stock has been well placed above its 20, 50, 100, and 200-day SMA, and these averages are also inching up along with the price rise, which reaffirms the bullish trend. The daily, weekly, and monthly strength indicator RSI is in positive terrain, which justifies rising strength across all time frames. Investors should buy, hold, and accumulate this stock with an expected upside of Rs 760-790, with a downside support zone of Rs 715-675 levels.
Strategy: Buy
Target: Rs 760-790
Stop-Loss: Rs 715-675
Subash Gangadharan, Senior Technical/Derivative Analyst at HDFC SecuritiesTata Consultancy Services | CMP: Rs 3,904
TCS has been consistently making higher tops and higher bottoms over the last few weeks. Last week (ending June 28), the stock bounced from the 20-day SMA and cleared its nearby resistances on the back of above-average volumes. With momentum readings like the 14-day RSI also in rising mode, this augurs well for the uptrend to continue.
Strategy: Buy
Target: Rs 4,050
Stop-Loss: Rs 3,820
Star Health & Allied Insurance Company | CMP: Rs 558.65
Star Health corrected sharply between May and early June. It found support at a low of Rs 491 and has subsequently rallied higher, indicating it has reversed the recent downtrend. Last week, the stock broke out of the recent trading range on the back of above-average volumes and also closed above the 20-day and 50-day SMA. With the 14-week RSI also in rising mode and above its 9-week EMA, we expect the stock to head higher in the coming sessions.
Strategy: Buy
Target: Rs 630
Stop-Loss: Rs 520
Caplin Point Laboratories | CMP: Rs 1,472.6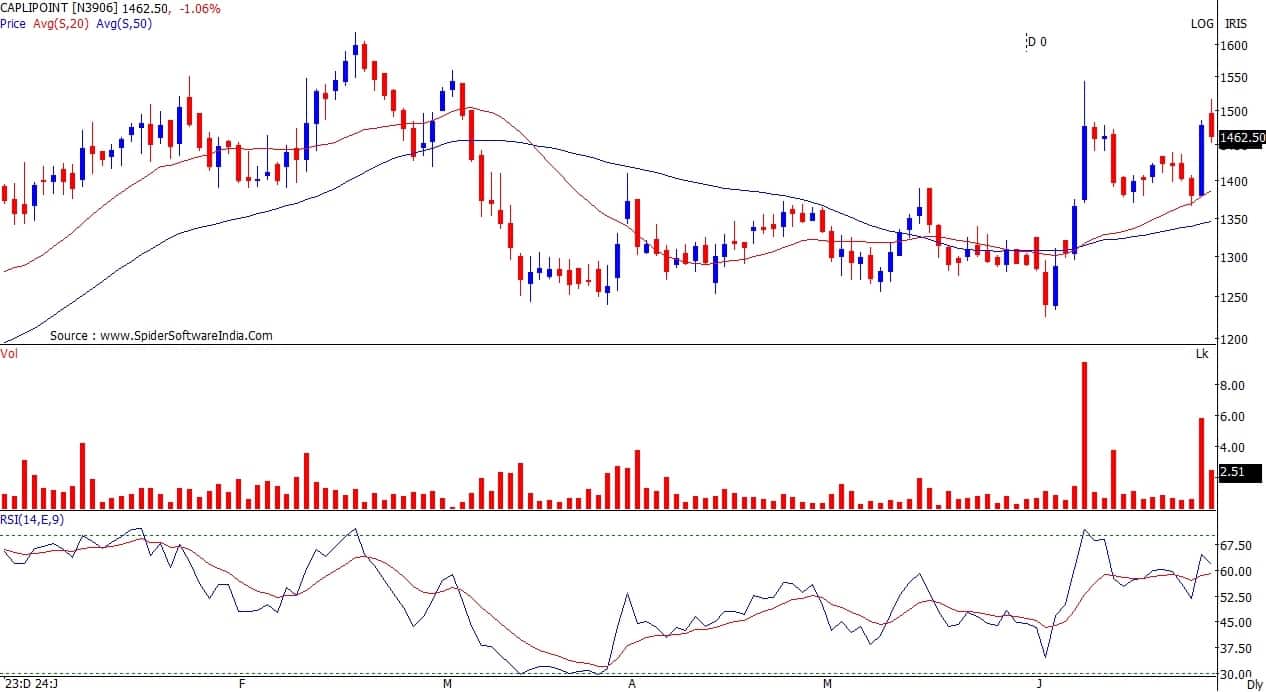
Caplin Point Laboratories has made a triple bottom pattern around Rs 1,225 levels. It has subsequently rallied higher. Last week, it broke out of a trading range on the back of huge volumes. Momentum readings like the 14-day RSI are also in rising mode and not overbought. With the intermediate technical setup looking encouraging, we expect the stock to gradually move higher in the coming sessions.
Strategy: Buy
Target: Rs 1,600
Stop-Loss: Rs 1,350
Jigar S Patel, Senior Manager - Equity Research at Anand RathiNestle India | CMP: Rs 2,551.65
Recently, Nestle India has shown significant technical resilience by finding support around the Rs 2,500 mark, a critical support zone for the stock. This level has historically acted as a strong floor, preventing the stock from declining further. Moreover, the stock has formed a Rounding Bottom pattern near this zone, which is typically a bullish signal indicating a potential reversal of a downtrend. Adding to the bullish outlook, the Relative Strength Index (RSI) on the daily chart has bounced back from the 50 level. The RSI is a momentum indicator, and a reversal from the 50 level suggests renewed buying interest and potential upward momentum. Given these technical signals, we recommend investors and traders to consider going long on Nestle India within the price range of Rs 2,530-2,555. The suggested upside target for this trade is Rs 2,650, while a stop-loss should be set at Rs 2,480 on a daily closing basis to manage potential downside risks.
Strategy: Buy
Target: Rs 2,650
Stop-Loss: Rs 2,480
Disclaimer: The views and investment tips expressed by investment experts on Moneycontrol.com are their own and not those of the website or its management. Moneycontrol.com advises users to check with certified experts before taking any investment decisions.Discover the latest Business News, Sensex, and Nifty updates. Obtain Personal Finance insights, tax queries, and expert opinions on Moneycontrol or download the Moneycontrol App to stay updated!
Find the best of Al News in one place, specially curated for you every weekend.
Stay on top of the latest tech trends and biggest startup news.


