


The benchmark indices recorded a new high on May 23 by showing a long bullish candlestick pattern on the daily charts. The BSE Sensex and Nifty 50 indices ended at a new all-time closing high, but with negative breadth as approximately 1,204 equity shares declined and 1,043 shares advanced on the NSE. The market has reached near the crucial resistance of 23,000 on the Nifty 50, and it needs to give a strong close above the same for further upward journey from hereon. However, below the same, it may consolidate. Here are some trading ideas for the near term.
Amol Athawale, VP-Technical Research at Kotak Securities
Infosys | CMP: Rs 1,472.4

Post its declining trend from the higher levels, Infosys is in consolidation mode, trading in a rectangle formation. However, the recent bullish activity near the demand zone indicates good strength. The gradual upward moves in the counter suggest a fresh leg of a bullish trend in the near term.
Strategy: Buy
Target: Rs 1,575
Stop-Loss: Rs 1,420
IndusInd Bank | CMP: Rs 1,440.85
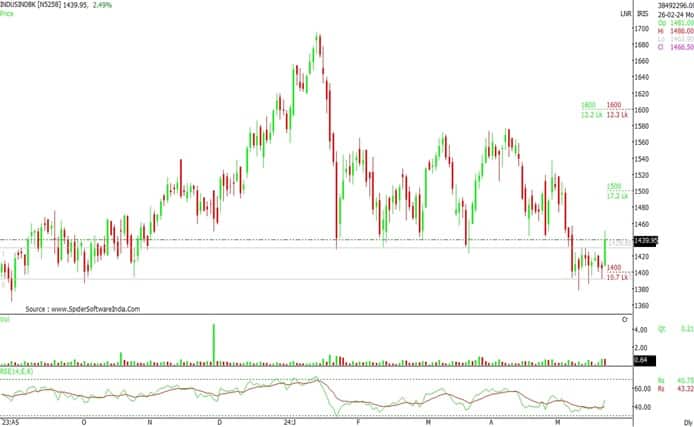
After a short-term correction from the higher levels, IndusInd Bank was in the accumulation zone where it was trading in a rectangle formation. However, on the daily charts, there is a range breakout in the counter along with decent volume activity, which suggests upward momentum to persist in the coming horizon.
Strategy: Buy
Target: Rs 1,540
Stop-Loss: Rs 1,390
Eicher Motors | CMP: Rs 4,852.85

On the weekly charts, the counter is in a rising channel chart formation with a higher high and higher low series pattern. Additionally, technical indicators like ADX (average directional index) and RSI (relative strength index) are also indicating a further uptrend from current levels, which could boost the bullish momentum in the near future.
Strategy: Buy
Target: Rs 5,200
Stop-Loss: Rs 4,690
Chandan Taparia, Head - Equity Derivatives & Technicals, Broking & Distribution at Motilal Oswal Financial Services
Bharti Airtel | CMP: Rs 1,374
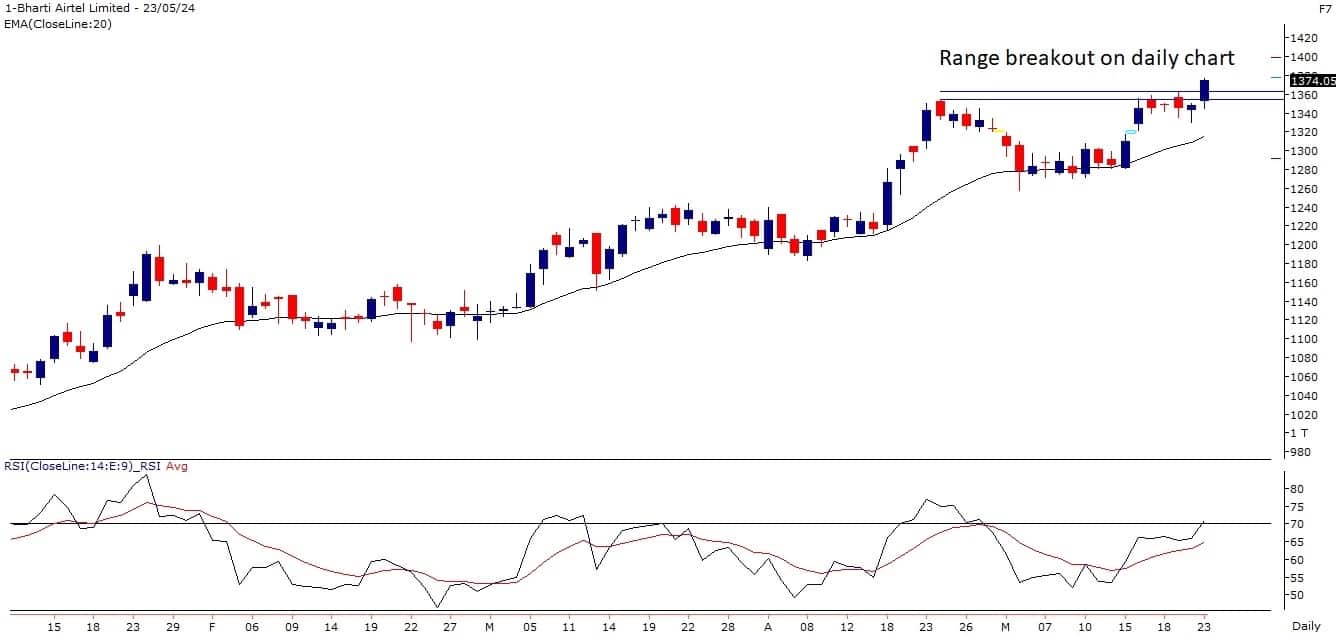
Bharti Airtel has given a range breakout on the daily chart and managed to close above the same. It has formed a bullish candle on the daily scale, and supports are gradually shifting higher. The momentum indicator, relative strength index (RSI), is positively placed, which may take prices higher.
Strategy: Buy
Target: Rs 1,480
Stop-Loss: Rs 1,310
Mahindra and Mahindra | CMP: Rs 2,609

M&M has been continuously forming higher highs and higher lows for the past three weeks. It has given an Inside Bar breakout on the daily scale and achieved its highest daily close ever.
Strategy: Buy
Target: Rs 2,750
Stop-Loss: Rs 2,520
Axis Bank | CMP: Rs 1,165

Axis Bank has retested the breakout and is inching higher. The overall trend is bullish, and every small decline is being bought into. Buying activity is visible across private banks, which may support the ongoing uptrend.
Strategy: Buy
Target: Rs 1,250
Stop-Loss: Rs 1,130
State Bank of India | CMP: Rs 832
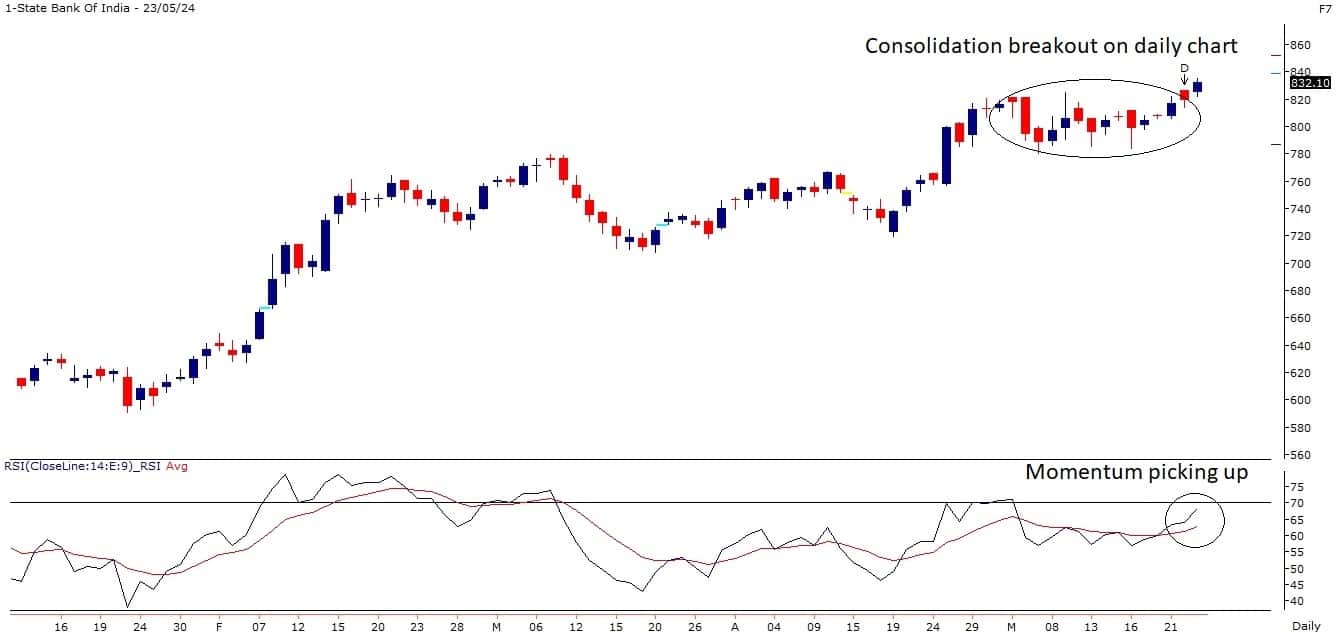
SBI is in an overall uptrend and has given a consolidation breakout on the daily chart. The base is shifting higher, and a small follow-up can take it towards the Rs 880-900 zones.
Strategy: Buy
Target: Rs 900
Stop-Loss: Rs 790
Mitesh Karwa, Technical Research Analyst at Bonanza Portfolio
Larsen & Toubro | CMP: Rs 3,585.40

L&T has seen a breakout of a downward sloping resistance trendline and is forming a bullish candlestick with above-average volumes after taking support from a crucial zone on the weekly timeframe. On the indicator front, the Supertrend indicator is indicating a bullish reversal on the daily timeframe, and the momentum oscillator RSI (14) is around 56 on the daily timeframe, indicating strength by sustaining above 50.
Observation of the above factors indicates that a bullish move in L&T is possible with a target up to Rs 3,730. One can initiate a buy trade in the range of Rs 3,583-3,585, with a stop-loss of Rs 3,480 on a daily closing basis.
Strategy: Buy
Target: Rs 3,730
Stop-Loss: Rs 3,480
Maruti Suzuki | CMP: Rs 12,934.9
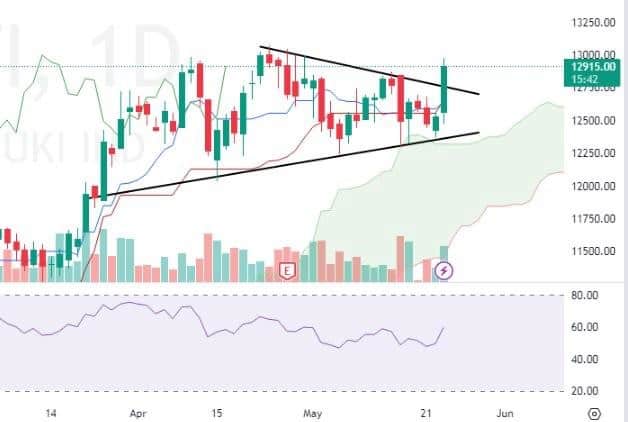
Maruti has seen a breakout of a triangle pattern with above-average volumes and a bullish candlestick on the daily timeframe. The Supertrend indicator is also indicating a bullish continuation, supporting the bullish view. The momentum oscillator RSI (14) is around 59 on the daily timeframe, indicating strength by sustaining above 50, and the Ichimoku Cloud is suggesting a bullish move as the price is trading above the conversion and baseline.
Observation of the above factors indicates that a bullish move in Maruti is possible with a target up to Rs 13,330. One can initiate a buy trade in the range of Rs 12,930-12,934, with a stop-loss of Rs 12,750 on a daily closing basis.
Strategy: Buy
Target: Rs 13,330
Stop-Loss: Rs 12,750
Disclaimer: The views and investment tips expressed by investment experts on Moneycontrol.com are their own and not those of the website or its management. Moneycontrol.com advises users to check with certified experts before taking any investment decisions.
Discover the latest Business News, Sensex, and Nifty updates. Obtain Personal Finance insights, tax queries, and expert opinions on Moneycontrol or download the Moneycontrol App to stay updated!
Find the best of Al News in one place, specially curated for you every weekend.
Stay on top of the latest tech trends and biggest startup news.


