


The market extended its southward journey for the second consecutive session, falling over a percent to close at a more than 7-month low on January 27, while the breadth remained in favour of bears. A total of 2,364 shares declined against 256 shares that advanced on the NSE. The benchmark indices may attempt to rebound amid rangebound trading and rising volatility. Below are some trading ideas for the near term:
Jigar S Patel, Senior Manager - Equity Research at Anand Rathi
Hindustan Unilever | CMP: Rs 2,392.85

Hindustan Unilever (HUL) recently formed a strong technical setup with four extended bottoms, accompanied by bullish divergence on the charts. This indicates a potential reversal or uptrend. In the last two trading sessions, HUL exhibited robust momentum, supported by the formation of a Hammer-like bullish candlestick pattern near its long-term support zone of Rs 2,265-2,250. This confluence of technical signals suggests that the stock is at an attractive level for a possible upward move. Traders may consider entering long positions in the Rs 2,365-2,395 zone, with an upside target of Rs 2,560.
Strategy: Buy
Target: Rs 2,560
Stop-Loss: Rs 2,260
Dabur India | CMP: Rs 523.85
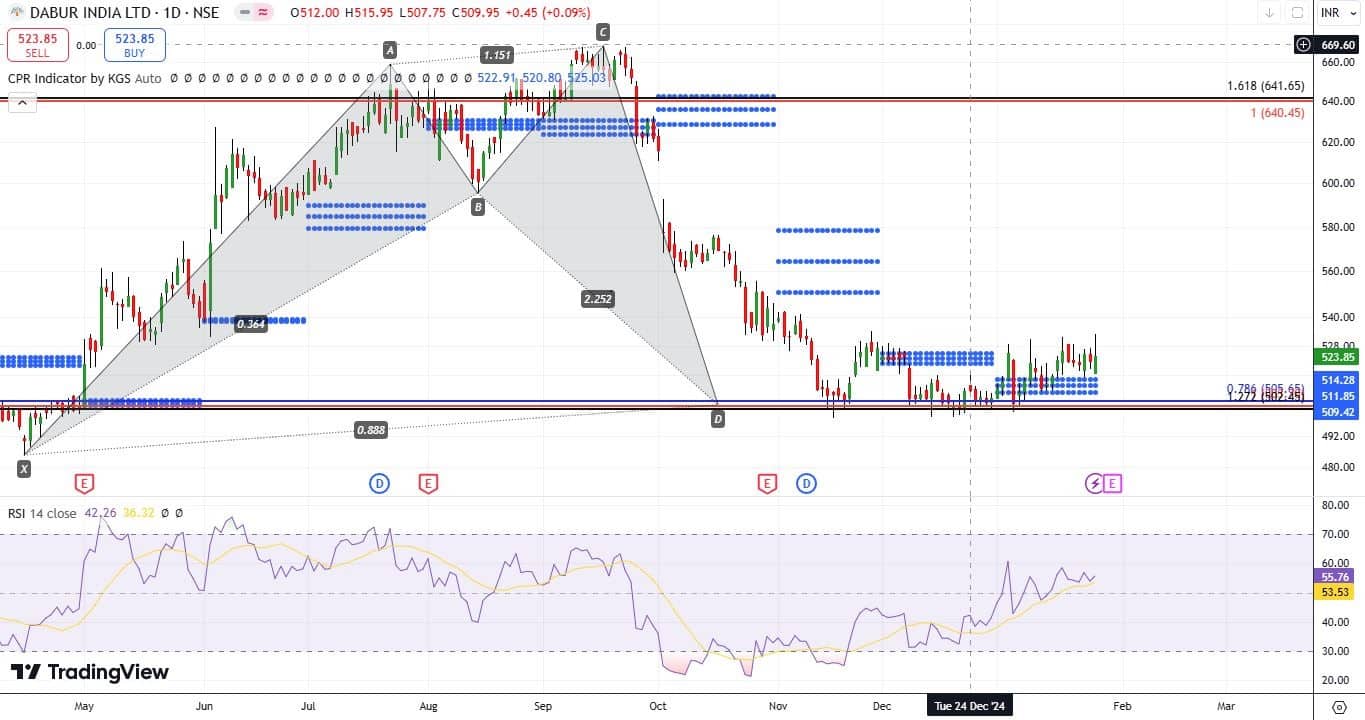
Dabur has shown significant stability around the Rs 500 level over the past 2-3 months, which has served as a strong long-term support since 2022. This stability indicates the stock’s resilience at these levels. Furthermore, Dabur is currently sustaining above the monthly Central Pivot Range (CPR), a key indicator of bullish sentiment. On the daily chart, a bullish divergence is visible, along with the formation of a bullish shark pattern, both of which suggest a potential upward reversal. These technical factors make Dabur a lucrative opportunity at current levels. Traders may consider entering long positions in the Rs 520-525 zone, with an upside target around Rs 580.
Strategy: Buy
Target: Rs 580
Stop-Loss: Rs 490
Vedanta | CMP: Rs 423.9
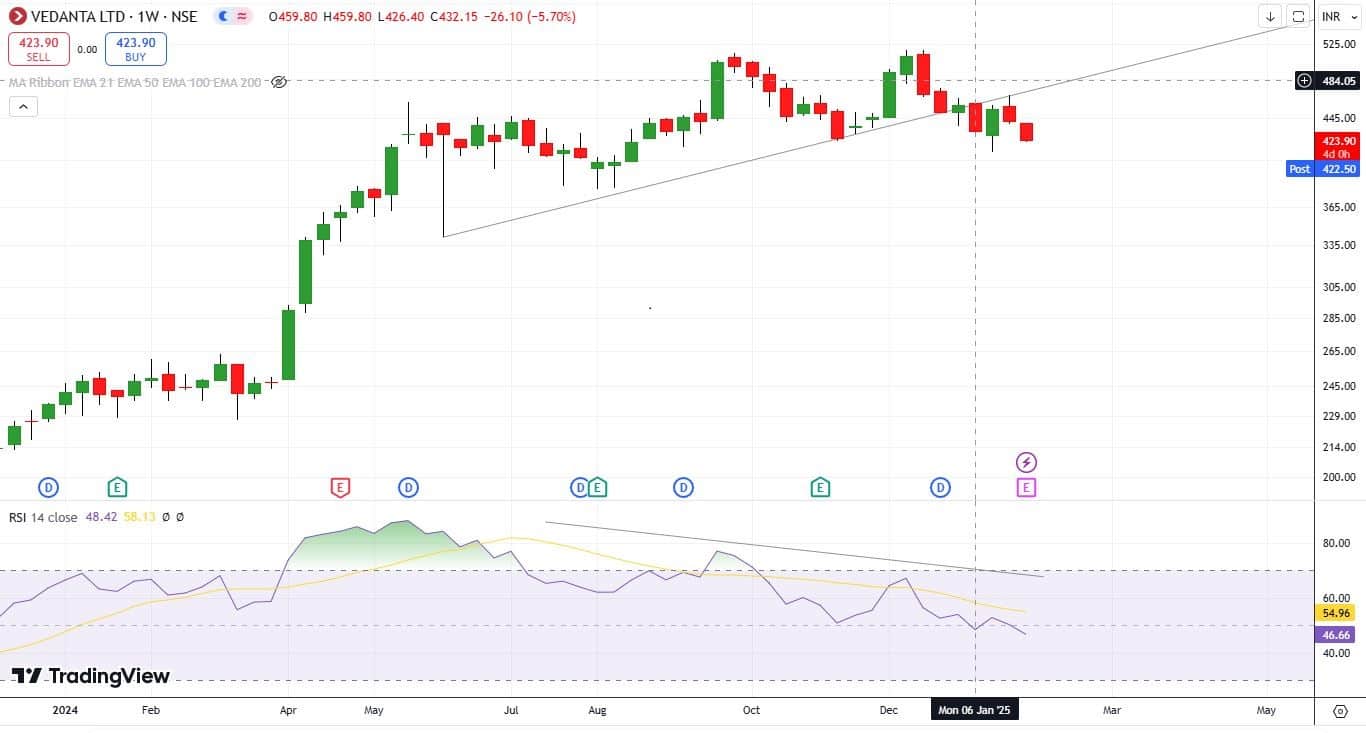
On the weekly chart, Vedanta has formed a 3-point negative divergence, indicating weakening momentum despite price increases. Additionally, the trendline violation confirms bearish sentiment, signaling a potential downside. These technical signals suggest a high probability of a correction. Traders may consider entering sell positions in the Rs 435-440 zone, with a downside target of Rs 396.
Strategy: Sell
Target: Rs 396
Stop-Loss: Rs 458
Jay Thakkar, Vice President & Head of Derivatives and Quant Research at ICICI Securities
Axis Bank February Futures | CMP: Rs 948.8

Axis Bank has witnessed a huge increase in short positions in the near term, with open interest (OI) rising by more than 110%, while the prices have corrected significantly. The stock had recovered quite well from its day’s lows in the last trading session and closed at higher levels, thus increasing the probability of a bounce back from here. There are also multiple swing supports near these levels, which is positive for the stock from a risk-to-reward perspective on the long side. There have been huge short positions on the options side, which have caused the Put-Call Ratio (PCR) to fall to 0.42, indicating that the stock is extremely oversold.
The maximum pain is at Rs 960, and the modified maximum pain is at Rs 1,014. Hence, above Rs 960, the stock can move up to Rs 1,014 in the near term. On the downside, Rs 925 to Rs 935 is an immediate support range. The implied volatilities (IVs) rose in the last session; however, the price didn’t rise much, indicating that momentum on the lower side is weakening, which raises the chance of a bounce back.
Strategy: Buy
Target: Rs 980, Rs 990
Stop-Loss: Rs 935
Bharti Airtel February Futures | CMP: Rs 1,603.2
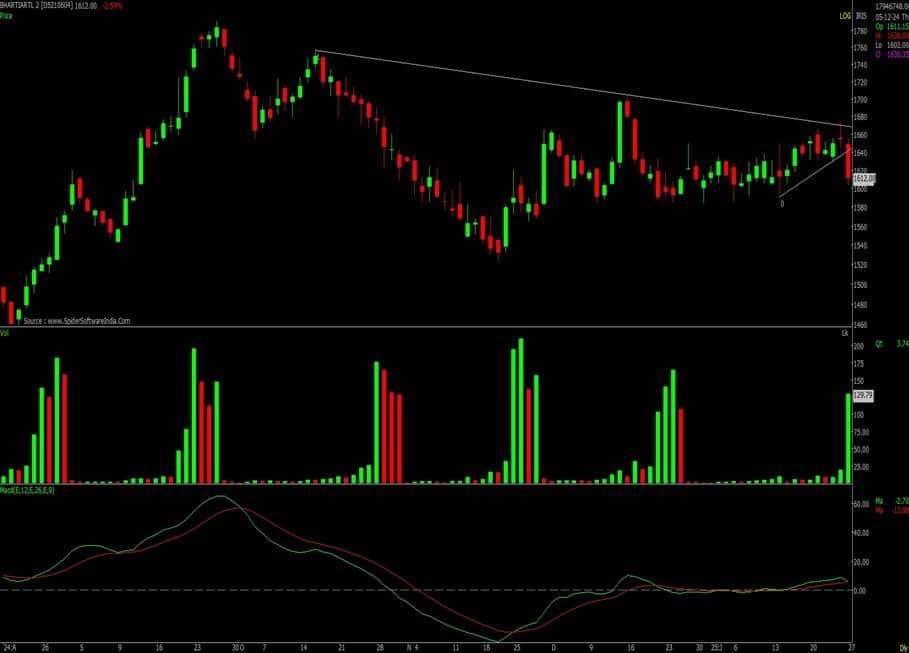
Bharti Airtel has seen fresh shorts added in the last trading session. The stock had fallen earlier due to long unwinding, and thereafter, short positions were added, with a negative divergence in the momentum indicator, indicating a trend reversal. The recent bounce was merely a corrective bounce as the shorts were covered. However, the bounce did not allow the stock to form a new high and has now reversed with fresh shorts being added, suggesting that the next leg down has resumed.
The stock has seen unwinding of Puts and a huge addition of Call open interest at the Rs 1,640 strike, indicating a higher probability of downside. The IVs have jumped significantly from 14.20 to 26.75, and the IV Percentile (IVP) surged to 94, indicating that it is oversold. However, the IV Rank (IVR) is still below 40 at 47.31, meaning there is still room for the IVs to increase. The maximum pain is at Rs 1,620, and the modified maximum pain is at Rs 1,617, so these levels will act as resistance in the near future.
Strategy: Sell
Target: Rs 1,560, Rs 1,520
Stop-Loss: Rs 1,650
Infosys February Futures | CMP: Rs 1,819.6
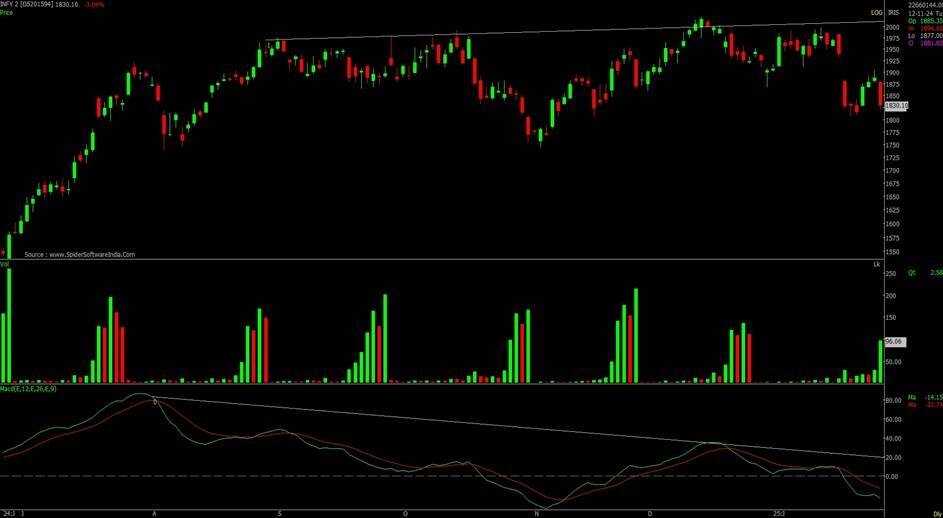
Infosys has recently seen weakening momentum as prices have failed to form a higher high. The stock had previously witnessed long unwinding in futures; however, prices made new highs while the momentum indicator did not, indicating a negative divergence. The fall in the last trading session has seen additions in shorts, meaning the stock may fall further unless the recent swing highs are surpassed, as shorts are being added with a lower high.
The stock is trading below its maximum pain and modified maximum pain levels of Rs 1,860 and Rs 1,887, which is also bearish in the short term. There has been Put unwinding at the Rs 1,800-1,860 strikes, which is negative; however, there is no aggressive Call writing, so the outlook is mildly bearish in the near term.
Strategy: Sell
Target: Rs 1,765, Rs 1,745
Stop-Loss: Rs 1,870
Anshul Jain, Head of Research at Lakshmishree Investments
Jindal Drilling Industries | CMP: Rs 788
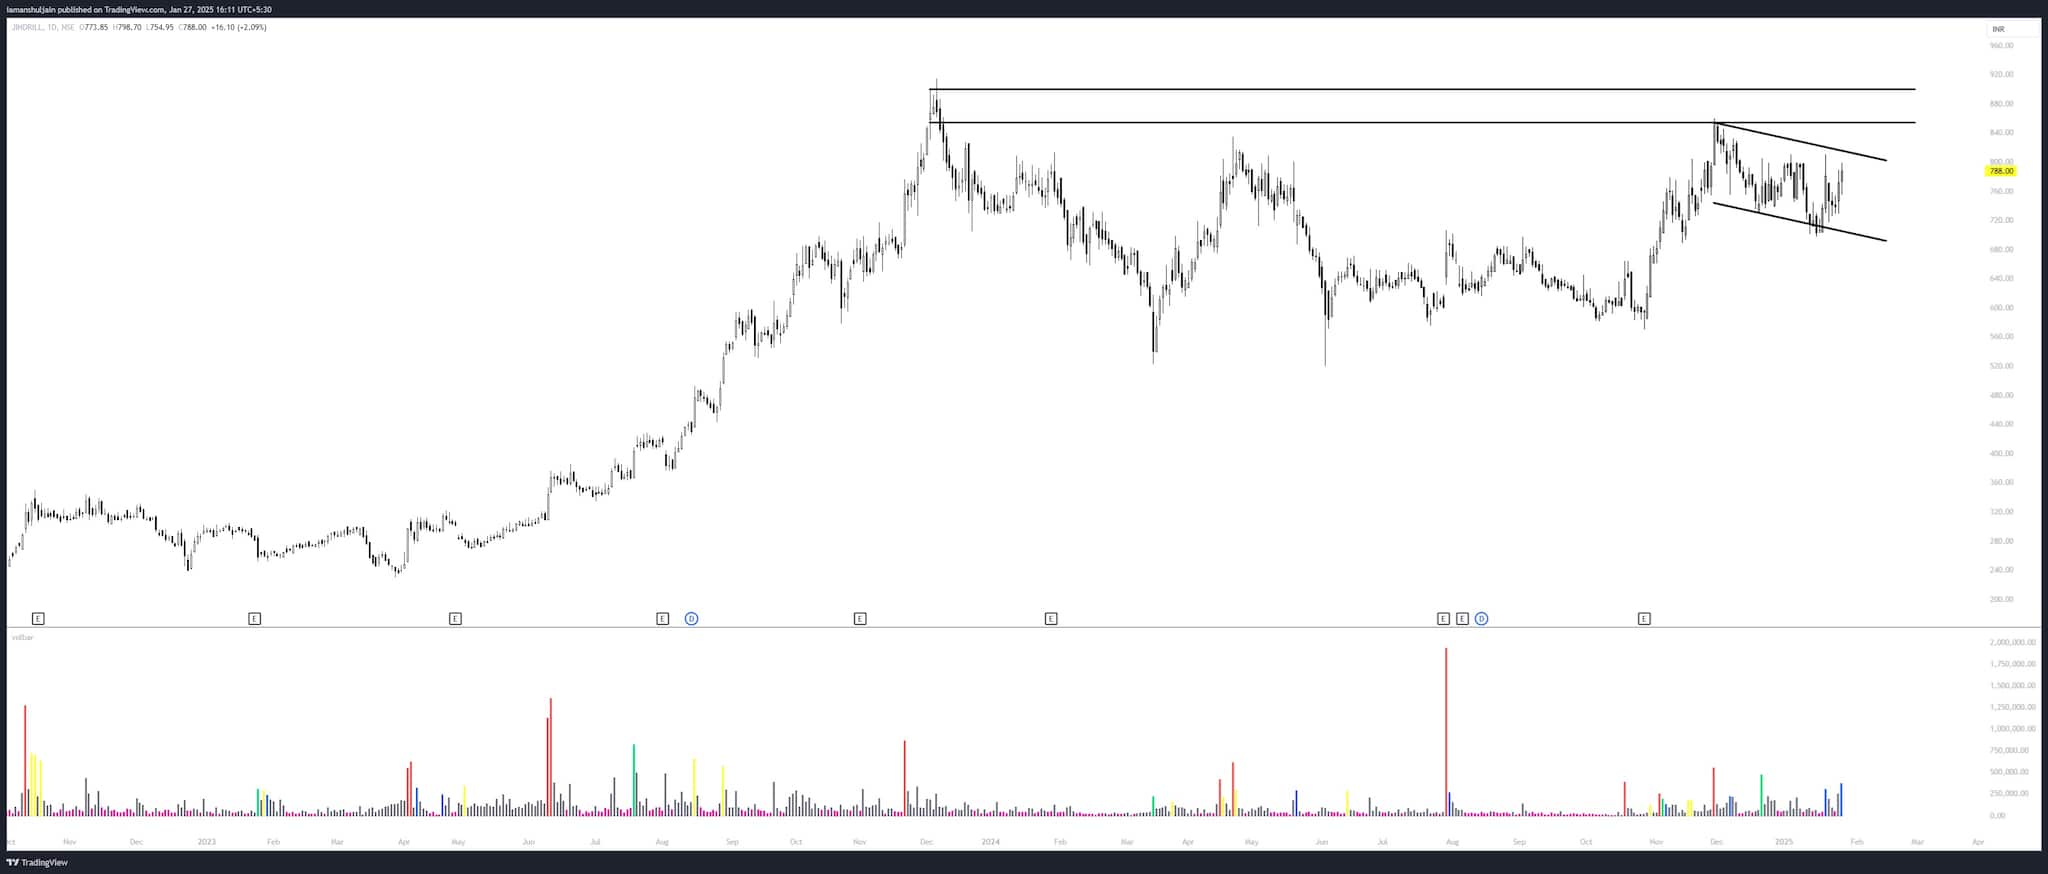
Jindal Drilling has been forming a 285-day-long Cup-and-Handle pattern, signaling strong accumulation. The handle’s right side features a bullish Flag, further reinforcing bullish momentum. A breakout above Rs 800 is anticipated to propel the stock to Rs 920 initially. Beyond Rs 920, the pattern breakout could lead to a rally toward Rs 1,100. With these robust technical indicators, Jindal Drilling is positioned for significant upside potential, making it a compelling watch for investors seeking momentum-driven opportunities.
Strategy: Buy
Target: Rs 920
Stop-Loss: Rs 740
Bajaj Finance | CMP: Rs 7,295.45
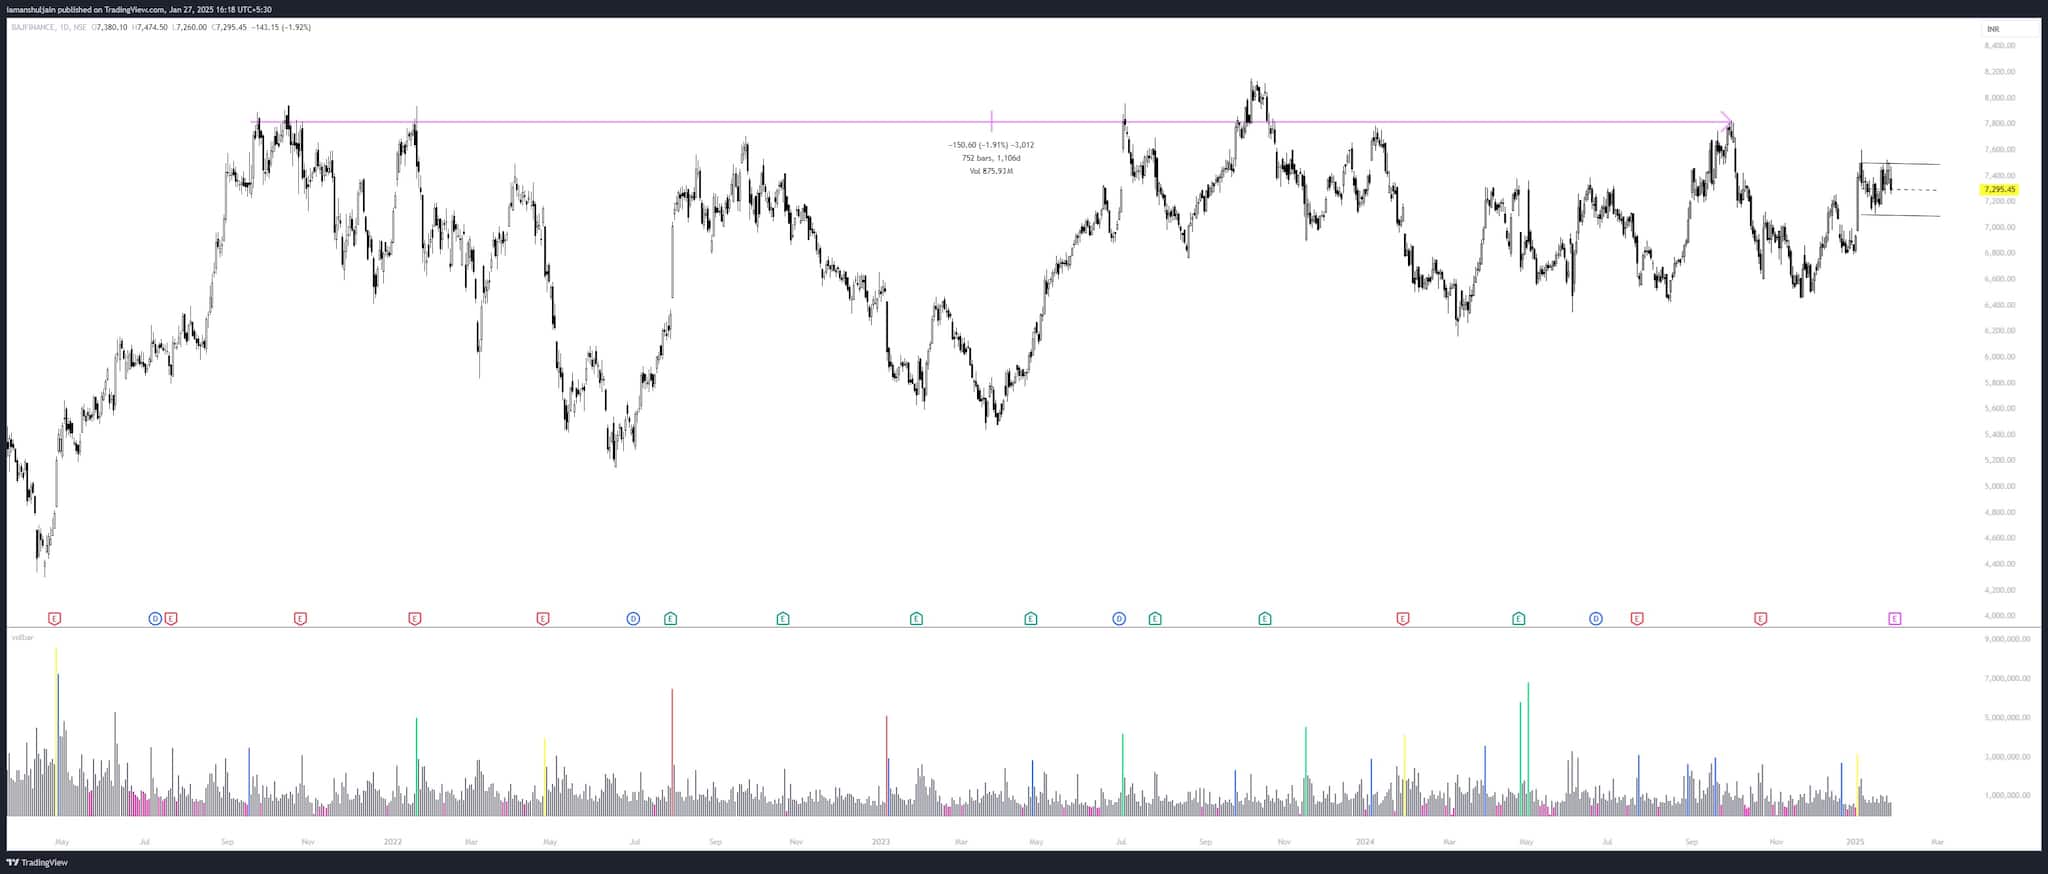
Bajaj Finance is forming a 752-day-long Volatility Contraction Pattern (VCP), showcasing strong consolidation. The right side of the pattern has tightened further with a 22-day Flag, signaling the build-up of bullish momentum. A breakout above Rs 7,450 is expected to drive the stock toward the pattern high of Rs 7,950. Beyond this level, a bold breakout could unfold, paving the way for substantial upside. Investors should keep a close eye on this promising technical setup.
Strategy: Buy
Target: Rs 7,590
Stop-Loss: Rs 7,190
Zensar Technologies | CMP: Rs 817.4
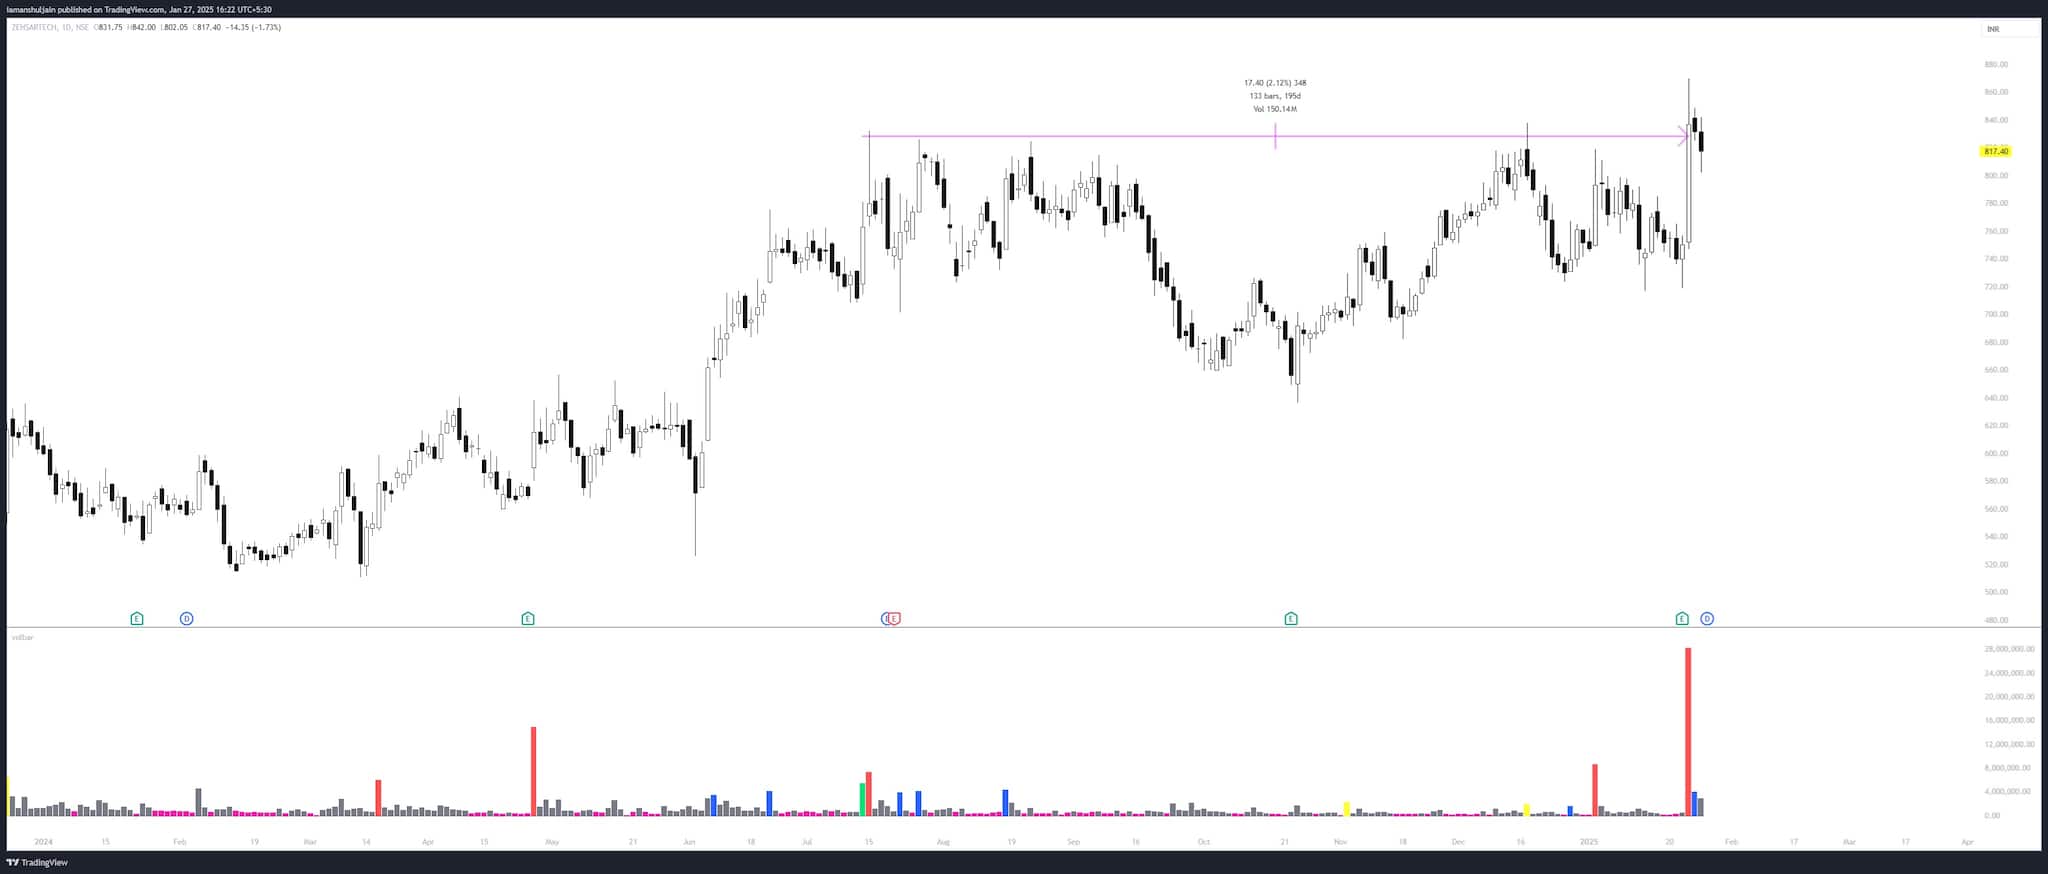
Zensar Technologies has broken out of a 133-day bullish Cup-and-Handle pattern with massive volumes of 28.3 million on Thursday, a remarkable 3,767% surge against the 50-day moving average. The last two sessions formed inside bars, signaling consolidation before the next move. A breakout above Rs 830 could ignite a rally, propelling the stock to Rs 1,000. With this robust technical setup and strong volume support, Zensar Technologies is well-positioned for significant upside. Keep an eye on Rs 830 for the next breakout trigger.
Strategy: Buy
Target: Rs 900
Stop-Loss: Rs 785
Disclaimer: The views and investment tips expressed by investment experts on Moneycontrol.com are their own and not those of the website or its management. Moneycontrol.com advises users to check with certified experts before taking any investment decisions.Discover the latest Business News, Sensex, and Nifty updates. Obtain Personal Finance insights, tax queries, and expert opinions on Moneycontrol or download the Moneycontrol App to stay updated!
Find the best of Al News in one place, specially curated for you every weekend.
Stay on top of the latest tech trends and biggest startup news.


